

Abstract
The nearly neutral theory of molecular evolution predicts that the efficacy of both positive and purifying selection is a function of the long-term effective population size (Ne) of a species. Under this theory, the efficacy of natural selection should increase with Ne. Here, we tested this simple prediction by surveying ∼1.5 to 1.8 Mb of protein coding sequence in the two subspecies of the European rabbit (Oryctolagus cuniculus algirus and O. c. cuniculus), a mammal species characterized by high levels of nucleotide diversity and Ne estimates for each subspecies on the order of 1 × 10⁶. When the segregation of slightly deleterious mutations and demographic effects were taken into account, we inferred that >60% of amino acid substitutions on the autosomes were driven to fixation by positive selection. Moreover, we inferred that a small fraction of new amino acid mutations (<4%) are effectively neutral (defined as 0 < Nes < 1) and that this fraction was negatively correlated with a gene’s expression level. Consistent with models of recurrent adaptive evolution, we detected a negative correlation between levels of synonymous site polymorphism and the rate of protein evolution, although the correlation was weak and nonsignificant. No systematic X chromosome–autosome difference was found in the efficacy of selection. For example, the proportion of adaptive substitutions was significantly higher on the X chromosome compared with the autosomes in O. c. algirus but not in O. c. cuniculus. Our findings support widespread positive and purifying selection in rabbits and add to a growing list of examples suggesting that differences in Ne among taxa play a substantial role in determining rates and patterns of protein evolution.
Keywords: proportion of adaptive substitutions, distribution of fitness effects, effective population size, McDonald–Kreitman test, nearly neutral theory, transcriptome
Introduction
The relative role of neutral and selective processes driving the evolution and divergence of populations has long been a matter of debate among evolutionary biologists (see, e.g., Nei 2005 for a review). During the 1960s, Motoo Kimura introduced the idea that observable genetic variation mostly reflects a balance between mutation and genetic drift, attributing a modest role to adaptation at the molecular level (“neutral theory of evolution”; Kimura 1968). In an important generalization of this model, Tomoko Ohta shifted the focus from strictly neutral mutations to nearly neutral mutations by initially incorporating the concept of “slightly deleterious” (Ohta 1973) and then “slightly advantageous” mutations into her “nearly neutral theory of molecular evolution” (reviewed by Ohta 1992). This model posits that the efficacy of natural selection depends on the long-term effective population size (Ne): the strong effect of genetic drift in small populations leads to the long-term segregation or potential fixation of slightly deleterious mutations and to the loss of slightly advantageous mutations at a higher rate than in populations with larger Ne.
The recent accumulation of large data sets of within-population molecular variation provides an unprecedented opportunity to use empirical data to assess the effects of natural selection on genome evolution across taxa. Extensions of the McDonald–Kreitman test of selective neutrality (McDonald and Kreitman 1991) have been commonly used to estimate α, the fraction of nonsynonymous divergence that has been driven by adaptive evolution (Fay et al. 2001; Bustamante et al. 2002; Smith and Eyre-Walker 2002; Sawyer et al. 2003; Bierne and Eyre-Walker 2004; Eyre-Walker and Keightley 2009). These methods have been applied to a variety of taxa and have shown great variation of the estimated value of α. High values of α (about 50% or higher) consistent with prevalent adaptive evolution have been estimated for organisms as diverse as Drosophila (Fay et al. 2002; Bachtrog 2008; Eyre-Walker and Keightley 2009), mice (Halligan et al. 2010), bacteria (Charlesworth and Eyre-Walker 2006; Lefebure and Stanhope 2009), or sunflowers (Strasburg et al. 2009). In contrast, lower values of α (20% or less) have been estimated, for example, in humans (Bustamante et al. 2005; Gojobori et al. 2007; Boyko et al. 2008; Halligan et al. 2010), chickens (Axelsson and Ellegren 2009), and Arabidopsis (Foxe et al. 2008; Slotte et al. 2010). Inferred distributions of deleterious fitness effects of mutations based on the site-frequency spectra (Keightley and Eyre-Walker 2007; Halligan et al. 2010; Slotte et al. 2010; Strasburg et al. 2011) and levels of constraint on protein coding sequences coming from genome-wide comparisons (Eyre-Walker et al. 2002; Lindblad-Toh et al. 2005; Popadin et al. 2007; Ellegren 2009) also indicate that the overall strength of purifying selection varies substantially across taxa. Supported by evolutionary theory, several authors have suggested that this heterogeneity is in great part explained by an association between Ne and the efficacy of natural selection (e.g., Eyre-Walker 2006; Ellegren 2009; Sella et al. 2009; Strasburg et al. 2011). Although this expectation seems to hold in most cases, some studies have questioned the generality of this relationship and suggested that population structure, historical demographics, or fitness effects of mutations differing between species may be stronger determinants of patterns of protein evolution rather than Ne (e.g., Bachtrog 2008; Gossmann et al. 2010).
Since the compared organisms vary in many aspects of their biology and demographic history, it is important to add data from additional species to the debate. In particular, with the exception of the house mouse and humans, the effects of natural selection on genome evolution have received little attention in mammals. In this context, the European rabbit (Oryctolagus cuniculus) provides a good model system. This species is endemic to the Iberian Peninsula. Events of vicariance induced by the climatic oscillations of the Pleistocene led to the allopatric evolution of two distinct subspecies (supplementary fig. 1, Supplementary Material online), which are thought to have diverged approximately 1.8 Ma (Branco et al. 2000; Carneiro et al. 2009): O. c. cuniculus, distributed across the Northeastern part of the Iberian Peninsula and central Europe and O. c. algirus, which inhabits the Southwestern part of the Iberian Peninsula. The two subspecies overlap along a Northwestern–Southeastern axis in the central Iberian Peninsula and exchange genes at variable rates across the genome (Branco et al. 2002; Geraldes, Carneiro, et al. 2008; Carneiro et al. 2009; Carneiro et al. 2010). Rabbits are characterized by surprisingly high levels of nucleotide diversity for a mammalian species (π = 1%), much higher, for example, than in humans (0.1%; Aquadro et al. 2001). Recent inferences suggest that these high levels of genetic diversity likely reflect high Ne, on the order of 1.6 × 10⁶ for O. c. algirus and 8.0 × 10⁵ for O. c. cuniculus (Carneiro et al. 2009). These estimates are more than an order of magnitude higher than in humans (Takahata 1993) and are even higher than in mice (Geraldes, Basset, et al. 2008). This makes rabbits an interesting model to test theoretical predictions based on the relationship between Ne and the efficacy of natural selection in mammals.
In this work, we generated and analyzed a large data set of protein coding sequence data in both subspecies of the European rabbit and the Iberian hare (Lepus granatensis). By jointly considering patterns of polymorphism and divergence at synonymous and nonsynonymous sites, we estimated the proportions of amino acid substitutions driven to fixation by positive selection and the distribution of deleterious selection coefficients among newly arising amino acid mutations. There is a clear prediction given the large Ne of rabbits: both positive and negative selection should be highly efficient in this species. Compared with other mammals, our results in rabbits should more closely resemble results in mice rather than those in humans. We further investigated whether the efficacy of natural selection differs between the autosomes and the X chromosome.
Materials and Methods
Sampling
We sampled six individuals (three males and three females) for each of the rabbit subspecies (supplementary fig. 1, Supplementary Material online). Our sampling scheme followed several criteria. First, to avoid potential substructure within subspecies, wild individuals were collected from a single region in the southwestern part of the Iberian Peninsula for the O. c. algirus subspecies and in a separate single region in the northeastern part of the Iberian Peninsula for the O. c. cuniculus subspecies. These regions are thought to correspond to the putative ancestral ranges and refugial areas of both subspecies during the Pleistocene glaciations (Branco et al. 2002). Second, to avoid relatedness among individuals within our sample, individuals were collected across a large sampling area (>10 km2). As expected, given this sampling strategy, we find no evidence for inbreeding, and Fis values averaged over all loci are close to 0 (data not shown). Finally, the two subspecies of the European rabbit are known to hybridize in central Iberia and previous studies have inferred extensive gene exchange between both taxa (Geraldes, Carneiro, et al. 2008; Carneiro et al. 2009; Carneiro et al. 2010). The sampling regions were therefore selected to be distant from the rabbit hybrid zone, thus reducing the influence of introgression in patterns of polymorphism within taxa. Prior to tissue harvesting, animals were reared in outdoor enclosures in the facilities of the University of Castilla la Mancha, Ciudad Real, Spain.
Tissue Collection, Library Preparation, and Sequencing
To obtain polymorphism data in rabbits, we sequenced the transcriptome of the brain frontal cortex. Data on the O. c. cuniculus subspecies were collected as part of a study comparing patterns of gene expression in the brain of both wild and domestic rabbits (Albert FW, submitted), and data on the O. c. algirus subspecies were collected for this study. Rabbits were anesthetized with intramuscular injection of ketamine (15 mg/kg body weight) and euthanized with intra cardiac injection of sodium pentobarbitone (100 mg/kg body weight). The brain was then snap-frozen in dry ice immediately after dissection. All experimental procedures were approved by the Ethical Committee for Animal Research of the University of Castilla la Mancha, Spain.
Frontal cortex tissues were homogenized in Trizol reagent (Invitrogen, Carlsbad, CA), total RNA was extracted by chloroform extraction, and purified using Qiagen RNEasy columns (Valencia, CA). Sequencing libraries were prepared in accordance with the standard Illumina RNA sample preparation protocol (Illumina Inc., San Diego) and we summarize the main procedures below. For polyA mRNA selection, we used poly-T covered magnetic beads and 10 μg of total RNA per sample. Purified mRNA was chemically fragmented followed by cDNA synthesis using random hexamer primers. The library of cDNA subsequently underwent blunt-end repair and was ligated to paired-end Illumina sequencing adapters. Finally, cDNA libraries were generated around a fragment size of ∼250 bp by gel cuts from agarose gels and enriched over 15 cycles of polymerase chain reaction (PCR) using universal priming sites present at the end of the Illumina sequencing adapters.
Libaries were sequenced on an Illumina GA II instrument (Illumina Inc.) with paired-end 51 bp reads and one lane of the flow cell per individual. Details on the number of reads can be found in supplementary table 1, Supplementary Material online. Base calling was carried out with the machine-learning algorithm Ibis (Kircher et al. 2009). Overlapping read pairs were merged into single sequences prior to read mapping. The raw data were submitted to the Sequence Reads Archive (SRA) of NCBI (accession number: SRP010451).
Read Mapping and Consensus/Genotype Calling
Sequence reads were mapped to the rabbit reference genome obtained from Ensembl (orycun2; http://www.ensembl.org/Oryctolagus_cuniculus/Info/Index) using the Burrows–Wheeler alignment (BWA; Li and Durbin 2009) tool with default parameters and assigned to genes based on the Ensembl Build 62 annotation. When multiple transcripts were available for a given gene due to alternative splicing, the longest transcript was kept. Since 5′ and 3′ untranslated regions are poorly identified in the current annotation of the rabbit genome, we restricted our analysis to synonymous and nonsynonymous sites. Identification of single-nucleotide polymorphisms (SNPs) and consensus/genotype calling in the alignment files generated by BWA were carried out using Samtools (Li et al. 2009). Prior to consensus/genotype calling, we: (1) removed PCR duplicates by collapsing molecules with identical mapping coordinates, choosing the read with the highest summed base qualities and (2) trimmed the first and last six bases from each aligned molecule to avoid problems that may be caused by nonrandom composition of the hexamer pools used during cDNA synthesis. Both quality control steps were performed using python scripts kindly provided by Martin Kircher. Only SNPs with a minimum quality of 20, root mean square (RMS) minimum mapping quality of 25, and at a distance of at least 10 bp from indel polymorphisms were considered. Such a stringent RMS mapping may help reduce alignment of recently diverged paralog sequences. Homozygote and heterozygote genotypes were accepted for each SNP if total sequence coverage was equal or higher than 8× and genotype quality equal or higher than 20× according to the SNP/genotype algorithm implemented in Samtools. If these latter criteria were not met, that specific position in a given individual was coded as missing data. Similar quality filters were used for consensus calling and positions not meeting the above criteria and located within 10 bp of an indel were masked as missing data. Details on sequence coverage per individual are given in supplementary table 1, Supplementary Material online. We produced two additional data sets. First, we produced a data set to test whether our results were robust to more stringent base quality criteria (sequence coverage higher than 20× and SNP/genotype and consensus quality higher than 30). Second, since rabbits are characterized by high levels of polymorphism (see Results), which may reduce mapping quality and bias our analysis toward less polymorphic regions, we investigated the effect of using less stringent mapping quality cutoffs (mapping quality higher than 15 and up to 12% mismatches per read compared with the 4% using BWA default parameters). The results obtained for both data sets remained similar to those generated with the original criteria (see Results). To further help overcome the existence of recently diverged paralogs in our data set, we calculated Hardy–Weinberg expectations for each SNP using the program Genepop (http://genepop.curtin.edu.au/) and all genes displaying positions with a significant excess of heterozygotes were removed from the analysis.
Out-group Data Set and Orthology Assignment
To obtain divergence information, we used sequence data from the Iberian hare (Lepus granatensis), which is thought to have diverged from the European rabbit ∼11.8 Ma (Matthee et al. 2004). These data were obtained in a previous study where the transcriptome of a pool of several tissues was sequenced for several L. granatensis individuals using a combination of 454 and Illumina reads and subsequently assembled into contigs (Cahais V, submitted). We used the F assembly protocol, as described by Cahais V (submitted) but retained all contigs, including those with less than 200 bp, in order to maximize the number of analyzed genes. L. granatensis contigs were BLASTed against the current annotation of the rabbit genome and only 1:1 relationships according to the categories “full” and “fragment” described in Cahais V (submitted) were retained. Briefly, these two categories include contigs with a single significant hit in a single rabbit gene and also contigs with multiple significant hits in the same rabbit gene but in nonoverlapping regions of that gene. Sets of homologous protein sequences were subsequently aligned using MUSCLE (Edgar 2004) and back-translated to aligned codon sequences.
Data Analysis
Summary Statistics
All polymorphism and divergence statistics and synonymous and nonsynonymous site-frequency spectra for each gene were obtained using the library of perl scripts PolyMORPHOrama (Haddrill et al. 2008). Codons with missing data or overlapping insertion–deletion polymorphisms were removed from subsequent analysis. Sites with more than two alleles segregating were also not considered. The number of synonymous and nonsynonymous sites and counts were estimated using the method of Nei and Gojobori (1986). We estimated the neutral mutation parameter (4Neμ for autosomal loci and 3Neμ for X-linked loci), where Ne is the effective population size and μ is the mutation rate per site per generation, using two estimators: (1) the corrected proportion of segregating sites in a sample (θw; Watterson 1975) and (2) the average number of pairwise differences in a sample (π; Nei 1987). The frequency spectrum of polymorphisms was summarized using Tajima’s D (Tajima 1989). Divergence estimates to the out-group were summarized by estimating the average number of pairwise differences between all rabbit samples and L. granatensis (Dxy; Nei 1987). To investigate the extent to which levels of nonsynonymous polymorphism deviate from neutrality for individual genes, we estimated the neutrality index (NI). NI was calculated as (Pn/Ps)/(Dn/Ds) following Rand and Kann (1996), where Ps and Pn are the counts of synonymous and nonsynonymous polymorphisms, and Ds and Dn are the counts of synonymous and nonsynonymous divergence sites. Under neutrality, NI has an expected value of 1, with values lower than 1 reflecting a paucity of nonsynonymous polymorphism relative to nonsynonymous divergence, indicative of positive selection, whereas values higher than 1 reflect an excess of nonsynonymous polymorphism relative to nonsynonymous divergence, indicative of negative or balancing selection. We performed these calculations for genes with at least four variable nonsynonymous sites in the alignment either as divergence or as polymorphism (Pn + Dn ≥ 4), and one pseudo-count was added to all cells if any site class had a count of zero (Meiklejohn et al. 2007).
Proportion of Adaptive Amino Acid Fixations by Positive Selection and Distribution of Deleterious Fitness Effects of New Mutations
We used three different methods to estimate the fraction of nonsynonymous substitutions driven to fixation by positive selection (α), and in all three methods, synonymous sites were used as the neutral reference. First, we used two methods based on the McDonald–Kreitman approach (McDonald and Kreitman 1991) that assume a population of constant size at equilibrium and use the ratio of the number of polymorphic and divergent mutations for neutral and selected classes: (1) the estimator proposed by Fay et al. (2001), which is described as α = 1 − [∑ (Ds) ∑ (Pn)/∑ (Dn) ∑ (Ps)], where Dn and Ds are the sum of divergent sites for selected and neutral classes, respectively, and Pn and Ps are the sum of polymorphic sites for selected and neutral classes, respectively and (2) the maximum-likelihood method proposed by Bierne and Eyre-Walker (2004) as implemented in the computer program DoFE (http://www.lifesci.sussex.ac.uk/home/Adam_Eyre-Walker/Website/Software). Since both these methods assume that all segregating polymorphisms are neutral and it has been shown that weakly deleterious mutations cause a downward bias in estimates of α using these methods (Fay et al. 2002; Charlesworth and Eyre-Walker 2008), we sought to reduce the potential influence of weakly deleterious mutations by excluding singleton polymorphisms. Second, we used the method of Eyre-Walker and Keightley (2009) as implemented in the DFE_alpha webserver (http://www.homepages.ed.ac.uk/eang33/). This method uses nucleotide polymorphism frequency spectra and between-species nucleotide divergences and relies on an explicit population genetic model to jointly estimate α and demographic parameters of an instantaneous population size change sometime in the past while taking into account the segregation of slightly deleterious mutations (see Eyre-Walker and Keightley 2009 and Halligan et al. 2010 for more details).
Using allele frequency distributions for nonsynonymous and putatively neutrally evolving synonymous sites, we used the approach of Keightley and Eyre-Walker (2007) to infer properties of the distribution of deleterious fitness effects (DFEs) of new nonsynonymous mutations. These analyses were also conducted using the DFE_alpha webserver (http://www.homepages.ed.ac.uk/eang33/). Confidence intervals (CIs) (95%) of α and DFE were derived from 200 bootstrap replicates by locus. To test whether estimates of α and properties of the DFE differed between the autosomes and the X chromosome, we compared the distribution of values resulting from the bootstrap replicates (see Keightley and Eyre-Walker 2007).
Gene Expression Analyses
To compute gene expression levels, we mapped reads to the rabbit genome using the program Tophat (Trapnell et al. 2009), followed by calculation of FPKM (“fragments per kilobase of gene model and million mapped reads”; Mortazavi et al. 2008) for each rabbit gene in the Ensembl Build 60 annotation using the program Cufflinks (Trapnell et al. 2010). FPKM values were calculated separately for each individual, and genes were binned into abundance classes according to their median FPKM values across all 12 individuals.
Gene Ontology Enrichment Analyses
Statistical analyses of functional overrepresentation were carried out using hypergeometric tests with a false discovery rate correction for multiple testing of 10% by means of the computer program FUNC (Prufer et al. 2007; http://func.eva.mpg.de). Gene Ontology (GO) annotations were obtained from Ensembl Build 62 using the BioMart tool (Durinck et al. 2005).
Results
To study within-species nucleotide polymorphism in coding regions of both subspecies of the European rabbit, we sequenced the transcriptome of the brain frontal cortex. In addition, we obtained between-species divergence from a previous study that targeted the transcriptome of several tissues in L. granatensis (Cahais V, unpublished data). We restricted the analysis to sites for which all individuals within a subspecies have been sequenced and passed the criteria for SNP/genotype and consensus calling (see Materials and Methods) and for which we had out-group information. The analyses reported below were conducted on 3547 genes (3433 autosomal and 114 X-linked) with a total of 1,426,126 nonsynonymous sites and 439,832 synonymous sites in O. c. algirus and on 3484 genes (3076 autosomal and 109 X-linked) with a total of 1,134,872 nonsynonymous sites and 354,550 synonymous sites in O. c. cuniculus (table 1). The average alignment length per gene was 526 bp in O. c. algirus and 428 bp in O. c. cuniculus.
Table 1.
Summary of the Analyses of Polymorphism, Frequency Spectrum Tests of Neutrality and Divergence for Nonsynonymous (NonSyn) and Synonymous (Syn) Sites.
| Subspecies | Locus | Site Class | Nbpa | Mean π (%)b | Mean θw (%)c | Mean DTd | Mean Dxy (%)e |
|---|---|---|---|---|---|---|---|
| O. c. algirus | Autosomal | NonSyn | 1,378,469 | 0.043 (0.038; 0.049) | 0.054 (0.048; 0.061) | −0.54 (−0.59;−0.49) | 0.470 (0.446; 0.503) |
| Syn | 424,921 | 0.807 (0.774; 0.841) | 0.914 (0.876; 0.954) | −0.36 (−0.38; −0.33) | 5.629 (5.500; 5.802) | ||
| X chromosome | NonSyn | 47,657 | 0.012 (0.006; 0.021) | 0.018 (0.009; 0.029) | −0.78 (−1.00; −0.52) | 0.272 (0.181; 0.378) | |
| Syn | 14,911 | 0.467 (0.378; 0.592) | 0.490 (0.395; 0.620) | −0.10 (−0.30; 0.09) | 4.346 (3.498; 5.026) | ||
| O. c. cuniculus | Autosomal | NonSyn | 1,095,834 | 0.038 (0.034; 0.042) | 0.048 (0.044; 0.054) | −0.55 (−0.61; −0.49) | 0.472 (0.436; 0.520) |
| Syn | 342,177 | 0.722 (0.686; 0.766) | 0.832 (0.791; 0.882) | −0.38 (−0.42; −0.34) | 5.498 (5.325; 5.675) | ||
| X chromosome | NonSyn | 39,038 | 0.012 (0.005; 0.021) | 0.014 (0.006; 0.025) | −0.39 (−0.84; 0.06) | 0.375 (0.208; 0.570) | |
| Syn | 12,373 | 0.293 (0.211; 0.385) | 0.317 (0.236; 0.414) | −0.24 (−0.45; 0.02) | 4.798 (3.664; 6.024) |
Note.—Unweighted average values across all genes; 95% CIs are shown in parentheses and were calculated by bootstrapping 1,000 times by locus.
a Number of base pairs analyzed in each site class.
b Average number of pairwise differences in a sample (Nei 1987).
c Proportion of segregating sites in a sample (Watterson 1975).
d Tajima's D (Tajima 1989).
e Average number of pairwise differences (Nei 1987) between rabbit and the Iberian hare.
Genome-Wide Levels and Patterns of Polymorphism and Effective Population Size Estimates
Polymorphism, divergence, and frequency-spectrum summary statistics averaged over all genes are summarized in table 1. Levels of synonymous genetic variation were high in both subspecies. Levels of nucleotide diversity at synonymous sites for autosomal loci were slightly higher in O. c. algirus (π = 0.807%; θw = 0.914%) than in O. c. cuniculus (π = 0.722%; θw = 0.832%) and estimates for X-linked loci followed a similar trend (O. c. algirus π = 0.467%; θw = 0.490% vs. O. c. cuniculus π = 0.293%; θw = 0.317%). When we compared the levels of synonymous site genetic diversity (θw) between the autosomes and the X chromosome within subspecies, we observed that the X chromosome showed lower levels of diversity than the 75% expectation of the standard neutral model, even after correcting for mutation rate differences (i.e., synonymous θw divided by synonymous Dxy). Levels of X-linked variation were 69.8% of autosomal levels in O. c. algirus (θw/Dxy X-linked = 0.113; θw/Dxy autosomal = 0.162) and 43.7% in O. c. cuniculus (θw/Dxy X-linked = 0.066; θw/Dxy autosomal = 0.151). All the patterns described above are in agreement with previous studies using a smaller data set of intronic sequences (Carneiro et al. 2009; Carneiro et al. 2010). Consistent with purifying selection acting on amino acid substitutions, estimates of nucleotide diversity on nonsynonymous sites compared with synonymous sites were more than an order of magnitude lower on the autosomes (O. c. algirus θnonsynonymous/θsynonymous = 0.059; O. c. cuniculus θnonsynonymous/θsynonymous = 0.058) and X chromosome (O. c. algirus θnonsynonymous/θsynonymous = 0.037; O. c. cuniculus θnonsynonymous/θsynonymous = 0.044). Interspecific divergence and intraspecific polymorphism for synonymous sites in our autosomal data set (θw O. c. algirus = 0.914%; θw O. c. cuniculus = 0.832%; Dxy O. cuniculus–L. granatensis = 5.498–5.629%) are slightly higher than published estimates for intronic sequences (θw O. c. algirus = 0.777%; θw O. c. cuniculus = 0.677%; Dxy O. cuniculus–L. granatensis = 4.093%; Carneiro et al. 2010), suggesting that synonymous sites are most likely under less selective constraint than intronic sites and may provide a more appropriate neutral reference as has been observed for other mammals (Halligan et al. 2010). Alternatively, this difference can also be explained by a higher genotyping error rate in Illumina sequencing/mapping than in Sanger sequence data.
A negative Tajima's D (Tajima 1989) was obtained for synonymous sites in O. c. algirus and O. c. cuniculus, both for the autosomes and X chromosome. This overall trend has been observed before for intronic data (Carneiro et al. 2009; Carneiro et al. 2010), indicating a skew toward rare polymorphisms across the genome that might be explained by a recent population size expansion (see below). In all comparisons, nonsynonymous sites showed a higher proportion of low-frequency polymorphisms when compared with synonymous sites (i.e., a more negative Tajima’s D), suggesting that a substantial number of nonsynonymous polymorphisms are under purifying selection and are being kept at low frequencies. These patterns can be seen in figure 1 where the observed and expected allelic frequency spectra are summarized. When we used more stringent SNP/genotype and consensus quality criteria as well as less stringent mapping quality cutoffs, levels of polymorphism and the frequency spectrum of mutations in both subspecies remained qualitatively similar (supplementary tables 2 and 3, Supplementary Material online).
Fig. 1.

Unfolded site frequency spectrum of nonsynonymous (black bars) and synonymous (gray bars) mutations for autosomes and X chromosome in both subspecies of the European rabbit. White bars represent the expected site frequency spectrum. We used data on hares to infer the ancestral state of each polymorphism.
We estimated effective population sizes (Ne) of both subspecies using autosomal synonymous site diversity and a simple mutation drift expectation (θ = 4Neμ; where θ is the average θw across all autosomal genes and μ is the neutral mutation rate per site per generation). μ was calculated from divergence estimates to L. granatensis using the following relationship: μ = D/(2t + 4Ne) (Kimura 1983), where D is the genome-wide average Dxy (Nei 1987) for synonymous sites between rabbits and L. granatensis (table 1; averaged between O. c. algirus and O. c. cuniculus), t is 11.8 Ma, the published divergence time between both taxa (Matthee et al. 2004), and Ne is the ancestral effective population size. We used a generation time of 1 year (Soriguer 1983) and for the ancestral effective population size, we used both a large (1,000,000) and a small effective population size value (10,000). Estimates of μ generated using these ancestral effective population size values were between 2.02 × 10⁻⁹ and 2.35 × 10⁻⁹ mutations per site per generation, which is similar to but slightly lower than estimates in mice (μ = 3.4−4.1 × 10⁻⁹; Keightley and Eyre-Walker 2000; Geraldes, Basset, et al. 2008). This μ values converted into Ne estimates of 972,340–1,131,188 for O. c. algirus and 885,106–1,029,703 for O. c. cuniculus. These estimates are of the same order of magnitude of those generated under an isolation-with-migration model (Hey and Nielsen 2004; Hey and Nielsen 2007) using intronic data (Ne O. c. algirus = 1,600,000; Ne O. c. cuniculus = 800,000; Carneiro et al. 2009). Thus, the high levels of genetic diversity observed in rabbits suggest large long-term effective population sizes.
Properties of the Distribution of Fitness Effects of New Amino Acid Mutations
Next, we investigated the distribution of fitness effects (DFEs) of new amino acid mutations from the site frequency spectrum following the maximum-likelihood method of Keightley and Eyre-Walker (2007). This method incorporates the effects of recent demographic changes by fitting a model of a population at equilibrium of size (N1), which undergoes a step change in size (N2)—which can be either population expansion or contraction—t generations in the past.
Estimates of the demographic parameters and the proportion of mutations falling in different Nes categories are detailed in table 2. Overall, autosomal parameter estimates showed narrower 95% CIs than X chromosomal parameters, which is likely explained by the much larger data set in the former. Consistent with the excess of low frequency variants in synonymous sites, we inferred a several fold population size expansion for both subspecies, both for the autosomes and X chromosome. The magnitude of this expansion was highly variable across subspecies and chromosome type, with ratios of the final to the initial population size ranging from 2.31- to 7.99-fold growth, but CIs for individual estimates were large and overlapped considerably. Of note, most CIs had their lower value above 1, strongly supporting population growth.
Table 2.
Estimates of the Distribution of Fitness Effects of New Amino Acid Mutations Falling in Different Nes Ranges and Associated Demographic Parameters.
| Percentage of mutations in different Nes ranges |
|||||||
|---|---|---|---|---|---|---|---|
| Subspecies | Locus | N2/N1a | t/N2b | βc | 0–1 | 1–10 | >10 |
| O. c. algirus | Autosomes | 5.45 (3.38; 10.00) | 1.23 (0.95; 1.48) | 0.268 (0.243; 0.323) | 3.0 (2.6; 3.5) | 2.5 (2.0; 3.0) | 94.5 (94.1; 94.9) |
| X chromosome | 2.31 (0.10; 10.00) | 1.90 (0.05; 36.59) | 1.111 (0.380; infinity) | 0.3 (0.0; 1.8) | 3.9 (0.0:5.1) | 95.8 (94.4; 100.0) | |
| O. c. cuniculus | Autosomes | 7.99 (3.38; 10.00) | 1.31 (0.66; 1.43) | 0.287 (0.223; 0.355) | 3.1 (2.7; 3.7) | 2.9 (2.3; 3.4) | 94.0 (93.4; 94.4) |
| X chromosome | 2.79 (1.29; 10.00) | 4.39 (0.41; 27.77) | 0.263 (<0.05; infinity) | 3.7 (0.7; 6.6) | 3.0 (0.4; 6.7) | 93.3 (89.8; 97.7) | |
Note.—95% CIs are shown in parentheses and were estimated by bootstrapping 200 times by locus.
a N2/N1 is the estimated demographic model—relative difference between current (N2) and ancestral (N1) population size.
b Timing of growth (t) scaled in units of the current population size (N2).
c Shape parameter of the estimated gamma distribution.
The splitting of the DFE into different Nes categories is highly consistent across comparisons (i.e., for the X chromosome and autosomal data in both subspecies; table 2). The common trend is that the great majority of mutations (93.3–95.8%) were inferred to be strongly deleterious (Nes >10) and thus have a very small chance of getting fixed in the population. On the other end of the spectrum, nearly neutral mutations (defined as 0 < Nes < 1) were inferred to be extremely uncommon in all comparisons (0.3–3.7%). With the exception of the O. c. algirus X chromosome, the shape parameter of the distribution (β) was below 1, suggesting that the DFE in rabbits is leptokurtic. All these results remained qualitatively unchanged when we employed more stringent SNP/genotype and consensus calling thresholds (supplementary table 4, Supplementary Material online) and less stringent mapping quality thresholds (supplementary table 5, Supplementary Material online).
Fraction of Amino Acid Substitutions Driven to Fixation by Positive Natural Selection (α)
Estimates of α using three different methods are summarized in figure 2 and detailed in supplementary table 6, Supplementary Material online. Using the method of Eyre-Walker and Keightley (2009), estimates of α for the autosomes in both rabbit subspecies were high and approximately 60%. Both estimates were significantly different from zero, with a lower bound of the 95% CIs of 57% for O. c. algirus and 53% for O. c. cuniculus. For the X chromosome data, α was significantly higher when compared with autosomal data in O. c. algirus and with a surprisingly high point estimate of 95% CI 74–100%, but in O. c. cuniculus, our point estimate for the X chromosome (52%) was lower than that for the autosomes; however, CIs were large (95% CI −5% to 92%). Estimates of α using the Fay et al. (2001) and Bierne and Eyre-Walker (2004) methods were also high, but in all cases, the values were lower than those inferred using the method of Eyre-Walker and Keightley (2009). This discrepancy may be in part explained by the fact that the Eyre-Walker and Keightley (2009) method explicitly incorporates segregating deleterious mutations in the α estimation. These mutations are expected to rarely become fixed; therefore, they should contribute more to polymorphism than to divergence. Even if we expect estimates of the Fay et al. (2001) and Bierne and Eyre-Walker (2004) methods to be downwardly biased, the lower bound of the 95% CIs using these two methods for the autosomes were always above 24%. As above, these results were robust to more stringent SNP/genotype and consensus calling thresholds (supplementary table 7, Supplementary Material online) and less stringent mapping quality thresholds (supplementary table 8, Supplementary Material online).
Fig. 2.

Proportion of amino acid substitutions driven to fixation by positive selection (α) in the autosomes (white) and X chromosome (gray) estimated using three different methods. FWW01: method of Fay et al. (2001); BEW04: method of Bierne and Eyre-Walker (2004); EWK09: method of Eyre-Walker and Keightley (2009).
Synonymous Site Polymorphism versus Nonsynonymous Site Divergence
Recurrent hitchhiking models predict a reduction in neutral diversity levels surrounding rapidly evolving proteins due to repeated hitchhiking effects associated with closely linked beneficial mutations (Maynard Smith and Haigh 1974; Wiehe and Stephan 1993). To test this idea, we asked whether synonymous polymorphism (assumed to be the neutral background) is reduced relative to the rate of nonsynonymous divergence at the genome-wide level. To reduce sampling noise associated with the small number of sites available for some genes, we restricted these analyses to genes encompassing more than 300 synonymous sites (nonsynonymous sites are expected to be approximately three times as many).
In figure 3, we show a significant positive correlation between synonymous (Dxy Syn) and nonsynonymous site divergence (Dxy Nonsyn; Spearman's rank correlation, R = 0.29, P < 0.001), indicating that mutation rate variation across genes is a strong predictor of levels of protein evolution. Therefore, to account for mutation rate differences among genes, we divided θw estimates by Dxy Syn. When we used these corrected estimates of diversity, we found a weak negative correlation between θw/Dxy Syn and Dxy Nonsyn in both subspecies as predicted by recurrent adaptive protein evolution models (fig. 3), although not significant in either case (O. c. algirus Spearman's rank correlation, R = −0.04, P = 0.55; O. c. cuniculus Spearman's rank correlation, R = −0.10, P = 0.33). Unfortunately, the rabbit genetic map is not detailed enough to allow a more detailed study incorporating the impact of recombination rate variation on levels of polymorphism. Our results suggest, at most, a modest reduction in synonymous site polymorphism associated with increasing rates of protein evolution.
Fig. 3.
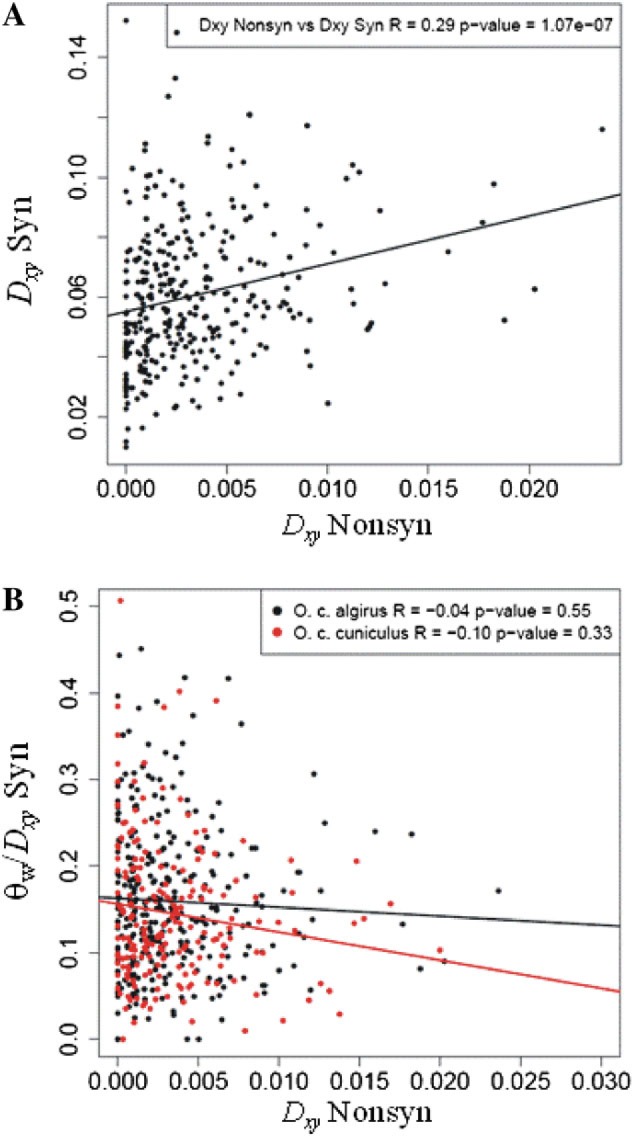
(A) Synonymous site divergence (Dxy Syn) versus nonsynonymous site divergence (Dxy Nonsyn) for each gene and (B) ratio of synonymous site diversity (θw) to synonymous site divergence (Dxy Syn) versus nonsynonymous site divergence (Dxy Nonsyn) in Oryctolagus cuniculus algirus and O. c. cuniculus. Only genes with more than 300 synonymous sites were considered. Spearman rank correlation coefficients (R) and associated P-values are indicated.
Positive and Negative Selection with Varying Levels of Gene Expression
Gene expression levels have been shown to strongly impact rates of protein evolution (e.g., Pal et al. 2001; Subramanian and Kumar 2004; Drummond et al. 2005; Lemos et al. 2005). However, the mechanisms behind this observation are less clear. In this context, we extracted gene expression levels from our brain transcriptome data and investigated whether α and the DFE of new amino acid mutations differed with variation in levels of expression. To accomplish this, genes were binned into four equally sized groups based on levels of gene expression. It should be noted that our sequencing data do not include genes with extremely low expression due to insufficient coverage for consensus and SNP/genotype calling.
In agreement with previous studies, we found a consistent and significant reduction in divergence at nonsynonymous relative to synonymous sites (dN/dS) between rabbits and humans and between rabbits and mice (data downloaded from Ensembl) with increasing levels of expression (table 3; Mann–Whitney U test, P < 0.01 for all pairwise comparisons between bins). Regarding the DFE (table 3), as average expression levels increased, we inferred in both subspecies a progressive reduction in the proportion of nearly neutral mutations (0 < Nes < 1) and an increase in the proportion of strongly deleterious mutations (Nes > 10). This effect, however, was modest and CIs between neighboring bins were largely overlapping. No clear trend was found for α (table 3). These findings based on a combination of polymorphism and divergence data suggest that negative selection is likely to play a more important role than positive selection in determining rates of protein divergence between species in highly and lowly expressed genes (e.g., see Subramanian and Kumar 2004 and Kosiol et al. 2008 for similar conclusions based on divergence statistics).
Table 3.
Proportion of Amino Acid Substitutions Driven to Fixation by Positive Selection (α) and Properties of the Distribution Effects of New Amino Acid Mutations for Varying Levels of Gene Expression.
| dN/dSb |
α |
Percentage of mutations in different Nes categories |
|||||||
|---|---|---|---|---|---|---|---|---|---|
| Subspecies | FPKMa | Rabbits/Humans | Rabbits/Mice | αFWW01c | αBEW04d | αEWK09e | 0–1 | 1–10 | >10 |
| O. c. algirus | 14.4 | 0.139 | 0.129 | 0.44 (0.30; 0.57) | 0.45 (0.25; 0.60) | 0.53 (0.36; 0.70) | 5.0 (3.3; 6.6) | 2.5 (0.7; 4.8) | 92.6 (90.7; 94.2) |
| 28.6 | 0.112 | 0.097 | 0.50 (0.38; 0.60) | 0.51 (0.40; 0.60) | 0.69 (0.56; 0.79) | 3.3 (2.1; 4.8) | 3.8 (2.5; 5.0) | 92.9 (91.7; 93.7) | |
| 49.8 | 0.094 | 0.080 | 0.45 (0.37; 0.53) | 0.49 (0.41; 0.56) | 0.58 (0.47; 0.71) | 3.2 (2.4; 3.9) | 2.2 (1.2; 2.9) | 94.6 (93.9; 95.1) | |
| 184.9 | 0.086 | 0.071 | 0.56 (0.49; 0.63) | 0.55 (0.48; 0.61) | 0.68 (0.60; 0.75) | 2.3 (1.7; 3.0) | 2.3 (1.7; 2.8) | 95.4 (94.6; 96.1) | |
| O. c. cuniculus | 13.9 | 0.138 | 0.128 | 0.49 (0.32; 0.62) | 0.41 (0.14; 0.59) | 0.67 (0.47; 0.80) | 3.7 (2.3; 5.5) | 4.5 (2.3; 5.9) | 91.9 (90.1; 93.6) |
| 28.9 | 0.113 | 0.098 | 0.47 (0.34; 0.58) | 0.48 (0.34; 0.59) | 0.67 (0.54; 0.76) | 3.4 (2.4; 4.7) | 4.1 (2.4; 5.6) | 92.5 (91.0; 93.5) | |
| 50.6 | 0.094 | 0.080 | 0.41 (0.32; 0.50) | 0.45 (0.35; 0.54) | 0.52 (0.34; 0.64) | 3.2 (2.3; 4.4) | 3.0 (0.7; 3.5) | 93.8 (93.0; 94.5) | |
| 187.0 | 0.085 | 0.070 | 0.44 (0.36; 0.52) | 0.40 (0.30; 0.49) | 0.64 (0.53; 0.71) | 2.5 (1.9; 3.1) | 2.7 (2.1; 3.4) | 94.8 (94.2; 95.5) | |
Note.—95% CIs are shown in parentheses.
a Median fragments per kilobase of gene model and million reads values among all O. c. algirus and O. c. cuniculus individuals and averaged across genes for each expression bin.
b Average dN/dS values between rabbit and humans and between rabbit and mice.
c FWW01: method of Fay et al. (2001).
d BEW04: method of Bierne and Eyre-Walker (2004).
e EWK09: method of Eyre-Walker and Keightley (2009).
Positive and Negative Selection and GO Analysis
We finally asked if any GO terms (molecular function or biological process) are being affected significantly more by positive or negative selection. To accomplish this, we evaluated for each gene the direction and degree of departure from a neutral model using the NI (see Materials and Methods). Given the reduced number of mutations per gene, which comes at a cost of reduced power to reject neutrality, we ordered genes by NI and asked whether there was an overrepresentation of functional categories on the lower and upper 5% tails of the empirical distribution (table 4). To distinguish between negative and balancing selection regimes for NI values greater than 1, we assumed genes to be under negative selection if Tajima’s D values were negative for nonsynonymous sites. Genes present in the 5% lower tail of both subspecies (i.e., consistent with positive selection) were significantly enriched for biological function terms associated with several metabolic processes. Among the molecular functions, we found an overrepresentation of multiple terms associated with inhibitory/regulatory activities of peptidases and endopeptidases. Genes found in the 5% upper tail of the empirical distribution, with Tajima’s D values consistent with negative selection, were not significantly enriched for any particular molecular function, but among the biological processes, we found an overrepresentation of cellular respiration terms.
Table 4.
Overrepresented Biological Processes and Molecular Functions Among Positive- and Negative-Selected Genes.
| Type of selection | Category | Function | GO term | P-valuea |
|---|---|---|---|---|
| Positive selection | Biological process | Carboxylic acid metabolic process | GO:0019752 | 0.01 |
| Cellular ketone metabolic process | GO:0042180 | 0.01 | ||
| Oxoacid metabolic process | GO:0043436 | 0.01 | ||
| Organic acid metabolic process | GO:0006082 | 0.01 | ||
| Molecular function | Endopeptidase inhibitor activity | GO:0004866 | 0.03 | |
| Endopeptidase regulator activity | GO:0061135 | 0.02 | ||
| Enzyme inhibitor activity | GO:0004857 | 0.05 | ||
| NADP binding | GO:0050661 | 0.05 | ||
| Peptidase inhibitor activity | GO:0030414 | 0.02 | ||
| Peptidase regulator activity | GO:0061134 | 0.02 | ||
| Serine-type endopeptidase inhibitor activity | GO:0004867 | 0.02 | ||
| Negative selection | Biological process | Cellular respiration | GO:0045333 | 0.05 |
a Correction for multiple testing was performed using a false discovery rate of 10%.
Discussion
We studied nucleotide polymorphism and between-species divergence in ∼1.5 to 1.8 Mb of protein coding sequence in both subspecies of the European rabbit and report three main findings. First, several statistical methodologies support a widespread role for adaptive protein evolution in rabbits. Second, a small proportion of newly arising amino acid mutations were inferred to be effectively neutral in each subspecies. Finally, we found no evidence for a clear trend in the efficacy of selection when the autosomes and the X chromosome were compared. Our findings in rabbits seem to fit the emerging pattern that differences in the efficacy of both positive and purifying selection among taxa are largely driven by differences in Ne.
Large Proportion of Beneficial Amino Acid Substitutions in Rabbits
Using our large-scale survey of protein coding polymorphism in the European rabbit, we inferred that a significant fraction of amino acid substitutions were driven to fixation by positive selection (α). Our estimates of α varied slightly among different methods (fig. 2), but when we attempted to control for demographic effects and segregation of slightly deleterious mutations using the method of Eyre-Walker and Keightley (2009), estimates of α were approximately 60% for the autosomes in both subspecies. Using the same method, estimates were also large for the X chromosome with a point estimate of 95% and 52% for O. c. algirus and O. c. cuniculus, respectively.
Genome-wide estimates of α could be biased if genes expressed in brain were a subset of fast or slow evolving genes. To test whether genes in our data set are a good representation of the genome in terms of rates of evolution, we compared divergence at nonsynonymous and synonymous sites (dN/dS) between rabbits and mice and between rabbits and humans. We considered only genes with 1–1 orthology relationships. We found that dN/dS estimates for genes in our data set were lower than the genome-wide average (Mann–Whitney U test, P < 0.001 in both comparisons; supplementary fig. 2, Supplementary Material online). However, we also found that dN/dS values were progressively lower with increasing levels of gene expression but that α estimates remained largely unaltered; thus suggesting that the deviation in dN/dS values observed in our data set is unlikely to alter our conclusions.
Our results in rabbits reveal a high proportion of adaptive fixations. In mammals, estimates of α are available for mice and humans. While there is evidence for limited adaptive divergence in humans (α < 15% in most studies, Bustamante et al. 2005; Gojobori et al. 2007; Boyko et al. 2008; Halligan et al. 2010), estimates in mice are substantially higher (α = 57%; Halligan et al. 2010) and similar to estimates in rabbits, consistent with much larger Ne in both mice (Ne = 580,000) and rabbits (Ne = 1,000,000) when compared with humans (Ne = 10,000). The prevalence of adaptive divergence in a number of other systems also fits well with variation in Ne. There is limited evidence for adaptive divergence in selfing and outcrossing Arabidopsis (Bustamante et al. 2002; Foxe et al. 2008; Slotte et al. 2010) and chickens (Axelsson and Ellegren 2009), but pervasive adaptive divergence has been detected in systems with much higher Ne, including bacteria (Charlesworth and Eyre-Walker 2006; Lefebure and Stanhope 2009), Drosophila (Fay et al. 2002; Bachtrog 2008; Eyre-Walker and Keightley 2009), and several species of plants (Strasburg et al. 2009; Slotte et al. 2010). Most recently, Strasburg et al. (2011) estimated α in six sunflower species that vary widely in Ne and found that Ne appears to be an important predictor of rates of adaptive divergence. Although the prevalence of adaptive divergence among taxa may be influenced by several factors other than Ne, such as population structure, nonequilibrium demographic histories, or the choice of out-group (Bachtrog 2008; Gossmann et al. 2010; Halligan et al. 2010; Strasburg et al. 2011), our results suggest a strong genome-wide impact of positive selection in rabbits, which fits well with the theoretical expectations and empirical data that implicate Ne as a strong determinant of rates of adaptation.
Selection at linked sites can lower genetic diversity in genomic regions that experience recurrent adaptive protein evolution (Maynard Smith and Haigh 1974; Wiehe and Stephan 1993) and such a pattern has been observed in Drosophila (Andolfatto 2007; Macpherson et al. 2007; Jensen and Bachtrog 2010). A weaker relationship of diversity with functional divergence has also been detected in humans (Cai et al. 2009). Accordingly, we observed lower synonymous site polymorphism (after correcting for variation in mutation rates) with increasing rates of protein evolution (fig. 3); however, the magnitude of this effect was weak and nonsignificant. Several nonmutually exclusive explanations may account for this weak pattern. One potential cause reducing the magnitude of the correlation could be related with the reduced number of sites analyzed for most genes in this study. Although we restricted the analysis to genes having more than 300 synonymous sites (see Results), this correction may be insufficient. Alternatively, at least two biological explanations might underlie the observed weak signature and both imply that adaptation may not predominantly occur under classic selective sweep models. First, the strength of selection on the majority of adaptive substitutions may be weak, resulting in a slower rate of fixation. Under this scenario, the window of reduced variability surrounding these substitutions may be too subtle to detect because it will likely be much smaller than the average genomic span of the genes analyzed here. Second, most instances of adaptive substitutions may derive from standing genetic variation. These “soft sweeps” are also expected to have a weaker impact on levels of diversity at linked sites (Przeworski et al. 2005). In fact, empirical data in several systems suggest that modes of selection based on preexisting variation or polygenic selection may be more predominant than previously thought (Barrett and Schluter 2008; Coop et al. 2009; Hancock et al. 2010; Pritchard et al. 2010; Hernandez et al. 2011).
Efficient Purifying Selection in Rabbits
Evolutionary theory predicts that differences in Ne should not only explain the fraction of positively selected sites but also the proportion that behave as effectively neutral (Ohta 1973). The DFE of newly arising amino acid mutations inferred here for rabbits (table 2), suggests that a very small fraction of amino acid mutations (less than 4%) are effectively neutral (defined as 0 < Nes < 1). Conversely, we inferred that the vast majority of mutations (93% or more) are strongly selected against (defined as Nes > 10) and rarely will be able to reach fixation. We also inferred that the fraction of effectively neutral mutations slightly decreases with increasing gene expression levels, although this fraction remains small even for lowly expressed genes.
We noted before that our data set showed dN/dS estimates that are lower than the genome-wide average when compared with humans or mice, raising the question of whether the set of genes analyzed here may be subjected, on average, to stronger evolutionary constraint. This bias could potentially affect our inference regarding the properties of DFE of new amino acid mutations. We investigated this possibility by selecting a subset of genes chosen to match the genome-wide average dN/dS values to humans (see Haddrill et al. 2010 for a similar approach). Such a subset is likely to be more representative of genome-wide evolutionary forces and, in our data set, this corresponded to approximately 55% of the genes with the highest dN/dS values (data not shown). We found that the estimated proportions for this subset remained qualitatively similar to those summarized in table 2 for the whole data set (supplementary table 9, Supplementary Material online). The main effect in most comparisons was to slightly increase the proportion of effectively neutral mutations (0 < Nes < 1 = 5%) and slightly decrease the proportion of strongly selected mutations (Nes > 10 = 90%). We further note that very lowly expressed genes are not represented in our data set, which may contribute to slightly underestimate the genome-wide proportion of effectively neutral mutations. Nevertheless, our results taken together indicate that the inferred properties of the DFE (i.e., a small proportion of effectively neutral mutations) appear to be a general characteristic of the rabbit genome and are not specific to particular subsets of genes of stronger constraint.
Using the same methodology undertaken in our study (Keightley and Eyre-Walker 2007), similar properties of the DFE have been found in other species with high Ne. In Drosophila, 5–7% of amino acid-changing mutations behave as effectively neutral and the fraction of strongly deleterious alleles (Nes > 10) among newly arising mutations is approximately 90% (Keightley and Eyre-Walker 2007; Andolfatto et al. 2011), whereas in mice, approximately 10% of mutations are effectively neutral and approximately 80% are strongly deleterious (Halligan et al. 2010). Comparable results have been described for plant species with high Ne (Slotte et al. 2010; Strasburg et al. 2011). In humans and Arabidopsis (Halligan et al. 2010; Slotte et al. 2010), species with smaller Ne, the DFE is characterized by a significantly lower fraction of deleterious mutations (Nes > 10 = 65%), and conversely, nearly neutral mutations are significantly more frequent (0 < Nes < 1 = 20%). Overall, we find evidence for genome-wide efficient purifying selection at amino acid sites in both rabbit subspecies, also consistent with Ne-based expectations.
Efficacy of Selection on the Autosomes and X Chromosome
We were also interested in investigating the relative efficacy of both purifying and positive selection between the X chromosome and the autosomes in rabbits. The X chromosome and the autosomes differ in several important characteristics that can influence patterns of evolutionary change. Two of the most important differences are the effective population size of the X chromosome—3/4 of an autosome—and the hemizygous state of the X chromosome in males. Whereas the rate of genetic drift is expected to be higher on the X chromosome, thus reducing the efficacy of selection, the fact that males possess a single copy of the X chromosome leads to exposure of recessive mutations, which can result in an overall increase in the efficacy of natural selection relative to the autosomes (Charlesworth et al. 1987; Betancourt et al. 2004; Vicoso and Charlesworth 2009; Mank et al. 2010).
Our data, however, yielded equivocal results (table 2 and fig. 2). In O. c. algirus, we detected a significant elevation in α and a significantly lower proportion of effectively neutral mutations on the X chromosome (αEWK09 = 95%, CI 74–100%; 0 < Nes < 1 = 0.3%, CI 0.0–1.8%) when compared with the autosomes (αEWK09 = 64%, CI 57–68%; 0 < Nes < 1 = 3.0%, CI 2.6–3.5%; P < 0.05 in both comparisons), which is consistent with both positive and negative selection acting more efficiently at X-linked loci in this subspecies. In contrast, there does not appear to be a signal of increased efficacy of natural selection on the X chromosome in O. c. cuniculus. Point estimates of α for the O. c. cuniculus X chromosome were lower than that for the autosomes (X chromosome αEWK09 = 52%, CI −5% to 92%; autosomes αEWK09 = 62%, CI 53–68%), and the proportion of effectively neutral mutations was slightly higher (X chromosome 0 < Nes < 1 = 3.7%, CI 0.7–6.6%; autosomes 0 < Nes < 1 = 3.1%, CI 2.7–3.7%). Both comparisons were not significantly different (P > 0.10). However, statistical power in this subspecies limits our inference and this is well illustrated by the large CIs on most estimates inferred for the O. c. cuniculus X chromosome. Finally, it should be noted that the ratio of X-linked to autosomal diversity corrected for mutational differences was found to be lower than the expected 3/4 in both subspecies (see Results), which may be interpreted as support for hitchhiking effects depleting neutral variation on the X. While our data fail to support a systematic difference between the X chromosome and the autosomes in rates of adaptation or selective constraint, the point estimates of α and the proportion of effectively neutral mutations in O. c. algirus, with nonoverlapping CIs (fig. 2; table 2), are at least suggestive of some differences. More sequencing data on the X chromosome will be necessary to draw more definite conclusions.
Supplementary Material
Supplementary figures S1 and S2 and tables S1–S9 are available at Molecular Biology and Evolution online (http://www.mbe.oxfordjournals.org/).
Acknowledgments
This work was supported by the Max Planck Society as well as Fundação para a Ciência e a Tecnologia postDoc grants to M.C. (SFRH/BPD/72343/2010), J.M.-F. (SFRH/BPD/43264/2008), and J.A.B.-A. (SFRH/BPD/65464/2009), by a European Research Council Advanced Grant 232971 (PopPhyl) to N.C., by a research project to J.A.B.A. (PTDC/BIA-EVF/111368/2009), by National Science Foundation and National Institutes of Health grants to M.W.N., and by research projects to R.V. and N.F. (POCI/CVT/61590/2004; PTDC/BIA-BDE/72304/2006; PTDC/BIA-BDE/72277/2006; CGL2009-11665; POII09-0099-2557). We thank Ayinuer Aximu for assistance in preparing RNASeq libraries and CIBIO members for valuable discussions.
References
- Andolfatto P. Hitchhiking effects of recurrent beneficial amino acid substitutions in the Drosophila melanogaster genome. Genome Res. 2007;17:1755–1762. doi: 10.1101/gr.6691007. [DOI] [PMC free article] [PubMed] [Google Scholar]
- Andolfatto P, Wong KM, Bachtrog D. Effective population size and the efficacy of selection on the X chromosomes of two closely related Drosophila species. Genome Biol Evol. 2011;3:114–128. doi: 10.1093/gbe/evq086. [DOI] [PMC free article] [PubMed] [Google Scholar]
- Aquadro CF, Bauer DuMont V, Reed FA. Genome-wide variation in the human and fruitfly: a comparison. Curr Opin Genet Dev. 2001;11:627–634. doi: 10.1016/s0959-437x(00)00245-8. [DOI] [PubMed] [Google Scholar]
- Axelsson E, Ellegren H. Quantification of adaptive evolution of genes expressed in avian brain and the population size effect on the efficacy of selection. Mol Biol Evol. 2009;26:1073–1079. doi: 10.1093/molbev/msp019. [DOI] [PubMed] [Google Scholar]
- Bachtrog D. Similar rates of protein adaptation in Drosophila miranda and D. melanogaster, two species with different current effective population sizes. BMC Evol Biol. 2008;8:334. doi: 10.1186/1471-2148-8-334. [DOI] [PMC free article] [PubMed] [Google Scholar]
- Barrett RD, Schluter D. Adaptation from standing genetic variation. Trends Ecol Evol. 2008;23:38–44. doi: 10.1016/j.tree.2007.09.008. [DOI] [PubMed] [Google Scholar]
- Betancourt AJ, Kim Y, Orr HA. A pseudohitchhiking model of X vs. autosomal diversity. Genetics. 2004;168:2261–2269. doi: 10.1534/genetics.104.030999. [DOI] [PMC free article] [PubMed] [Google Scholar]
- Bierne N, Eyre-Walker A. The genomic rate of adaptive amino acid substitution in Drosophila. Mol Biol Evol. 2004;21:1350–1360. doi: 10.1093/molbev/msh134. [DOI] [PubMed] [Google Scholar]
- Boyko AR, Williamson SH, Indap AR, et al. (14 co-authors) Assessing the evolutionary impact of amino acid mutations in the human genome. PLoS Genet. 2008;4:e1000083. doi: 10.1371/journal.pgen.1000083. [DOI] [PMC free article] [PubMed] [Google Scholar]
- Branco M, Ferrand N, Monnerot M. Phylogeography of the European rabbit (Oryctolagus cuniculus) in the Iberian Peninsula inferred from RFLP analysis of the cytochrome b gene. Heredity. 2000;85 doi: 10.1046/j.1365-2540.2000.00756.x. (Pt 4):307–317. [DOI] [PubMed] [Google Scholar]
- Branco M, Monnerot M, Ferrand N, Templeton AR. Postglacial dispersal of the European rabbit (Oryctolagus cuniculus) on the Iberian peninsula reconstructed from nested clade and mismatch analyses of mitochondrial DNA genetic variation. Evolution. 2002;56:792–803. doi: 10.1111/j.0014-3820.2002.tb01390.x. [DOI] [PubMed] [Google Scholar]
- Bustamante CD, Fledel-Alon A, Williamson S, et al. (14 co-authors) Natural selection on protein-coding genes in the human genome. Nature. 2005;437:1153–1157. doi: 10.1038/nature04240. [DOI] [PubMed] [Google Scholar]
- Bustamante CD, Nielsen R, Sawyer SA, Olsen KM, Purugganan MD, Hartl DL. The cost of inbreeding in Arabidopsis. Nature. 2002;416:531–534. doi: 10.1038/416531a. [DOI] [PubMed] [Google Scholar]
- Cai JJ, Macpherson JM, Sella G, Petrov DA. Pervasive hitchhiking at coding and regulatory sites in humans. PLoS Genet. 2009;5:e1000336. doi: 10.1371/journal.pgen.1000336. [DOI] [PMC free article] [PubMed] [Google Scholar]
- Carneiro M, Blanco-Aguiar JA, Villafuerte R, Ferrand N, Nachman MW. Speciation in the European Rabbit (Oryctolagus Cuniculus): Islands of differentiation on the X chromosome and autosomes. Evolution. 2010;64:3443–3460. doi: 10.1111/j.1558-5646.2010.01092.x. [DOI] [PMC free article] [PubMed] [Google Scholar]
- Carneiro M, Ferrand N, Nachman MW. Recombination and speciation: loci near centromeres are more differentiated than loci near telomeres between subspecies of the European Rabbit (Oryctolagus cuniculus) Genetics. 2009;181:593–606. doi: 10.1534/genetics.108.096826. [DOI] [PMC free article] [PubMed] [Google Scholar]
- Charlesworth B, Coyne JA, Barton NH. The relative rates of evolution of sex-chromosomes and autosomes. Am Nat. 1987;130:113–146. [Google Scholar]
- Charlesworth J, Eyre-Walker A. The rate of adaptive evolution in enteric bacteria. Mol Biol Evol. 2006;23:1348–1356. doi: 10.1093/molbev/msk025. [DOI] [PubMed] [Google Scholar]
- Charlesworth J, Eyre-Walker A. The McDonald-Kreitman test and slightly deleterious mutations. Mol Biol Evol. 2008;25:1007–1015. doi: 10.1093/molbev/msn005. [DOI] [PubMed] [Google Scholar]
- Coop G, Pickrell JK, Novembre J, Kudaravalli S, Li J, Absher D, Myers RM, Cavalli-Sforza LL, Feldman MW, Pritchard JK. The role of geography in human adaptation. PLoS Genet. 2009;5:e1000500. doi: 10.1371/journal.pgen.1000500. [DOI] [PMC free article] [PubMed] [Google Scholar]
- Drummond DA, Bloom JD, Adami C, Wilke CO, Arnold FH. Why highly expressed proteins evolve slowly. Proc Natl Acad Sci U S A. 2005;102:14338–14343. doi: 10.1073/pnas.0504070102. [DOI] [PMC free article] [PubMed] [Google Scholar]
- Durinck S, Moreau Y, Kasprzyk A, Davis S, De Moor B, Brazma A, Huber W. BioMart and Bioconductor: a powerful link between biological databases and microarray data analysis. Bioinformatics. 2005;21:3439–3440. doi: 10.1093/bioinformatics/bti525. [DOI] [PubMed] [Google Scholar]
- Edgar RC. MUSCLE: a multiple sequence alignment method with reduced time and space complexity. BMC Bioinformatics. 2004;5:113. doi: 10.1186/1471-2105-5-113. [DOI] [PMC free article] [PubMed] [Google Scholar]
- Ellegren H. A selection model of molecular evolution incorporating the effective population size. Evolution. 2009;63:301–305. doi: 10.1111/j.1558-5646.2008.00560.x. [DOI] [PubMed] [Google Scholar]
- Eyre-Walker A. The genomic rate of adaptive evolution. Trends Ecol Evol. 2006;21:569–575. doi: 10.1016/j.tree.2006.06.015. [DOI] [PubMed] [Google Scholar]
- Eyre-Walker A, Keightley PD. Estimating the rate of adaptive molecular evolution in the presence of slightly deleterious mutations and population size change. Mol Biol Evol. 2009;26:2097–2108. doi: 10.1093/molbev/msp119. [DOI] [PubMed] [Google Scholar]
- Eyre-Walker A, Keightley PD, Smith NG, Gaffney D. Quantifying the slightly deleterious mutation model of molecular evolution. Mol Biol Evol. 2002;19:2142–2149. doi: 10.1093/oxfordjournals.molbev.a004039. [DOI] [PubMed] [Google Scholar]
- Fay JC, Wyckoff GJ, Wu CI. Positive and negative selection on the human genome. Genetics. 2001;158:1227–1234. doi: 10.1093/genetics/158.3.1227. [DOI] [PMC free article] [PubMed] [Google Scholar]
- Fay JC, Wyckoff GJ, Wu CI. Testing the neutral theory of molecular evolution with genomic data from Drosophila. Nature. 2002;415:1024–1026. doi: 10.1038/4151024a. [DOI] [PubMed] [Google Scholar]
- Foxe JP, Dar VU, Zheng H, Nordborg M, Gaut BS, Wright SI. Selection on amino acid substitutions in Arabidopsis. Mol Biol Evol. 2008;25:1375–1383. doi: 10.1093/molbev/msn079. [DOI] [PMC free article] [PubMed] [Google Scholar]
- Geraldes A, Basset P, Gibson B, Smith KL, Harr B, Yu HT, Bulatova N, Ziv Y, Nachman MW. Inferring the history of speciation in house mice from autosomal, X-linked, Y-linked and mitochondrial genes. Mol Ecol. 2008;17:5349–5363. doi: 10.1111/j.1365-294X.2008.04005.x. [DOI] [PMC free article] [PubMed] [Google Scholar]
- Geraldes A, Carneiro M, Delibes-Mateos M, Villafuerte R, Nachman MW, Ferrand N. Reduced introgression of the Y chromosome between subspecies of the European rabbit (Oryctolagus cuniculus) in the Iberian Peninsula. Mol Ecol. 2008;17:4489–4499. doi: 10.1111/j.1365-294X.2008.03943.x. [DOI] [PubMed] [Google Scholar]
- Gojobori J, Tang H, Akey JM, Wu CI. Adaptive evolution in humans revealed by the negative correlation between the polymorphism and fixation phases of evolution. Proc Natl Acad Sci U S A. 2007;104:3907–3912. doi: 10.1073/pnas.0605565104. [DOI] [PMC free article] [PubMed] [Google Scholar]
- Gossmann TI, Song BH, Windsor AJ, Mitchell-Olds T, Dixon CJ, Kapralov MV, Filatov DA, Eyre-Walker A. Genome wide analyses reveal little evidence for adaptive evolution in many plant species. Mol Biol Evol. 2010;27:1822–1832. doi: 10.1093/molbev/msq079. [DOI] [PMC free article] [PubMed] [Google Scholar]
- Haddrill PR, Bachtrog D, Andolfatto P. Positive and negative selection on noncoding DNA in Drosophila simulans. Mol Biol Evol. 2008;25:1825–1834. doi: 10.1093/molbev/msn125. [DOI] [PMC free article] [PubMed] [Google Scholar]
- Haddrill PR, Loewe L, Charlesworth B. Estimating the parameters of selection on nonsynonymous mutations in Drosophila pseudoobscura and D. miranda. Genetics. 2010;185:1381–1396. doi: 10.1534/genetics.110.117614. [DOI] [PMC free article] [PubMed] [Google Scholar]
- Halligan DL, Oliver F, Eyre-Walker A, Harr B, Keightley PD. Evidence for pervasive adaptive protein evolution in wild mice. PLoS Genet. 2010;6(1):e1000825. doi: 10.1371/journal.pgen.1000825. [DOI] [PMC free article] [PubMed] [Google Scholar]
- Hancock AM, Witonsky DB, Ehler E, et al. (11 co-authors) Colloquium paper: human adaptations to diet, subsistence, and ecoregion are due to subtle shifts in allele frequency. Proc Natl Acad Sci U S A. 2010;107(Suppl 2):8924–8930. doi: 10.1073/pnas.0914625107. [DOI] [PMC free article] [PubMed] [Google Scholar]
- Hernandez RD, Kelley JL, Elyashiv E, Melton SC, Auton A, McVean G, Sella G, Przeworski M. Classic selective sweeps were rare in recent human evolution. Science. 2011;331:920–924. doi: 10.1126/science.1198878. [DOI] [PMC free article] [PubMed] [Google Scholar]
- Hey J, Nielsen R. Multilocus methods for estimating population sizes, migration rates and divergence time, with applications to the divergence of Drosophila pseudoobscura and D. persimilis. Genetics. 2004;167:747–760. doi: 10.1534/genetics.103.024182. [DOI] [PMC free article] [PubMed] [Google Scholar]
- Hey J, Nielsen R. Integration within the Felsenstein equation for improved Markov chain Monte Carlo methods in population genetics. Proc Natl Acad Sci U S A. 2007;104:2785–2790. doi: 10.1073/pnas.0611164104. [DOI] [PMC free article] [PubMed] [Google Scholar]
- Jensen JD, Bachtrog D. Characterizing recurrent positive selection at fast-evolving genes in Drosophila miranda and Drosophila pseudoobscura. Genome Biol Evol. 2010;2:371–378. doi: 10.1093/gbe/evq028. [DOI] [PMC free article] [PubMed] [Google Scholar]
- Keightley PD, Eyre-Walker A. Deleterious mutations and the evolution of sex. Science. 2000;290:331–333. doi: 10.1126/science.290.5490.331. [DOI] [PubMed] [Google Scholar]
- Keightley PD, Eyre-Walker A. Joint inference of the distribution of fitness effects of deleterious mutations and population demography based on nucleotide polymorphism frequencies. Genetics. 2007;177:2251–2261. doi: 10.1534/genetics.107.080663. [DOI] [PMC free article] [PubMed] [Google Scholar]
- Kimura M. Evolutionary rate at the molecular level. Nature. 1968;217:624–626. doi: 10.1038/217624a0. [DOI] [PubMed] [Google Scholar]
- Kimura M. The neutral theory of molecular evolution. Cambridge: Cambridge University Press; 1983. [Google Scholar]
- Kircher M, Stenzel U, Kelso J. Improved base calling for the Illumina Genome Analyzer using machine learning strategies. Genome Biol. 2009;10:R83. doi: 10.1186/gb-2009-10-8-r83. [DOI] [PMC free article] [PubMed] [Google Scholar]
- Kosiol C, Vinar T, da Fonseca RR, Hubisz MJ, Bustamante CD, Nielsen R, Siepel A. Patterns of positive selection in six Mammalian genomes. PLoS Genet. 2008;4:e1000144. doi: 10.1371/journal.pgen.1000144. [DOI] [PMC free article] [PubMed] [Google Scholar]
- Lefebure T, Stanhope MJ. Pervasive, genome-wide positive selection leading to functional divergence in the bacterial genus Campylobacter. Genome Res. 2009;19:1224–1232. doi: 10.1101/gr.089250.108. [DOI] [PMC free article] [PubMed] [Google Scholar]
- Lemos B, Bettencourt BR, Meiklejohn CD, Hartl DL. Evolution of proteins and gene expression levels are coupled in Drosophila and are independently associated with mRNA abundance, protein length, and number of protein-protein interactions. Mol Biol Evol. 2005;22:1345–1354. doi: 10.1093/molbev/msi122. [DOI] [PubMed] [Google Scholar]
- Li H, Durbin R. Fast and accurate short read alignment with Burrows-Wheeler transform. Bioinformatics. 2009;25:1754–1760. doi: 10.1093/bioinformatics/btp324. [DOI] [PMC free article] [PubMed] [Google Scholar]
- Li H, Handsaker B, Wysoker A, Fennell T, Ruan J, Homer N, Marth G, Abecasis G, Durbin R. The Sequence Alignment/Map format and SAMtools. Bioinformatics. 2009;25:2078–2079. doi: 10.1093/bioinformatics/btp352. [DOI] [PMC free article] [PubMed] [Google Scholar]
- Lindblad-Toh K, Wade CM, Mikkelsen TS, et al. (236 co-authors) Genome sequence, comparative analysis and haplotype structure of the domestic dog. Nature. 2005;438:803–819. doi: 10.1038/nature04338. [DOI] [PubMed] [Google Scholar]
- Macpherson JM, Sella G, Davis JC, Petrov DA. Genomewide spatial correspondence between nonsynonymous divergence and neutral polymorphism reveals extensive adaptation in Drosophila. Genetics. 2007;177:2083–2099. doi: 10.1534/genetics.107.080226. [DOI] [PMC free article] [PubMed] [Google Scholar]
- Mank JE, Vicoso B, Berlin S, Charlesworth B. Effective population size and the Faster-X effect: empirical results and their interpretation. Evolution. 2010;64:663–674. doi: 10.1111/j.1558-5646.2009.00853.x. [DOI] [PubMed] [Google Scholar]
- Matthee CA, van Vuuren BJ, Bell D, Robinson TJ. A molecular supermatrix of the rabbits and hares (Leporidae) allows for the identification of five intercontinental exchanges during the Miocene. Syst Biol. 2004;53:433–447. doi: 10.1080/10635150490445715. [DOI] [PubMed] [Google Scholar]
- Maynard Smith J, Haigh J. The hitch-hiking effect of a favourable gene. Genet Res. 1974;23:23–35. [PubMed] [Google Scholar]
- McDonald JH, Kreitman M. Adaptive Protein Evolution at the Adh Locus in Drosophila. Nature. 1991;351:652–654. doi: 10.1038/351652a0. [DOI] [PubMed] [Google Scholar]
- Meiklejohn CD, Montooth KL, Rand DM. Positive and negative selection on the mitochondrial genome. Trends Genet. 2007;23:259–263. doi: 10.1016/j.tig.2007.03.008. [DOI] [PubMed] [Google Scholar]
- Mortazavi A, Williams BA, McCue K, Schaeffer L, Wold B. Mapping and quantifying mammalian transcriptomes by RNA-Seq. Nat. Methods. 2008;5:621–628. doi: 10.1038/nmeth.1226. [DOI] [PubMed] [Google Scholar]
- Nei M. Molecular evolutionary genetics. New York: Columbia University Press; 1987. [Google Scholar]
- Nei M. Selectionism and neutralism in molecular evolution. Mol Biol Evol. 2005;22:2318–2342. doi: 10.1093/molbev/msi242. [DOI] [PMC free article] [PubMed] [Google Scholar]
- Nei M, Gojobori T. Simple Methods for Estimating the Numbers of Synonymous and Nonsynonymous Nucleotide Substitutions. Mol Biol Evol. 1986;3:418–426. doi: 10.1093/oxfordjournals.molbev.a040410. [DOI] [PubMed] [Google Scholar]
- Ohta T. Slightly deleterious mutant substitutions in evolution. Nature. 1973;246:96–98. doi: 10.1038/246096a0. [DOI] [PubMed] [Google Scholar]
- Ohta T. The nearly neutral theory of molecular evolution. Annu Rev Ecol Syst. 1992;23:263–286. [Google Scholar]
- Pal C, Papp B, Hurst LD. Highly expressed genes in yeast evolve slowly. Genetics. 2001;158:927–931. doi: 10.1093/genetics/158.2.927. [DOI] [PMC free article] [PubMed] [Google Scholar]
- Popadin K, Polishchuk LV, Mamirova L, Knorre D, Gunbin K. Accumulation of slightly deleterious mutations in mitochondrial protein-coding genes of large versus small mammals. Proc Natl Acad Sci U S A. 2007;104:13390–13395. doi: 10.1073/pnas.0701256104. [DOI] [PMC free article] [PubMed] [Google Scholar]
- Pritchard JK, Pickrell JK, Coop G. The genetics of human adaptation: hard sweeps, soft sweeps, and polygenic adaptation. Curr Biol. 2010;20:R208–215. doi: 10.1016/j.cub.2009.11.055. [DOI] [PMC free article] [PubMed] [Google Scholar]
- Prufer K, Muetzel B, Do HH, Weiss G, Khaitovich P, Rahm E, Paabo S, Lachmann M, Enard W. FUNC: a package for detecting significant associations between gene sets and ontological annotations. BMC Bioinformatics. 2007;8:41. doi: 10.1186/1471-2105-8-41. [DOI] [PMC free article] [PubMed] [Google Scholar]
- Przeworski M, Coop G, Wall JD. The signature of positive selection on standing genetic variation. Evolution. 2005;59:2312–2323. [PubMed] [Google Scholar]
- Rand DM, Kann LM. Excess amino acid polymorphism in mitochondrial DNA: Contrasts among genes from Drosophila, mice, and humans. Mol Biol Evol. 1996;13:735–748. doi: 10.1093/oxfordjournals.molbev.a025634. [DOI] [PubMed] [Google Scholar]
- Sawyer SA, Kulathinal RJ, Bustamante CD, Hartl DL. Bayesian analysis suggests that most amino acid replacements in Drosophila are driven by positive selection. J Mol Evol. 2003;57(Suppl 1):S154–164. doi: 10.1007/s00239-003-0022-3. [DOI] [PubMed] [Google Scholar]
- Sella G, Petrov DA, Przeworski M, Andolfatto P. Pervasive natural selection in the Drosophila genome? PLoS Genet. 2009;5:e1000495. doi: 10.1371/journal.pgen.1000495. [DOI] [PMC free article] [PubMed] [Google Scholar]
- Slotte T, Foxe JP, Hazzouri KM, Wright SI. Genome-wide evidence for efficient positive and purifying selection in Capsella grandiflora, a plant species with a large effective population size. Mol Biol Evol. 2010;27:1813–1821. doi: 10.1093/molbev/msq062. [DOI] [PubMed] [Google Scholar]
- Smith NG, Eyre-Walker A. Adaptive protein evolution in Drosophila. Nature. 2002;415:1022–1024. doi: 10.1038/4151022a. [DOI] [PubMed] [Google Scholar]
- Soriguer RC. El conejo: papel ecológico y estrategia de vida en los ecosistemas mediterráneos. Proceedings of the XV Congreso Internacional de Fauna Cinegética y Silvestre. Trujillo, Spain: 1983. pp. 517–542. [Google Scholar]
- Strasburg JL, Kane NC, Raduski AR, Bonin A, Michelmore R, Rieseberg LH. Effective population size is positively correlated with levels of adaptive divergence among annual sunflowers. Mol Biol Evol. 2011;28:1569–1580. doi: 10.1093/molbev/msq270. [DOI] [PMC free article] [PubMed] [Google Scholar]
- Strasburg JL, Scotti-Saintagne C, Scotti I, Lai Z, Rieseberg LH. Genomic patterns of adaptive divergence between chromosomally differentiated sunflower species. Mol Biol Evol. 2009;26:1341–1355. doi: 10.1093/molbev/msp043. [DOI] [PMC free article] [PubMed] [Google Scholar]
- Subramanian S, Kumar S. Gene expression intensity shapes evolutionary rates of the proteins encoded by the vertebrate genome. Genetics. 2004;168:373–381. doi: 10.1534/genetics.104.028944. [DOI] [PMC free article] [PubMed] [Google Scholar]
- Tajima F. Statistical method for testing the neutral mutation hypothesis by DNA polymorphism. Genetics. 1989;123:585–595. doi: 10.1093/genetics/123.3.585. [DOI] [PMC free article] [PubMed] [Google Scholar]
- Takahata N. Allelic genealogy and human evolution. Mol Biol Evol. 1993;10:2–22. doi: 10.1093/oxfordjournals.molbev.a039995. [DOI] [PubMed] [Google Scholar]
- Trapnell C, Pachter L, Salzberg SL. TopHat: discovering splice junctions with RNA-Seq. Bioinformatics. 2009;25:1105–1111. doi: 10.1093/bioinformatics/btp120. [DOI] [PMC free article] [PubMed] [Google Scholar]
- Trapnell C, Williams BA, Pertea G, Mortazavi A, Kwan G, van Baren MJ, Salzberg SL, Wold BJ, Pachter L. Transcript assembly and quantification by RNA-Seq reveals unannotated transcripts and isoform switching during cell differentiation. Nat Biotechnol. 2010;28:511–515. doi: 10.1038/nbt.1621. [DOI] [PMC free article] [PubMed] [Google Scholar]
- Vicoso B, Charlesworth B. Effective population size and the faster-X effect: an extended model. Evolution. 2009;63:2413–2426. doi: 10.1111/j.1558-5646.2009.00719.x. [DOI] [PubMed] [Google Scholar]
- Watterson GA. On the number of segregating sites in genetical models without recombination. Theor Popul Biol. 1975;7:256–276. doi: 10.1016/0040-5809(75)90020-9. [DOI] [PubMed] [Google Scholar]
- Wiehe TH, Stephan W. Analysis of a genetic hitchhiking model, and its application to DNA polymorphism data from Drosophila melanogaster. Mol Biol Evol. 1993;10:842–854. doi: 10.1093/oxfordjournals.molbev.a040046. [DOI] [PubMed] [Google Scholar]
Associated Data
This section collects any data citations, data availability statements, or supplementary materials included in this article.