

Abstract
Membrane fusion, essential to eukaryotic life, is broadly envisioned as a three-step process proceeding from contacting bilayers through two semistable, nonlamellar lipidic intermediate states to a fusion pore. Here, we introduced a new, to our knowledge, experimental approach to gain insight into the nature of the transition states between initial, intermediate, and final states. Recorded time courses of lipid-mixing, content-mixing, and content-leakage associated with fusion of 23 nm vesicles in the presence of poly(ethylene glycol) at multiple temperatures were fitted globally to a three-step sequential model to yield rate constants and thereby activation thermodynamics for each step of the process, as well as probabilities of occurrence of lipid-mixing, content-mixing, or content-leakage in each state. Experiments with membranes containing hexadecane, known to reduce interstice energy in nonlamellar structures, provided additional insight into the nature of fusion intermediates and transition states. The results support a hypothesis for the mechanism of stalk formation (step-1) that involves acyl chain protrusions into the interbilayer contact region, a hypothesis for a step-2 mechanism involving continuous interconversion of semistable nonlamellar intermediates, and a hypothesis for step-3 (pore formation) mechanism involving correlated movement of whole lipid molecules into hydrophobic spaces created by geometry mismatch between intermediate structures.
Introduction
Membrane fusion is vital in the life of eukaryotic cells. Cellular trafficking and compartmentalization, intercellular communication, sexual reproduction, endo- and exocytosis, and cell division are all dependent on this basic process. Nearly two decades of research has produced fairly wide agreement that fusion process proceeds in both model-membrane vesicles and protein-laden biological membranes through rearrangement of lipids (1,2). Examination of mechanical properties and phase behavior of water-lipid mesomorphic states have produced a picture of the general nature of these lipid rearrangements, namely the stalk hypothesis (3). In this, the outer leaflets of each bilayer merge to form the semistable stalk intermediate (4), regarded as a highly distorted lipid arrangement more akin to nonlamellar than lamellar lipid phases. The stalk transforms via a trans-membrane contact (TMC) to a second semistable intermediate (extended trans-membrane contact or ETMC) followed by the opening of a fusion pore (5,6). However, we currently have a poor molecular understanding of the two key steps in the process: initial intermediate formation and final pore formation. This is because these steps of necessity involve transient unfavorable fluctuations in lipid/water arrangements that are difficult to assess experimentally and at least for now, impossible to characterize structurally. In mechanistic terms, such unstable transient molecular arrangements are viewed as activation intermediates that provide activation free energy barriers for a reaction. It is critical to understand these activation barriers if we are to understand how fusion proteins reduce these free energy barriers to catalyze the fusion process in vivo (7).
Although there is little hope of determining the structure of such transient activation intermediates, we can gain insights into the nature of these transition states (TS) by using TS rate theory to estimate the thermodynamics of the TS relative to the stable or semistable states from which they are formed. In this study, we i), recorded the time courses of poly(ethylene glycol) (PEG)-mediated lipid-mixing (LM), content-mixing (CM), and content-leakage (L) of 23 nm small unilamellar vesicles (SUVs) composed of 1,2-dioleoyl-3-sn-phosphatidylcholine (DOPC)/1,2-dioleoyl-3-sn-phosphatidylethanolamine (DOPE)/sphingomyelin (SM)/cholesterol (CH) (35:30:15:20) at five different temperatures; ii), analyzed these data according to a three-step sequential kinetic model described previously (8); iii), determined for the first time, to our knowledge, the activation thermodynamics for each step of the fusion process; and iv), used this information to examine the nature of the TS between stable or semistable states of the fusion process.
Inclusion of small amounts of long-chain hydrocarbons in phosphatidylethanolamine/water mixtures favors formation of an inverted hexagonal mesomorphic phase in which the hydrocarbons occupy interstice space between quasicrystalline lipid structures (9,10). We showed previously that inclusion of hexadecane in vesicles promoted fusion and hypothesized that reduction of interstice energy may be a way in which fusion peptides or trans-membrane domains (TMDs) of fusion proteins might catalyze fusion (11,12). For this reason, we performed experiments with vesicles formed in the presence of 3 mol% hexadecane to examine whether the observed influence of hexadecane is consistent with the view that hexadecane promotes fusion by reducing interstice energy.
Finally, we interpret the new, to our knowledge, information from the methods introduced here in terms of possible structural models for mechanisms of the enigmatic first and last steps: stalk and pore formation. Our results provide unique experimental insights into the nature of the fusion process and support a molecular picture of stalk formation suggested by recent molecular dynamics (MD) simulations as well as a reasonable picture of fusion pore formation that is also supported by MD simulations.
Experimental Procedures
Materials and methods that are routine to our laboratory are well described in the literature, therefore only brief reference to details are given in the Supporting Material. CM and L measurements involve trapping a fluorophore (ANTS) and its quencher (DPX) in two populations of 23 nm vesicles (SUVs), with ANTS quenching indicative of mixing of trapped contents. To monitor leakage, both ANTS and DPX were trapped in the same vesicles, allowing for an increase in fluorescence when they escape. Lipid mixing (LM) between the fusing bilayers was followed using fluorescence resonance energy transfer between lipid molecules carrying fluorescent probes covalently attached to their acyl chains. Details of the time course measurement are in the Supporting Material.
Kinetic model
Our kinetic model is based on the modified stalk structural model for fusion intermediates (3,6), which proposes that individual fusion events proceed through two semistable nonlamellar structural intermediates to a final fusion pore (see Fig. S1 and Modified Stalk Model of Fusion Intermediate Structures in the Supporting Material). Our experiments, however, follow the behavior of ensembles of individual events: at 80 nM SUVs, ∼50 million vesicles are observed as they all proceed through these structural intermediates. Thus, the states in our model (8) are not structural states, but thermodynamic states consisting of ensembles of microstructures, each of which is roughly related to one of the structures associated with the modified stalk model. The formulation of this model required that events involving mixing of contents between compartments, leakage of content, and mixing of lipids between vesicles must occur with finite probabilities within these states (8). Many observations support this assertion. Reversible small pores occur early in PEG-mediate fusion before formation of large fusion pores (5). Similarly, flickering pores occur early along with lipid movement during osmotically induced fusion of supported bilayers but well before final pore formation (13). Capacitance/conductance measurements on patch-clamped secretory cells also demonstrate transitory or flickering content release (14) well before, and a foot of catecholamine release just before, full secretory release (15). Although opening times derived from these electrical measurements are on the order of a millisecond, mean dwell times between early transient events and final pores were much longer (many seconds) (16), consistent with our two-intermediate model and with rate constants reported here and elsewhere (1). More recent rapid single-vesicle measurements of lipid movement between SNARE-linked, protein-rich LUVs also clearly resolve up to two, and sometimes even three, intermediate states (17).
Thus, we modeled our data in terms of a sequential, four-state (three-step) mechanism (see Diagram in Supporting Material) (8). Although our observations (LM, CM, and L) are macroscopically irreversible in the presence of PEG (5) (thus, the sequential treatment), the observation of flickering pores suggests that structures comprising each ensemble are likely microscopically reversible. Indeed, the first step of PEG-mediated fusion is reversible if PEG is removed early in the process even though some small solutes pass between vesicles before PEG removal (5). In the accompanying diagram, nV is a separated-vesicle state, A represents vesicles in contact within aggregates, I1 and I2 are semistable intermediate states (presumably dominated by Stalk and ETMC microstructures, respectively), and FP is the final Fusion Pore state.
The rate constants for conversion between states are k1, k2, and k3. Each state in the ensemble kinetic model is characterized by probabilities of lipid- (βi-values) and CM (αi-values) and by a L rate (λi-values).
Calculation of transition state thermodynamics
If initial and TS for a process are in equilibrium, Eyring's transition state theory can yield information about the thermodynamics of the transition state relative to the initial state. We calculated the activation free energy of each step using the equations, , where ki-values are the rate constants of different steps and A is a preexponential factor that contains both the classical transmission factor (κ) and a fixed frequency (ν) at which transition state microstructures are assumed to decay to product (see Calculation of Transition State Thermodynamics for details).
Results
PEG-mediated fusion in the absence of hexadecane
Fig. 1, (A–C), shows time courses of LM, CM, and L at 5% (w/w) PEG for fusion of DOPC/DOPE/SM/CH SUVs at five temperatures (26, 30, 34, 38, 43°C). We also measured the LM, CM, and L in the SUVs containing 3 mol% hexadecane (DOPC/DOPE/SM/CH/hexadecane (HX)) at five temperatures (Fig. 1, (D–F) at 30°C). All five data sets (LM, CM, and L) were fitted globally to the four-state (three-step/two-intermediate) sequential model (8) to obtain the rate constants of each step, the rates of L from each state, and the probabilities of LM and CM in each state. Table S1 presents these parameters for fusion of DOPC/DOPE/SM/CH SUVs. The two-intermediate, four-state model provided a very good representation of the data at all temperatures (solid lines through the data). As might be expected, the extents of CM (fCM) increased with temperature, although the extent of LM (fLM) remained fixed (Table S1). For all temperatures, fLM was greater than fCM, meaning that not all initial intermediates result in pore formation. Even though SUVs have roughly 2/3 of their lipid in the outer leaflet, fLM was <0.67 at all temperatures, meaning that complete LM of outer leaflets was never achieved. Apparently, the extent of LM was limited by the degree of intervesicle contact in the aggregated state, but the probability that a successful contact would produce a pore was under thermal control. CM in the final step (FP formation) dominated total CM only at the lowest temperature. As temperature increased, the probabilities of content movement in the first and second intermediates increased dramatically (Table S1), such that only about a third of all CM occurred via the final fusion pore at 43°C. This does not imply that a final pore does not form between vesicles at high temperature. Instead, it points out that content and lipid movement between vesicles in a fusing pair are irreversible events that can be detected only once during the evolution of that pair, and that transient or flickering pores become more likely in the initial intermediate states with the availability of increased thermal energy. The fusion process was kinetically limited by final pore formation (k3 < k2 < k1), with formation of the initial intermediate (I1) occurring roughly an order of magnitude faster than formation of the final fusion pore, as previously noted (5). Thus, although the first step (I1 or stalk formation) is the one most discussed in the literature, it would appear that the steps characterized by k2 and k3 will be of considerable importance for understanding how fusion is catalyzed by fusion proteins in vivo.
Figure 1.
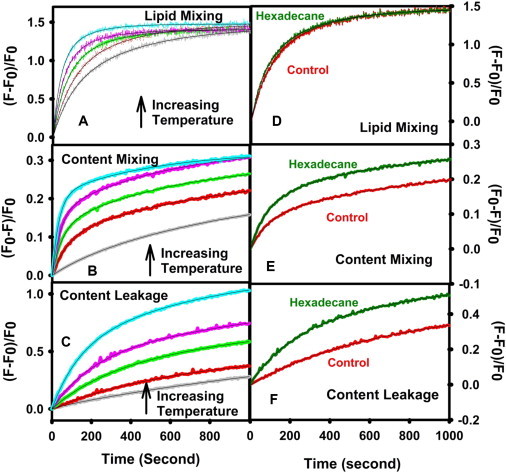
Time courses of LM (A), CM (B), and L (C) of DOPC/DOPE/SM/CH (35:30:15:20 mol %) SUVs (in absence of hexadecane) induced by 5% PEG at five different temperatures and LM (D), CM (E), and L (F) in the presence of 3 mol% hexadecane at 30°C. Control data at 30°C are also shown in D, E, and F for easy comparison. Measurements were carried out in 10 mM MES, 100 mM NaCl, 1mM CaCl2, 1 mM EDTA, pH 5.0 at a total lipid concentration was 0.2 mM. The average size of the SUVs is 23 nm. The smooth curves drawn through the data show the fit of the four-state sequential model to the data.
Transition state thermodynamics
The activation free energy refers to the difference in free energy between an initial state (A, I1, I2) and its transition state (TS1, TS2, TS3) for formation of I1, I2, or FP. Fig. 2 A shows the temperature dependence of for control (absence of hexadecane) SUVs as well as for SUVs in the presence of 3 mol% hexadecane (to be described later). was nonlinear in reciprocal temperature (i.e., the behavior was non-Arrhenius), and the activation enthalpy of each step thus varied with temperature. Figs. 2, B and C, show similar representations of the activation free energies for steps 2 and 3, respectively. These steps were also non-Arrhenius. It is evident by inspection that the simplest polynomial that could fit the data for step 1 (stalk formation) was a cubic. Although approximate descriptions of the temperature dependencies of free energies for steps 2 and 3 could be provided by a quadratic, this description was clearly inadequate, and cubic polynomials were employed to fit and temperature variations as well. The parameters and their uncertainties for these fits are summarized in Table S3. The temperature dependences of activation entropy (, solid lines) and enthalpy (, dotted lines) contributions were obtained from these fitted curves (see Methods) and are plotted in Figs. 3, A–C. For all three steps, a large positive is nearly always partially overcome by a positive (Fig. 3) to produce a much smaller positive (Fig. 2). This enthalpy-entropy compensation is common in the thermodynamics of order-disorder state changes in which a state consisting of a configurationally less diverse but enthalpically favored ensemble converts to a state defined by a larger ensemble of enthalpically unfavorable configurations at higher temperature. All and depend on temperature (Fig. 3), meaning that there is a heat capacity change (; slope of versus temperature) whose temperature dependence is shown in insets. The transition state thermodynamics of the three steps were clearly different and will be examined individually.
Figure 2.
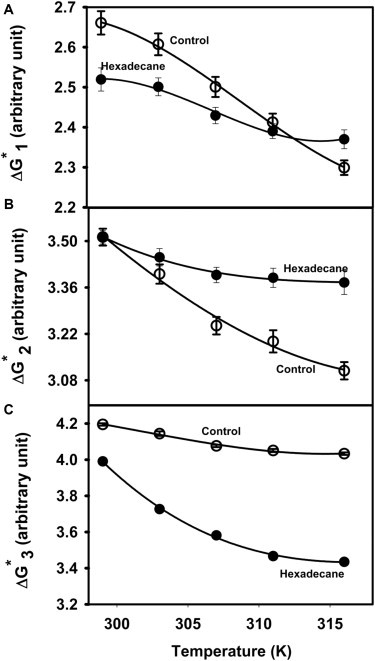
Temperature dependence of the free energy barrier for formation of (A) I1 state (), (B) I2 state (), and (C) pore formation () for control vesicles (open circles) and vesicles containing 3 mol% hexadecane (solid circle). Measurements were carried out in 10 mM MES, 100 mM NaCl, 1mM CaCl2, 1 mM EDTA, pH 5.0 at a total lipid concentration of 0.2 mM. Units of free energy are arbitrary and represent Kcal/mol if the unknown constant A = 1 sec−1. Curves through the data were obtained using the equation , with the parameters and their variances given in Table S3.
Figure 3.
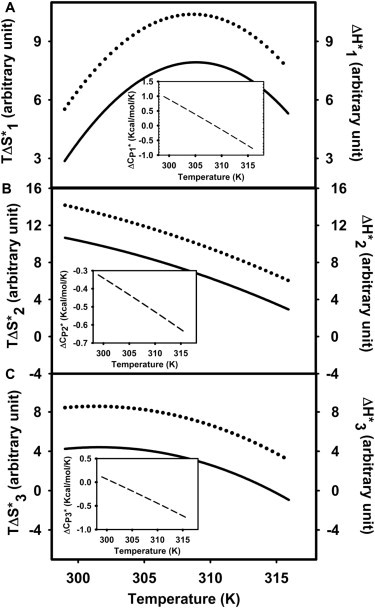
Temperature dependence of and (same arbitrary units as in Fig. 2) for fusion of control vesicles (fusion induced by the 5% (w/w) PEG). ; solid line) and ; dotted line) for the formation of (A) I1 state, (B) I2 state, and (C) pore for control vesicles. Insets show versus temperature for each step. does not depend on the unknown constant A, so units are not arbitrary. Parameters for these expressions as well as their variances are given in Table S3.
To give context to our description of transition state thermodynamics for each step of the fusion process, Fig. S1 shows a hypothetical reaction diagram for the process as envisioned by the Modified Stalk Structural Model of Fusion Intermediates that provides the basis for our ensemble kinetic model. The transition barriers shown (-values) are derived from the rates obtained in the current study. According to this model, the first intermediate (I1 or stalk) structure is topologically distinct from the initial microstructure of aggregated SUVs (A), meaning that the transition state from A to I1 (TS1) necessarily involves exposure of water to hydrocarbon and cannot be treated with a macroscopic model. As noted previously (18), the stalk (I1) structure has free energy comparable to (perhaps slightly lower than) that of the initial highly curved vesicles. The fusion-promoting effect of curvature was demonstrated long ago for model membranes (19) and is now also widely acknowledged by those examining fusion in vivo. Fig. S1 reveals that I1 and I2 structures share the same topology, and the transition between them has been treated in terms of known bulk materials properties of lipid mesomorphic phases in water (Bulk Materials Model) (18). The transition from I2 to final pore (FP) structures again involves a change in system topology (Fig. S1), therefore, like Step 1, must involve a transition state (TS3) in which water is exposed to hydrocarbon.
First step
The inset to Fig. 3 A shows that varied from ∼500 kB at 26°C to –400 kB at 43°C, with the change in sign occurring at T∗ ∼36°C. Cp is a measure of the amount of heat (work) required to raise the temperature of a system by a fixed amount and depends on interaction potentials in a system. A system that involves no potential energy of interaction generally has a small , the limit being an ideal gas (1/2 kB per degree of freedom at high temperature). For strong interactions approximated by harmonic potentials, approaches 1 kB per degree of freedom in the classical limit, as might be expected in a crystal. A structural component (i.e., a significant contribution from loss of energetically favorable microstructures with increased temperature) can produce a Cp larger than 1 kB per degree of freedom. The positive observed below T∗, even in the context of acknowledged uncertainty, is still remarkably large. If each atom in TS1 contributed on the order of the maximum possible 1/2 kB per degree of freedom anticipated from adding weak potentials of interaction in TS1 to atoms that were noninteracting in A state, this would reflect participation of ∼350 atoms (i.e., ∼120 water molecules or ∼3 lipid molecules) in TS1. Because we expect strong water-lipid and lipid-lipid interactions in A state rather than no interactions, this represents an extreme lower limit. Because membranes fuse only when their interphosphate separation is ∼0.5–0.6 nm (20), the space between contacting leaflets in our experiments probably contains a limited number of water molecules organized in ways quite different from those in bulk water or even at a normal bilayer-water interface. Indeed, MD predict the limited water in this interbilayer space to be highly ordered due to highly polar water-head group interactions (21). Thus, the A state ensemble likely comprises a limited number of energetically very favorable states, which would have a small heat capacity and entropy. If so, the very large positive likely reflects a significant structural heat capacity for TS1. Because A state and I1 state have different topologies and are stabilized by excluding water from contact with hydrocarbon, the microstructures contributing to the TS1 ensemble also very likely involve hydrocarbon-water interactions, which would account for a large positive . However, hydrocarbon solvation in bulk water is characterized by a small ΔH (can be slightly negative) but a substantially negative , whereas our measurements show ≳ ≫ 0. If water is ordered in TS1 (a reasonable and likely possibility), there must then be another large positive component to . Thus, our data imply that TS1 comprises a rather diverse ensemble of enthalpically unfavorable microstructures that makes a positive contribution to but also provides a smaller negative contribution to due to replacing water-water or water-headgroup interactions with water-hydrocarbon interactions.
Although is large and positive below T∗, it becomes negative at high temperature. This could reflect an increase in of A state, or a decrease in of TS1 at high temperature. We would expect increasing temperature to disrupt the conformationally restricted water predicted for the A state, thus lowering the energy of A state and broadening the ensemble of states contributing to A state thermodynamics. This could increase the enthalpy, entropy, and heat capacity of A state. Similarly, increasing temperature would disrupt weakly ordered water in contact with hydrocarbon in TS1 and decrease its structural heat capacity. These effects would be consistent with the change in at higher temperatures.
We consider in the Discussion possible molecular models for the transition state, TS1, that are consistent with these results.
Second step
Fig. 3 B shows that > ≫ 0, also demonstrating enthalpy-entropy compensation. However, (slope of versus temperature) is now considerably smaller and negative over the entire temperature range (∼ −150 to −300 kB, Fig. 3 B), implying smaller contributions, if any, from changes in weakly ordered water between the stalk and TS2 (TMC geometry, see Fig. S1). Because the stalk (I1), TMC (TS2), and ETMC (I2) structures all share the same topology, the transition from stalk to I2 is legitimately described in terms of the material properties (Bulk Materials Model) of SUVs (18) (see Discussion).
Third step as compared to first step
Like step 1, step 3 involves changes in the topology of lipid structures and thus must occur through a TS involving significant hydrocarbon-water contact. Nonetheless, the activation thermodynamics of step 3 do not show a significantly positive (varies from ∼0 at 26°C to ∼ −360 kB at 43°C; Fig. 3 C, inset) as seen for . This suggests either that TS3 involves less water hydrocarbon contact and a smaller structural heat capacity in comparison to TS1, or that the structural heat capacity of I2 state may be greater than that of A state. In addition, the difference between and is considerably larger than seen for and (Fig. 3, A and C); consequently, pore formation is roughly an order of magnitude slower than initial intermediate formation. This appears to reflect the fact that, unlike , monotonically decreases with temperature and even becomes slightly negative at high temperatures. Fig. S1 reveals that the geometries of A and I2 states are envisioned as very different. The mechanistic consequences of this are taken up in the Discussion where we will more completely describe the free energy profile in Fig. S1.
Effect of hexadecane on PEG-mediated fusion
Fusion time courses at 30°C for hexadecane-containing SUVs are shown in Fig. 1, D–F, along with corresponding time courses in the absence of hexadecane reproduced from Fig. 1, A–C, for easier comparison. Ensemble-fusion-model parameters derived from such time courses at 26, 30, 34, 38, and 43°C are given in Table S2. It is evident from Fig. 1, D–F, and Table S2 that hexadecane had little, if any, effect on the rate of stalk formation but slightly decreased k2 and increased k3 at high but not low temperature. The effects of hexadecane on the activation thermodynamics of these steps are shown in Figs. 2 and 4. Even though hexadecane had no effect on k1 and reduced k2 at high temperatures, it reduced both the transition state enthalpy and entropy of these steps (Fig. 4, A and B), but increased both the activation enthalpy and entropy of pore formation (step 3), whereas lowering at high temperature (Fig. 4 C). and are both negative at low temperature but become nearly zero or positive at higher temperatures (Fig. 4, B and C, insets). By contrast, was nearly zero or very slightly positive at low temperature but became significantly negative at high temperature (Fig. 4 A, inset). The different effects of hexadecane at low and high temperature suggest that its conformation and effects on bilayer or nonlamellar phase structure vary with temperature. Hexadecane's largest effect was in increasing the extent of CM (fCM) and the probability of CM early in the fusion process (α1 and α2 in Tables S1 and S2) at all temperatures. Interestingly, hexadecane had little effect on the extent of LM (fLM), which remained temperature-independent and unchanged relative to control vesicles (Tables S1 and S2). However, in contrast to results in the absence of hexadecane, the extent of CM was maximal (i.e., fCM ∼ fLM) at all temperatures in the presence of hexadecane. Thus, hexadecane mainly influenced pore formation, first by increasing the rate of final pore formation at higher temperatures, but mainly by increasing the probability of flickering pores early in the fusion process. It had no effect on stalk formation.
Figure 4.
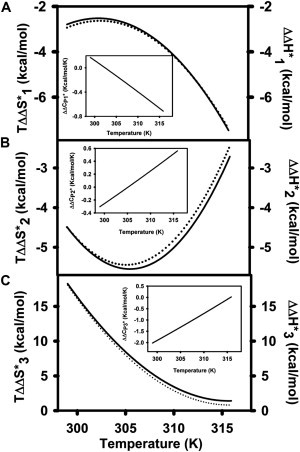
Temperature dependence of (solid line) and (dotted line) for membranes containing 3 mol% hexadecane, where . Frame A: i = 1; Frame B: i = 2; and Frame C:i = 3. is plotted in the insets.
Discussion
We have presented here unique and new, to our knowledge, thermodynamic data on the evolution of states as envisioned by the modified stalk hypothesis. These support the two-intermediate model that was proposed by Siegel (6) and supported by measurements on both natural and model membranes (5,13–16). This model defines three transitions between states. Two published MD studies (22,23) and one Bulk Material computational study (18) have suggested microscopic models for these events. Our observations are consistent with these computational studies and, in concert with them, support reasonable hypotheses for the nature of molecular events associated with the three steps of membrane fusion.
Step one: bilayer defects, acyl chain protrusions?
Our results suggest that the transition state between A state and I1 state (TS1) comprises an ensemble of structurally and energetically similar microstructures involving contact between water and hydrocarbon. It is well known that significant outer leaflet stress, as occurs in highly curved 23 nm SUVs, promotes fusion (19,24). Removal of lipid from outer-leaflets of less highly curved vesicles also produces outer leaflet packing stress, admits water into normally hydrophobic regions, increases outer-leaflet free volume, and promotes fusion (24). We suggested that merging of such stressed regions (packing defects) in adjacent leaflets could produce nucleation points at which two cis leaflets are joined and lead to fusion (24). A recent atomistic MD simulation of very highly curved bilayers (15 nm diameter) under very large positive curvature stress (22) predicted significant acyl chain excursions into the interbilayer space in the dehydrated region of close contact between vesicles, with a nucleation point for stalk formation being a small cluster of chains from contacting bilayers. Both models are consistent with our results that suggest water-hydrocarbon contact in the TS1 transition state (large positive at lower temperatures in Fig. 3 A). However, although bilayer packing defects would promote water-hydrocarbon contact, they would not disrupt water-water or water-headgroup interactions in the interbilayer space of state A. A large positive (Fig. 3 A) implies a significant loss of such polar interactions and thus favors the acyl chain protrusion model. Because bilayer defects or curvature strain would promote the types of acyl chain protrusions predicted by MD simulations, the studies of curvature strain and outer-leaflet defects are also consistent with the chain protrusion model. We consider now whether our results are consistent with it. Because the stalk or I1 structure occurs at rS > 0 (Fig. S1), a wide range of distinct acyl chain configurations can easily be imagined to contribute to the ensemble describing I2, consistent with the observed large and positive (Fig. 3 A). As the probability of acyl chain protrusions should increase with temperature, the A state ensemble should broaden and move to higher energy, consistent with a decrease in and with increasing temperature. This should also reduce the difference in water-hydrocarbon interaction between the A and TS1, making for an increasingly less negative . At sufficiently high temperatures, the density of structural states associated with the TS1 ensemble might actually reduce the heat capacity of this state. We conclude that an ensemble of acyl chain protrusions, as suggested by MD simulations (22), provides a reasonable molecular model of the TS1 transition state that is consistent with our data as well as with previous reports on the effects of curvature and outer-leaflet perturbation (19,24).
Step two: macroscopic materials model
As the stalk radius increases, the free energy minimum corresponding to the I1 or stalk intermediate varies with interstice energy but occurs somewhere between rS = 0 and the rS where a “trans-membrane contact” (6) or TMC (Fig. S1) occurs. This geometry is referred to a dimpled stalk (inset to Fig. S1). The TMC occurs at the unique rS for which trans leaflets first contact and for which the interstice energy is minimal (i.e., minimal geometry mismatch) and bending energy is maximal (i.e., maximal curvature stress), a condition that likely favors formation of transient and/or fusion pores between compartments. Depending on conditions (void energy, osmotic stress, outer to inner leaflet lipid movement), the step 2 transition state (TS2) occurs within ±2–3 Å of the TMC geometry (Fig. S1) (18). Under the conditions of our experiments (balanced osmotic stress, rapid trans-bilayer lipid redistribution associated with SUV fusion (25)), TS2 nearly coincides with the TMC to provide a moderate but broad barrier to stalk (I1) expansion toward I2. Expansion of I1 reduces bending stress (relative to the initial highly stressed SUV geometry) but increases the unfavorable interstice energy (see Fig. 3 in (18)). Because the curvature stress at the TMC edge is largely negative, the barrier should be largely energetic in nature (i.e., positive ), as observed (Fig. 2 B). At the same time, the compensating minimum in interstice energy implies reduced water-hydrocarbon contact in TS2 relative to I1, and the playoff between these energies results in a range of stalk radii for which the energy varies slowly, producing a positive configurational entropy. These calculated properties of TS2 are consistent with the observed positive and a negative . Thus, the transition state thermodynamics we report are consistent with a published computation of the barrier for conversion of I1 into I2 that is based on the bulk rather than molecular properties of lyotropic lipid phases (18). We refer to this as the Bulk Materials Model.
Step three: edge strain, correlated lipid movement?
Before describing the transition from I2 to final fusion pore (FP state), we must examine in more detail both the geometry and energetics of I2 structures. Further increase in the stalk radius beyond the TMC produces a diaphragm, whose radius (rd) grows linearly with stalk radius, although the cross-section geometry at the edge of the diaphragm remains roughly that of the TMC (see Fig. S1). We note that all the cross sections depicted in Fig. S1 must be rotated around an axis perpendicular to the original plane of contact between fusing SUVs to obtain the toroidal structures envisioned by the modified stalk hypothesis (6). As the diaphragm grows, the circumference of this toroid increases, and the total interstice free energy (local energy in the plane integrated over the increasing circumference) of the expanding TMC (ETMC) increases proportionally to rd2. Similarly, the local or cross-sectional bending stress of the TMC (net negative) must be integrated to obtain the bending stress of the toroidal ETMC. This increase in negative curvature stress counteracts the positive curvature stress of the original unfused vesicles, resulting in a reduction in total bending energy as the TMC expands (18). The balance between these two free energy contributions (increasing interstice and decreasing bending energy) produces a shallow free energy minimum that is the I2 state (see Fig. 4 of (18)).
The merged cis leaflets in I2 structures have significant negative curvature stress at the diaphragm circumference in a cross-section view (see Fig. S1). There is also negative curvature stress in the unfused trans leaflets at the point that they join the diaphragm (Fig. S1). The edge of the ETMC geometry also contributes significant unfavorable interstice or void energy. Because of this negative curvature stress, single acyl chain movements (chain protrusions envisioned for step 1) into the interstice are not likely to reduce either interstice or curvature stress. A reduction in curvature stress can be achieved only by escape of a lipid headgroup from stressed regions into the interstice. Clearly, this will involve a large positive energy change associated with movement of a polar lipid headgroup from contact with water to a nonpolar environment, but will also reduce interstice free energy. Thus, we hypothesize that fluctuations of whole lipid molecules into the void volume comprise I2 state fluctuations that could reduce the stress at the highly curved edge of the ETMC geometry at the same time that they reduce the effects of geometric mismatch (void). This is expected to be energetically very unfavorable because interactions between polar head groups and water molecules would be broken. However, simultaneous entry of two or more lipids from adjacent leaflets into the interstice space should reduce the unfavorable energy per lipid by pairing multiple polar heads while allowing acyl chains to orient toward the hydrophobic portion of adjacent leaflets. We term this the correlated lipid movement hypothesis. Fluctuations of this type involving adjacent trans leaflets would offer a reasonable explanation for the movement of small solutes between trapped compartments in I2 state (α2), whereas such fluctuations involving adjacent cis and trans leaflets would account for leakage from the I2 state (λ2).
Because I2 structures are highly strained, nonlamellar, and have a myriad of possible conformations, MD simulations of this step are more challenging and necessarily involve greater approximations. A combined coarse-grain and atomistic MD simulation of vesicles composed of a 1:2 mixture of phosphatidylcholine and fatty acid (23) used compressive pressures to force formation of a stalk that spontaneously transformed to a hemifusion diaphragm, whereupon, applying another external force perturbed the diaphragm and promoted pore formation. The use of externally applied forces may be questioned, but is a reasonable means of constructing the highly strained ETMC from which we predict that fusion pores form (18). The use of fatty acids to form bilayers should promote formation of nonmembrane-like structures. Thus, this simulation is biased toward substantial fluctuations away from lamellar or even stable nonlamellar structures, but does promote trajectories that involve pore formation, which would be extremely rare without these artificial conditions. In all trajectories, pore formation was preceded by invasion of the diaphragm edges by multiple lipids. In most cases, adjacent trans leaflets provided lipids, leading to coalescence of several lipids to form a crude inter-compartment pore at the edge of a small diaphragm. However, in one-sixth of recorded trajectories, cis-and trans-leaflet lipids invaded the diaphragm edge leading to form a trans-leaflet hole, i.e., a leakage pore. Despite the caveats mentioned, this study offers useful molecular insights into the type of pore-forming fluctuations that might be expected in a highly stressed ETMC-like structure, and the results support our correlated lipid movement hypothesis. We argue next that this hypothesis is also consistent with observed activation thermodynamics for final pore formation.
Our comments to this point support the correlated lipid movement hypothesis as a means of explaining transient pores in I2 state. However, the final pores that forms from I2 structures are larger than those associated with CM early in the fusion process ((5) and unpublished observations of H. Chakraborty and B. R. Lentz). We would expect that only correlated lipid fluctuations involving some critical number of lipid molecules would result in transient pores. Of these, the largest might be expected to produce destabilizing intercompartment holes at the diaphragm edge, some of which could rapidly expand, leading to the collapse of the diaphragm and a stable fusion pore. Thus, we view the TS3 ensemble as a subset of the I2 ensemble that involves correlated rearrangements of larger numbers of lipids. In terms of the bulk materials model and Fig. S1, as the ETMC geometry expands, the amount of stressed edge will increase, making multiple-lipid fluctuations more probable. This picture is consistent with several observations. First is the MD simulation referenced previously (23). Second is the observation that k1 is always roughly an order of magnitude larger than k3 in all systems we have examined. The TS for steps 1 and 3 are both proposed to be enthalpically unfavorable due to breaking polar interactions between water and headgroups or water and water. In both cases, we propose that positive configurational entropy should at least partly compensate for this positive . Because we view the I2 and TS3 ensembles as involving very large numbers of similar microstructures, their configurational entropies should be similar. This should diminish the compensating configurational entropy for step 3 relative to that expected for step 1. Thus, our hypotheses imply that entropy/enthalpy compensation should be diminished in step 3 relative to step 1 explaining why is larger than . Third, the microstructures that we hypothesize dominate the I2 ensemble are consistent with our observation that CM and leakage always occur in I2 (see α3 and λ3 in Table S1). Fourth, because both I2 and TS3 have extended TMC geometry and are distinguished only by the size of multilipid correlated fluctuations that contribute to their ensembles, it follows that, under appropriate conditions, the I2 state could become undetectable, with an ETMC geometry simply proceeding to a fusion pore, as we have observed for several systems (H. Chakraborty and B. R. Lentz, unpublished observations). Finally, the different temperature dependences for and are also accounted for by our hypotheses. Having already discussed , we focus on . A negative over most of the temperature range suggests that differences in water-hydrocarbon contact between initial and TS are less significant than in step 1. Our hypotheses propose that both I2 and TS3 ensembles involve similar correlated lipid rearrangements, the difference being mainly in the size of these fluctuations. This predicts that the major contribution to should be from the difference in thermal heat capacity rather than to a difference in structural heat capacity associated with water ordering. Because we propose that I2 state should have more closely spaced energetically unfavorable microstates (larger thermal Cp) compared to TS3, is expected to be negative, as observed. Because should be largely thermal in origin, it should decrease with temperature. We conclude that the models proposed for molecular microstructures contributing to the I2 and TS3 ensembles are consistent with our observations of kinetics and transition state thermodynamics of step 3.
Effects of hexadecane are consistent with proposed models
The models discussed for each of the three steps in the fusion process also seem consistent with the effects of hexadecane on fusion kinetics and activation thermodynamics, as discussed in the Supporting Material. However, principal effects of hexadecane were on the extent of CM (fCM) and on the probability of CM early in the process (α1 and α2), which contribute significantly to fCM. A possible explanation of these effects can be found in the context of the Bulk Materials Model and the other models described here. To the extent that hexadecane lowers interstice energy, the Bulk Material Model predicts that it will increase the stalk radii at which the I1 and I2 minima occur. This increases the circumference over which curvature strain exists in I2, which will increase the probability of correlated lipid fluctuations that permit transfer of small solution between compartments. It will also increase the rS of the dimpled stalk geometry at which I1 occurs and the breadth of the energy minimum associated with this geometry. This increases the size of the I1 ensemble and the likelihood of transient holes that could lead to leakage or CM in I1 (26). Thus, we conclude that the effects of hexadecane on both the rate and extent of pore formation can be explained in terms of its ability to occupy interstice space and alter geometries of fusion intermediates.
Conclusions
The overall goal of this work was to shed light on the nature of the transitions between stable or semistable states of the fusion process. Our kinetic measurements and resulting activation thermodynamics in the presence and absence of hexadecane are consistent with an already published Bulk Materials Model for I1 to I2 conversion during fusion of highly curved vesicles (18). Next, proposed chain protrusions into the dehydrated interface between closely apposed bilayers (22) are consistent with our measurements of step 1 kinetics, transition state thermodynamics, and the existence of transient pores in I1 (α1). Finally, correlated lipid movements at the stressed circumference of the I2 state and TS3 (23) can account for transient pores in I2, for transition state thermodynamics of step 3, and for the order-of-magnitude difference between k1 and k3. Although at this point still unproven, these three hypothetical models for the molecular mechanisms behind the three steps of model membrane fusion offer a framework for considering the effects of fusion proteins on fusion kinetics and activation thermodynamics. Contrasting the effects of functional native and nonfunctional mutant fusion proteins or peptides will provide an opportunity not only to further test these models but also to gain insight into how these proteins catalyze fusion in vivo.
Acknowledgments
This research was supported by the National Institute of General Medical Sciences (grant No. 32707 to B.R.L.).
Footnotes
Michael J. Bruno's present address is Department of Chemistry, Guilford College, Greensboro, NC.
Supporting Material
References
- 1.Lee J., Lentz B.R. Secretory and viral fusion may share mechanistic events with fusion between curved lipid bilayers. Proc. Natl. Acad. Sci. USA. 1998;95:9274–9279. doi: 10.1073/pnas.95.16.9274. [DOI] [PMC free article] [PubMed] [Google Scholar]
- 2.Chernomordik L.V., Kozlov M.M. Mechanics of membrane fusion. Nat. Struct. Mol. Biol. 2008;15:675–683. doi: 10.1038/nsmb.1455. [DOI] [PMC free article] [PubMed] [Google Scholar]
- 3.Kozlov M.M., Leikin S.L., Chizmadzhev Y.A. Stalk mechanism of vesicle fusion. Intermixing of aqueous contents. Eur. Biophys. J. 1989;17:121–129. doi: 10.1007/BF00254765. [DOI] [PubMed] [Google Scholar]
- 4.Yang L., Huang H.W. A rhombohedral phase of lipid containing a membrane fusion intermediate structure. Biophys. J. 2003;84:1808–1817. doi: 10.1016/S0006-3495(03)74988-1. [DOI] [PMC free article] [PubMed] [Google Scholar]
- 5.Lee J., Lentz B.R. Evolution of lipidic structures during model membrane fusion and the relation of this process to cell membrane fusion. Biochemistry. 1997;36:6251–6259. doi: 10.1021/bi970404c. [DOI] [PubMed] [Google Scholar]
- 6.Siegel D.P. The modified stalk mechanism of lamellar/inverted phase transitions and its implications for membrane fusion. Biophys. J. 1999;76:291–313. doi: 10.1016/S0006-3495(99)77197-3. [DOI] [PMC free article] [PubMed] [Google Scholar]
- 7.Lentz B.R., Malinin V., Evans K. Protein machines and lipid assemblies: current views of cell membrane fusion. Curr. Opin. Struct. Biol. 2000;10:607–615. doi: 10.1016/s0959-440x(00)00138-x. [DOI] [PubMed] [Google Scholar]
- 8.Weinreb G., Lentz B.R. Analysis of membrane fusion as a two-state sequential process: evaluation of the stalk model. Biophys. J. 2007;92:4012–4029. doi: 10.1529/biophysj.106.090043. [DOI] [PMC free article] [PubMed] [Google Scholar]
- 9.Rand R.P., Fuller N.L., Parsegian V.A. Membrane curvature, lipid segregation, and structural transitions for phospholipids under dual-solvent stress. Biochemistry. 1990;29:76–87. doi: 10.1021/bi00453a010. [DOI] [PubMed] [Google Scholar]
- 10.Chen Z., Rand R.P. Comparative study of the effects of several n-alkanes on phospholipid hexagonal phases. Biophys. J. 1998;74:944–952. doi: 10.1016/S0006-3495(98)74017-2. [DOI] [PMC free article] [PubMed] [Google Scholar]
- 11.Lentz B.R., Siegel D.P., Malinin V. Filling potholes on the path to fusion pores. Biophys. J. 2002;82:555–557. doi: 10.1016/S0006-3495(02)75420-9. [DOI] [PMC free article] [PubMed] [Google Scholar]
- 12.Dennison S.M., Greenfield N., Lentz B.R. VSV transmembrane domain (TMD) peptide promotes PEG-mediated fusion of liposomes in a conformationally sensitive fashion. Biochemistry. 2002;41:14925–14934. doi: 10.1021/bi0203233. [DOI] [PubMed] [Google Scholar]
- 13.Chanturiya A., Chernomordik L.V., Zimmerberg J. Flickering fusion pores comparable with initial exocytotic pores occur in protein-free phospholipid bilayers. Proc. Natl. Acad. Sci. USA. 1997;94:14423–14428. doi: 10.1073/pnas.94.26.14423. [DOI] [PMC free article] [PubMed] [Google Scholar]
- 14.Fernandez J.M., Neher E., Gomperts B.D. Capacitance measurements reveal stepwise fusion events in degranulating mast cells. Nature. 1984;312:453–455. doi: 10.1038/312453a0. [DOI] [PubMed] [Google Scholar]
- 15.Chow R.H., von Rüden L., Neher E. Delay in vesicle fusion revealed by electrochemical monitoring of single secretory events in adrenal chromaffin cells. Nature. 1992;356:60–63. doi: 10.1038/356060a0. [DOI] [PubMed] [Google Scholar]
- 16.Oberhauser A.F., Monck J.R., Fernandez J.M. Events leading to the opening and closing of the exocytotic fusion pore have markedly different temperature dependencies. Kinetic analysis of single fusion events in patch-clamped mouse mast cells. Biophys. J. 1992;61:800–809. doi: 10.1016/S0006-3495(92)81884-2. [DOI] [PMC free article] [PubMed] [Google Scholar]
- 17.Yoon T.-Y., Okumus B., Ha T. Multiple intermediates in SNARE-induced membrane fusion. Proc. Natl. Acad. Sci. USA. 2006;103:19731–19736. doi: 10.1073/pnas.0606032103. [DOI] [PMC free article] [PubMed] [Google Scholar]
- 18.Malinin V.S., Lentz B.R. Energetics of vesicle fusion intermediates: comparison of calculations with observed effects of osmotic and curvature stresses. Biophys. J. 2004;86:2951–2964. doi: 10.1016/S0006-3495(04)74346-5. [DOI] [PMC free article] [PubMed] [Google Scholar]
- 19.Talbot W.A., Zheng L.X., Lentz B.R. Acyl chain unsaturation and vesicle curvature alter outer leaflet packing and promote poly(ethylene glycol)-mediated membrane fusion. Biochemistry. 1997;36:5827–5836. doi: 10.1021/bi962437i. [DOI] [PubMed] [Google Scholar]
- 20.Burgess S.W., McIntosh T.J., Lentz B.R. Modulation of poly(ethylene glycol)-induced fusion by membrane hydration: importance of interbilayer separation. Biochemistry. 1992;31:2653–2661. doi: 10.1021/bi00125a004. [DOI] [PubMed] [Google Scholar]
- 21.Kasson P.M., Lindahl E., Pande V.S. Water ordering at membrane interfaces controls fusion dynamics. J. Am. Chem. Soc. 2011;133:3812–3815. doi: 10.1021/ja200310d. [DOI] [PubMed] [Google Scholar]
- 22.Kasson P.M., Lindahl E., Pande V.S. Atomic-resolution simulations predict a transition state for vesicle fusion defined by contact of a few lipid tails. PLOS Comput. Biol. 2010;6:e1000829. doi: 10.1371/journal.pcbi.1000829. [DOI] [PMC free article] [PubMed] [Google Scholar]
- 23.Knecht V., Marrink S.J. Molecular dynamics simulations of lipid vesicle fusion in atomic detail. Biophys. J. 2007;92:4254–4261. doi: 10.1529/biophysj.106.103572. [DOI] [PMC free article] [PubMed] [Google Scholar]
- 24.Lee J., Lentz B.R. Outer leaflet-packing defects promote poly(ethylene glycol)-mediated fusion of large unilamellar vesicles. Biochemistry. 1997;36:421–431. doi: 10.1021/bi9622332. [DOI] [PubMed] [Google Scholar]
- 25.Lentz B.R., Talbot W., Zheng L.X. Transbilayer lipid redistribution accompanies poly(ethylene glycol) treatment of model membranes but is not induced by fusion. Biochemistry. 1997;36:2076–2083. doi: 10.1021/bi9623340. [DOI] [PubMed] [Google Scholar]
- 26.Müller M., Katsov K., Schick M. A new mechanism of model membrane fusion determined from Monte Carlo simulation. Biophys. J. 2003;85:1611–1623. doi: 10.1016/S0006-3495(03)74592-5. [DOI] [PMC free article] [PubMed] [Google Scholar]
- 27.Chen P.S., Toribara T.Y., Warner H. Microdetermination of phosphorus. Anal. Chem. 1956;28:1756–1758. [Google Scholar]
- 28.Haque M.E., McIntosh T.J., Lentz B.R. Influence of lipid composition on physical properties and peg-mediated fusion of curved and uncurved model membrane vesicles: “nature's own” fusogenic lipid bilayer. Biochemistry. 2001;40:4340–4348. doi: 10.1021/bi002030k. [DOI] [PubMed] [Google Scholar]
- 29.Lentz B.R., Carpenter T.J., Alford D.R. Spontaneous fusion of phosphatidylcholine small unilamellar vesicles in the fluid phase. Biochemistry. 1987;26:5389–5397. doi: 10.1021/bi00391a026. [DOI] [PubMed] [Google Scholar]
- 30.Haque M.E., McCoy A.J., Lentz B.R. Effects of hemagglutinin fusion peptide on poly(ethylene glycol)-mediated fusion of phosphatidylcholine vesicles. Biochemistry. 2001;40:14243–14251. doi: 10.1021/bi011308l. [DOI] [PubMed] [Google Scholar]
- 31.Haque M.E., Chakraborty H., Lentz B.R. Hemagglutinin fusion peptide mutants in model membranes: structural properties, membrane physical properties, and PEG-mediated fusion. Biophys. J. 2011;101:1095–1104. doi: 10.1016/j.bpj.2011.07.031. [DOI] [PMC free article] [PubMed] [Google Scholar]
- 32.Malinin V.S., Haque M.E., Lentz B.R. The rate of lipid transfer during fusion depends on the structure of fluorescent lipid probes: a new chain-labeled lipid transfer probe pair. Biochemistry. 2001;40:8292–8299. doi: 10.1021/bi010570r. [DOI] [PubMed] [Google Scholar]
- 33.Malinin V.S., Lentz B.R. Pyrene cholesterol reports the transient appearance of nonlamellar intermediate structures during fusion of model membranes. Biochemistry. 2002;41:5913–5919. doi: 10.1021/bi011924h. [DOI] [PubMed] [Google Scholar]
- 34.Chan H.S., Dill K.A. Protein folding in the landscape perspective: chevron plots and non-Arrhenius kinetics. Proteins. 1998;30:2–33. doi: 10.1002/(sici)1097-0134(19980101)30:1<2::aid-prot2>3.0.co;2-r. [DOI] [PubMed] [Google Scholar]
Associated Data
This section collects any data citations, data availability statements, or supplementary materials included in this article.