High-throughput sequencing of 16S rRNA gene amplicons is a valuable tool for comparing microbial community structure among hundreds of samples for which researchers have primarily used the 454 Pyrosequencing platform. The Illumina platform produces far more reads than 454 (up to 1.5 billion reads per run, compared with 1 million reads per run on a 454 plate of comparable cost), but produces fewer base pairs (bp) per read (75–150 bp per read compared with 250–400 bp per read on 454). The shorter Illumina reads may reduce phylogenetic resolution, both in terms of picking operational taxonomic units (OTUs) and determining evolutionary distances between OTUs. The paired-end (PE) approach where each molecule is sequenced from both the 5′ and 3′ ends can double the number of bp per read for the Illumina platform. Some researchers have obtained overlapping PE Illumina reads covering the V3 (Bartram et al., 2011) or V6 (Zhou et al., 2011) regions of 16S rRNA genes, but many other useful primer regions (for example, V1–V2 or V4) are >200 bp in length in which case PE reads do not overlap. However, it is possible, as we present here, to use non-overlapping PE reads to pick OTUs and build a phylogenetic tree. We assessed the utility of using PE Illumina sequencing, compared with results from single-direction (SD) sequencing from the 5′ position of the V4 region of 16S rRNA genes. We compared alpha- and beta-diversity analyses (species richness and between-sample comparisons, respectively), using previously published non-overlapping PE Illumina sequence data from 16S rRNA gene surveys of 28 human microbiome and environmental samples (Caporaso et al., 2011).
Illumina sequences were quality filtered using the default pipeline in QIIME 1.2.1 (Caporaso et al., 2010b), including the default quality thresholds and a minimum read length of 75 bp. To avoid potential biases from quality filtering, only sequences passing the quality threshold in both 5′ and 3′ reads were kept for downstream processing (43% of the total reads were removed because one of the two directions did not pass the quality threshold). All reads were trimmed to 75 bp length (total of 150 bp per seq for PE). The PE and 5′ SD data were analyzed separately, using the default settings in QIIME, with the following additional steps for PE data: before OTU-picking with uclust (97% ID) (Edgar, 2010), we joined PE reads ‘inside-out' such that the 3′ end of the 3′ read was to the left of the 5′ end of the 5′ read, required for uclust to perform accurate pairwise alignments. Based on a simulation using Greengenes sequences trimmed to the V4 region, we found that uclust assigned similar pairwise alignment distances to inside-out reads compared with the normal configuration (Supplementary Figure S1). OTU representative sequences (separate 3′ and 5′ reads for PE) were aligned with PyNAST (Caporaso et al., 2010a) against separate regions of the August 2007 Greengenes core (DeSantis et al., 2006), trimmed to positions 2250–2423 for 5′ reads and 3805–4069 for 3′ reads. Trimming reference sequences had advantages of rapid computation, more stringent discarding of non-16S reads, and has previously been shown to improve taxonomic classification (Werner et al., 2011b). We built a phylogenetic tree (FastTree) (Price et al., 2010) from aligned, filtered sequences (for PE, the separate 5′ and 3′ alignments were joined end-to-end to use all 150 bp for phylogeny). Separately for each method, we discarded OTUs with fewer than 10 total reads (2.6% of the 16.6 million high-quality reads). This was done to discard false diversity because of sequencing errors, by setting a 10 × threshold of evidence needed to support a true sequence. OTUs that failed to align >72 bp (0.007% of remaining reads) were also removed.
We obtained slightly higher alpha-diversity (Chao1) using PE data compared with 5′ SD data, but the results were still comparable (Supplementary Figure S2). Between-sample comparisons of alpha-diversity were consistent, except for the fecal samples, which had greater disagreement. We also observed that the pairing of sequences into the same OTU was least consistent for fecal and soil samples, comparing PE and 5′ SD data (Supplementary Figure S3). We additionally used three beta-diversity metrics to calculate distances between samples in both the PE data and the 5′ SD read data: Bray–Curtis (based on relative abundances of OTUs), unweighted UniFrac (based on phylogenetic structure), and weighted UniFrac (based on phylogenetic structure, weighted by OTU abundances). All three metrics have a scale from 0 to 1.
Bray–Curtis distances for OTUs picked based on PE reads vs 5′ SD reads were closely correlated (Supplementary Figure S4A; R2=0.993). Disagreement between absolute distances was below 0.1 (Supplementary Figure S4D), and the UPGMA clustering of samples was comparable between methods (Supplementary Figure S5). Thus, the two OTU-picking strategies resulted in the same beta-diversity results when measured using a distance metric based solely on OTU picking.
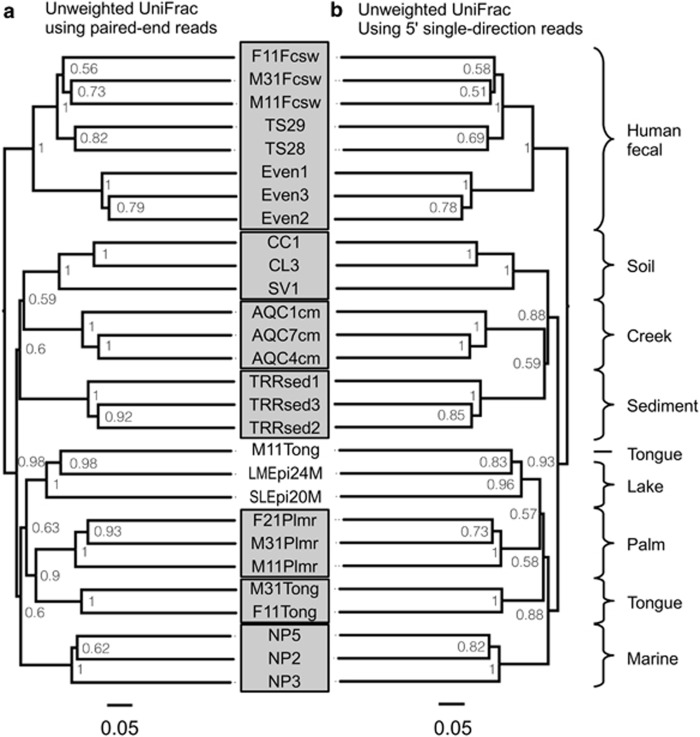
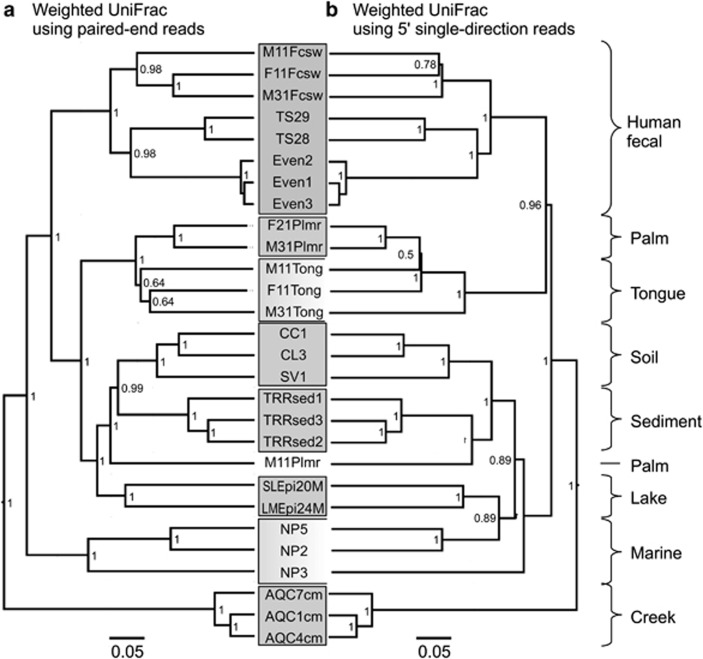
We used the UniFrac distance metric (Lozupone and Knight, 2005) to compare sample clustering based on phylogenetic structure. Unweighted UniFrac has provided useful results in a number of microbiome studies (Ley et al., 2008; Costello et al., 2009; Werner et al., 2011a). There were no practical differences between unweighted UniFrac clustering results from PE data (Figure 1a) and 5′ SD data (Figure 1b). Distances were closely correlated between methods (Supplementary Figure S4B; R2=0.982) and absolute differences were below 0.1 (Supplementary Figure S4E). However, abundance-weighted UniFrac produced different results between the two methods (Supplementary Figure S4C and F; R2=0.811; absolute differences up to 0.3), which resulted in more consistent sample clustering from the PE data compared with 5′ SD data (Figure 2). These patterns were verified using ordination and Procrustes analysis (Supplementary Figure S6).
Figure 1.
Choice of PE or SD reads made no practical difference in phylogenetic clustering of samples: UPGMA tree of unweighted UniFrac distances between samples determined using the PE sequence data (a) as well as SD reads (b). Bootstrap values represent 100 rarefactions of 50 000 sequences per sample.
Figure 2.
Choice of PE or SD reads affected the higher-order branching of abundance-weighted UniFrac clustering of samples: UPGMA tree of weighted UniFrac distances between samples determined using the PE sequence data (a) as well as SD reads (b). Bootstrap values represent 100 rarefactions of 50 000 sequences per sample. Note the more consistent clustering of marine and tongue samples using PE reads.
On the basis of these results, we expect that future 16S rRNA gene surveys using SD reads in the V4 region will yield similar OTU profiles and unweighted UniFrac results, compared with the significantly more expensive PE approach. However, some research questions may require the weighted UniFrac metric, and the non-overlapping PE approach presented here yielded moderate improvements in sample-weighted UniFrac clustering. Also important to note, and not considered here, are the advantages of overlapping PE reads, including error correction, though this is currently not possible in the V4 region.
Acknowledgments
This work was funded by the USDA through the National Institute of Food and Agriculture (NIFA), grant number 2007-35504-05381 to LTA, the Cornell University Agricultural Experiment Station federal formula funds NYC-123444 received from the USDA NIFA to LTA, and the Howard Hughes Medical Institute to RK.
Footnotes
Supplementary Information accompanies the paper on The ISME Journal website (http://www.nature.com/ismej)
Supplementary Material
References
- Bartram AK, Lynch MDJ, Stearns JC, Moreno-Hagelsieb G, Neufeld JD. Generation of multimillion-sequence 16S rRNA gene libraries from complex microbial communities by assembling paired-end Illumina reads. Appl Environ Microbio. 2011;77:3846–3852. doi: 10.1128/AEM.02772-10. [DOI] [PMC free article] [PubMed] [Google Scholar]
- Caporaso JG, Bittinger K, Bushman FD, DeSantis TZ, Andersen GL, Knight R. PyNAST: a flexible tool for aligning sequences to a template alignment. Bioinformatics. 2010a;26:266–267. doi: 10.1093/bioinformatics/btp636. [DOI] [PMC free article] [PubMed] [Google Scholar]
- Caporaso JG, Kuczynski J, Stombaugh J, Bittinger K, Bushman FD, Costello EK, et al. QIIME allows analysis of high-throughput community sequencing data. Nat Meth. 2010b;7:335–336. doi: 10.1038/nmeth.f.303. [DOI] [PMC free article] [PubMed] [Google Scholar]
- Caporaso JG, Lauber CL, Walters WA, Berg-Lyons D, Lozupone C, Turnbaugh PJ, et al. Global patterns of 16S rRNA diversity at a depth of millions of sequences per sample. Proc Natl Acad Sci USA. 2011;108:4516–4522. doi: 10.1073/pnas.1000080107. [DOI] [PMC free article] [PubMed] [Google Scholar]
- Costello EK, Lauber CL, Hamady M, Fierer N, Gordon JI, Knight R. Bacterial community variation in human body habitats across space and time. Science. 2009;326:1694–1697. doi: 10.1126/science.1177486. [DOI] [PMC free article] [PubMed] [Google Scholar]
- DeSantis TZ, Hugenholtz P, Larsen N, Rojas M, Brodie EL, Keller K, et al. Greengenes, a chimera-checked 16S rRNA gene database and workbench compatible with ARB. Appl Environ Microbio. 2006;72:5069–5072. doi: 10.1128/AEM.03006-05. [DOI] [PMC free article] [PubMed] [Google Scholar]
- Edgar RC. Search and clustering orders of magnitude faster than BLAST. Bioinformatics. 2010;26:2460–2461. doi: 10.1093/bioinformatics/btq461. [DOI] [PubMed] [Google Scholar]
- Ley RE, Hamady M, Lozupone C, Turnbaugh PJ, Ramey RR, Bircher JS, et al. Evolution of mammals and their gut microbes. Science. 2008;320:1647–1651. doi: 10.1126/science.1155725. [DOI] [PMC free article] [PubMed] [Google Scholar]
- Lozupone C, Knight R. UniFrac: a new phylogenetic method for comparing microbial communities. Appl Environ Microbio. 2005;71:8228–8235. doi: 10.1128/AEM.71.12.8228-8235.2005. [DOI] [PMC free article] [PubMed] [Google Scholar]
- Price MN, Dehal PS, Arkin AP. FastTree 2-approximately maximum-likelihood trees for large alignments. Plos One. 2010;5:e9490. doi: 10.1371/journal.pone.0009490. [DOI] [PMC free article] [PubMed] [Google Scholar]
- Werner JJ, Knights D, Garcia ML, Scalfone NB, Smith S, Yarasheski K, et al. Bacterial community structures are unique and resilient in full-scale bioenergy systems. Proc Natl Acad Sci USA. 2011a;108:4158–4163. doi: 10.1073/pnas.1015676108. [DOI] [PMC free article] [PubMed] [Google Scholar]
- Werner JJ, Koren O, Hugenholtz P, DeSantis TZ, Walters WA, Caporaso JG, et al. 2011bImpact of training sets on classification of high-throughput bacterial 16S rRNA gene surveys ISME Je-pub ahead of print 30 June 2011 doi: 10.1038/ismej.2011.82 [DOI] [PMC free article] [PubMed]
- Zhou HW, Li DF, Tam NFY, Jiang XT, Zhang H, Sheng HF, et al. BIPES, a cost-effective high-throughput method for assessing microbial diversity. ISME J. 2011;5:741–749. doi: 10.1038/ismej.2010.160. [DOI] [PMC free article] [PubMed] [Google Scholar]
Associated Data
This section collects any data citations, data availability statements, or supplementary materials included in this article.


