The prognostic value of the peripheral blood absolute lymphocyte count (ALC), absolute monocyte count (AMC), and ALC/AMC ratio at diagnosis in patients with classic Hodgkin's lymphoma was evaluated, and relationships with tumor-associated macrophages were examined.
Keywords: Hodgkin's lymphoma, Monocytes, Lymphocytes, Lymphocyte/monocyte ratio, Prognosis
Abstract
Background.
Although most patients with classical Hodgkin's lymphoma (cHL) have a long survival duration, the current risk stratification is imperfect. A recent study suggested a prognostic role for the peripheral blood absolute lymphocyte count/absolute monocyte count (ALC/AMC) ratio at diagnosis in cHL. It is intriguing to investigate the significance of the ALC/AMC ratio in relation to tumor-associated macrophages (TAMs), yet another prognostic factor for cHL.
Methods.
We examined the prognostic impact of the ALC, AMC, and ALC/AMC ratio in 312 cHL patients (median age, 37 years) using receiver operating characteristic curve analysis for optimal cutoff values, and compared these with TAM content.
Results.
The median follow-up was 65 months (range, 0.1–245 months). On univariate analysis, a low ALC/AMC ratio (<2.9) was correlated with a poorer overall survival (OS) outcome. A subgroup analysis of patients with limited-stage disease showed that the ALC/AMC ratio was significantly correlated with the OS time. Multivariate analysis showed the ALC/AMC ratio to be an independent prognostic factor for OS outcome. A Spearman correlation test of TAM content showed a negative correlation with the ALC/AMC ratio and a positive correlation with the peripheral blood macrophage percentage.
Conclusions.
This study suggests that the ALC/AMC ratio may be a simple, inexpensive, and independent prognostic factor for OS outcome in patients with cHL and may have a role in the stratification of cHL patients in addition to the International Prognostic Score and TAM content.
Introduction
The International Prognostic Score (IPS) is the standard stratification system for survival in patients with classical Hodgkin's lymphoma (cHL) [1]. However, it is less suitable for patients with limited-stage disease. Furthermore, early interim positron emission tomography has been shown to have a prognostic value superior to that of the IPS in patients with advanced-stage cHL in a recent analysis [2].
Pathologically, cHL is characterized by the presence of a small number of diagnostic Reed-Sternberg cells in a background of bystander reactive cells composed of lymphocytes, neutrophils, macrophages, eosinophils, and plasma cells. Tumor-infiltrating lymphocytes have been associated with survival outcomes [3, 4]. It has been suggested that the baseline lymphocyte count may have a prognostic role in patients with cHL. Lymphopenia, defined by the IPS as <600 cells/μL or <8% of the WBC, is associated with an adverse survival outcome. Estimation of the tumor-associated macrophages (TAM) content in lesional tissues has been shown to be a strong prognostic indicator in cHL using gene expression profile analysis and subsequent immunohistochemical detection with CD68 [5]. Many investigators, including the present authors, validated the adverse prognostic impact of a high TAM content using immunohistochemical staining for CD68 and CD163 [5–10]. TAMs are believed to provide trophic factors that directly accelerate the growth and survival of malignant lymphocytes [11–14].
Recently, the peripheral blood absolute lymphocyte count (ALC)/absolute monocyte count (AMC) ratio at diagnosis in cHL patients was reported to be a prognostic factor for clinical outcomes [15]. Because TAMs originate from circulating monocytes, it is not surprising that the peripheral blood AMC or ALC/AMC ratio may influence TAM content. How the peripheral blood AMC, ALC/AMC ratio, and TAM content may interact with one another in cHL patients in conjunction with clinical outcome is unknown at the present. In the present study, we examined the prognostic significance of the peripheral blood ALC/AMC ratio at diagnosis and its correlation with TAM content in a retrospective analysis of 312 patients with cHL.
Materials and Methods
Patients
We carried out a retrospective study of 312 consecutive patients with cHL diagnosed at Asan Medical Center in 1989–2011 and Seoul National University Boramae Medical Center in 1996–2010. All patients met the following criteria: pathologically confirmed cHL; no previous treatment; no previous history of malignancy, transplantation, or immunosuppression; negativity for anti-HIV; treatment with combination chemotherapy with or without radiation treatment; and the availability of laboratory data and follow-up information.
Clinical characteristics were obtained from medical records. Response criteria were based on standard guidelines. Routine follow-up imaging analyses were performed every 3 months for the first 2 years, then every 6 months for the next 3 years, and then annually or whenever clinically indicated.
The ALC and AMC were obtained from the CBC examined at the time of the cHL diagnosis. The ALC/AMC ratio was calculated by dividing the ALC by the AMC from the CBC.
Histopathological Analysis and Quantitation of CD68- and CD163-Expressing Cells
All histological data from patients were reviewed by three pathologists (J.H., Y.W.K., H.J.K.), and histological subtype was classified using the World Health Organization criteria as nodular sclerosis (NS), lymphocyte rich, mixed cellularity (MC), lymphocyte depleted, or HL not otherwise specified.
For TAM content, we used previously published data on 144 patients from Asan Medical Center [7]. The relative percentages of TAMs in relation to overall cellularity were obtained by counting the cells immunostained with CD68 (clone Kp1, mouse monoclonal, 1:2,000 dilution; Dako, Glostrup, Denmark) and CD163 (clone 10D6, mouse monoclonal, 1:400 dilution; Novocastra, Newcastle, U.K.). Mean scores of the counts in three representative (tumor-containing) high-power (400×) fields with the strongest staining (CD68 index and CD163 index, respectively) were used for the analysis. In situ hybridization for Epstein–Barr virus (EBV)-encoded RNA-1 and RNA-2 was performed and scored as described elsewhere [16].
Statistical Analysis
The overall survival (OS) time was defined as the time between the first day of diagnosis and the date of death from any cause; the follow-up of patients still alive was censored at their latest date of follow-up. The event-free survival (EFS) time was defined as the interval between the first day of diagnosis and the date of disease progression, relapse, or death from any cause; the follow-up of patients still alive without event was censored at the latest date of their follow-up. OS and EFS outcomes were analyzed using Kaplan–Meier curves, which were compared using log-rank testing. Multivariate prognostic analyses were performed for OS and EFS outcomes using the Cox proportional hazards regression model. Receiver operating characteristic (ROC) curve analysis was used to determine the optimal cutoff values of the ALC, AMC, and ALC/AMC ratio; values with the maximum joint sensitivity and specificity were selected. The binary clinical outcome (death or survival) was determined at 5 years after diagnosis. Patients were categorized as alive or censored when the follow-up time was >5 years and dead when patients were recognized to have died before this time point [17]. Categorical variables were compared using χ2 tests. Continuous variables, reported as median range, were compared using the Wilcoxon rank-sum test. Spearman correlation analysis was used to describe the correlation between quantitative variables. All statistical analyses were performed using SPSS version 18.0 statistical software (SPSS, Inc., Chicago, IL). Results were considered to be statistically significant when the p-value was <.05.
Results
Patient Characteristics
The clinical characteristics of the 312 patients included in the present study are summarized in Table 1. The median follow-up period following diagnosis was 65 months for the entire cohort (range, 0.1–245 months) and 71 months for censored patients (range, 2–245 months). We recorded 100 patients experiencing relapse, disease progression, or death. The median EFS time was 36 months (95% confidence interval [CI], 28–40 months). Estimated 5-year OS and EFS rates of 86.4% and 64.2%, respectively, were observed. At diagnosis, the median ALC was 1,600 cell/μL (range, 200–7,200 cell/μL) and the median AMC was 606 cell/μL (range, 29–2,198 cell/μL).
Table 1.
Demographic and clinical characteristics of patients
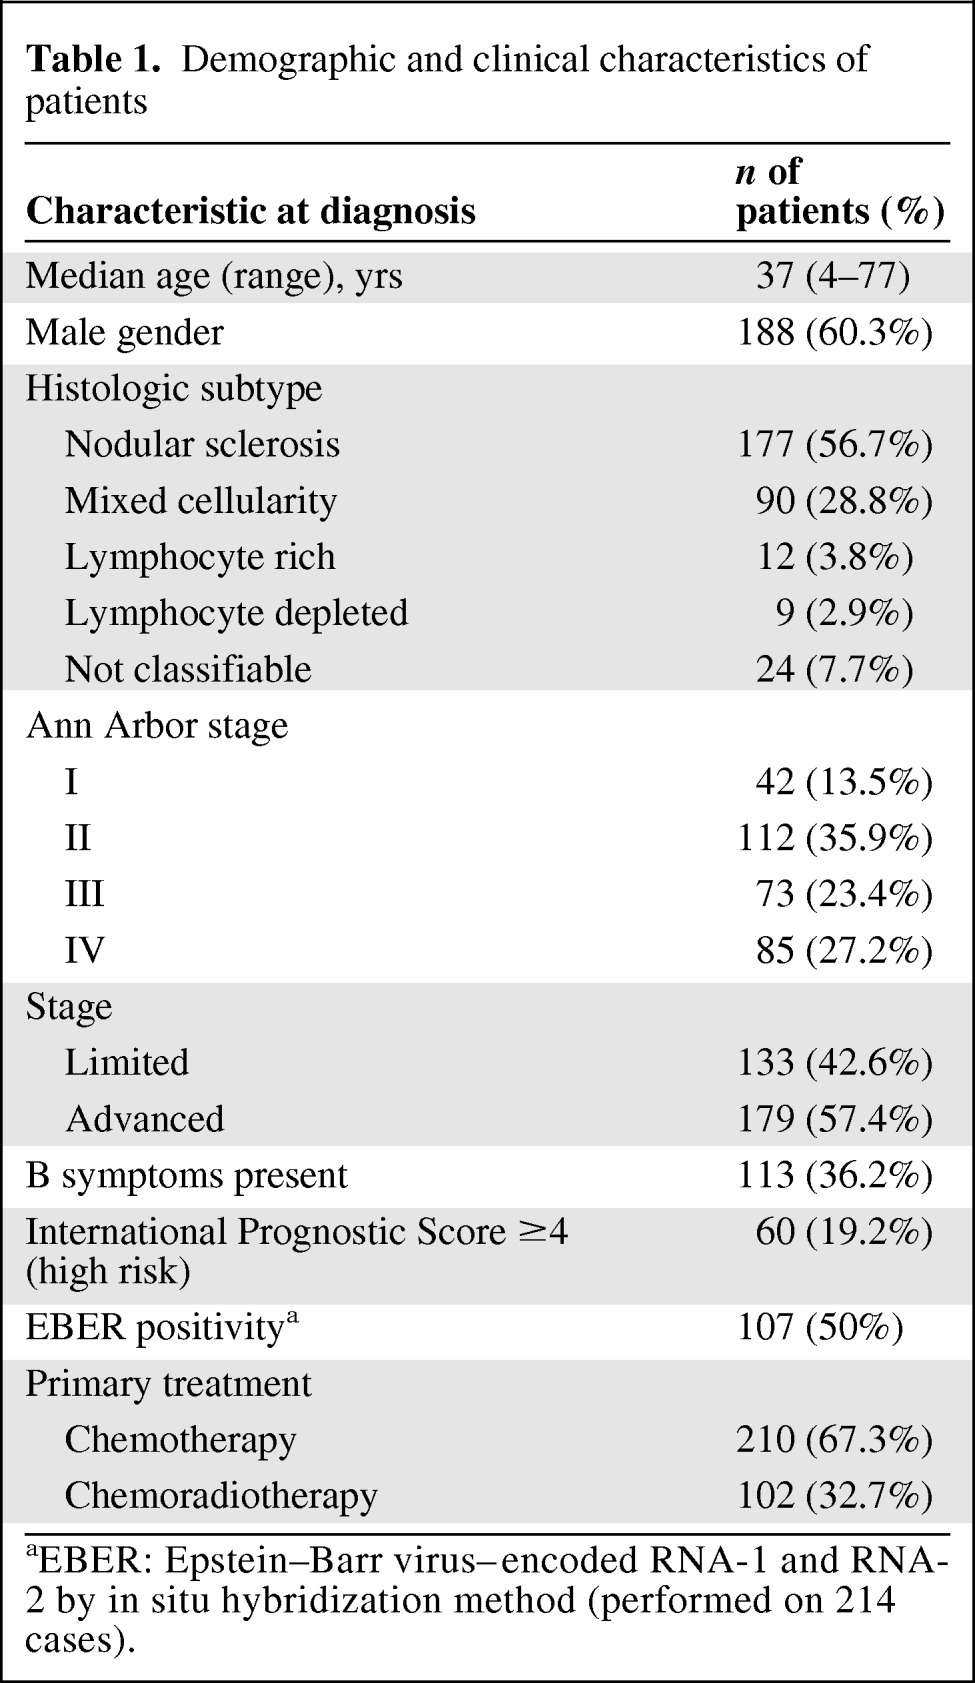
aEBER: Epstein–Barr virus–encoded RNA-1 and RNA-2 by in situ hybridization method (performed on 214 cases).
Cutoff Values for the ALC, AMC, and ALC/AMC Ratio for the Survival Analysis
ROC curves for the ALC, AMC, and ALC/AMC ratio according to survival outcomes were generated to determine a cutoff value. The area under the curve (AUC) was recorded as 0.63 (95% CI, 0.536–0.724) for the ALC (Fig. 1A). The ALC value of 1,100 corresponded to the maximum joint sensitivity and specificity on the ROC curve (48% sensitivity and 77% specificity). The AUC was calculated to be 0.517 (95% CI, 0.413–0.621) for the AMC (Fig. 1B). The AMC value of 690 corresponded to the maximum joint sensitivity and specificity on the ROC curve (38% sensitivity and 73% specificity). The AUC was calculated to be 0.618 (95% CI, 0.520–0.716) for the ALC/AMC ratio (Fig. 1C). The ALC/AMC ratio of 2.9 corresponded to the maximum joint sensitivity and specificity on the ROC curve (74% sensitivity and 54% specificity).
Figure 1.
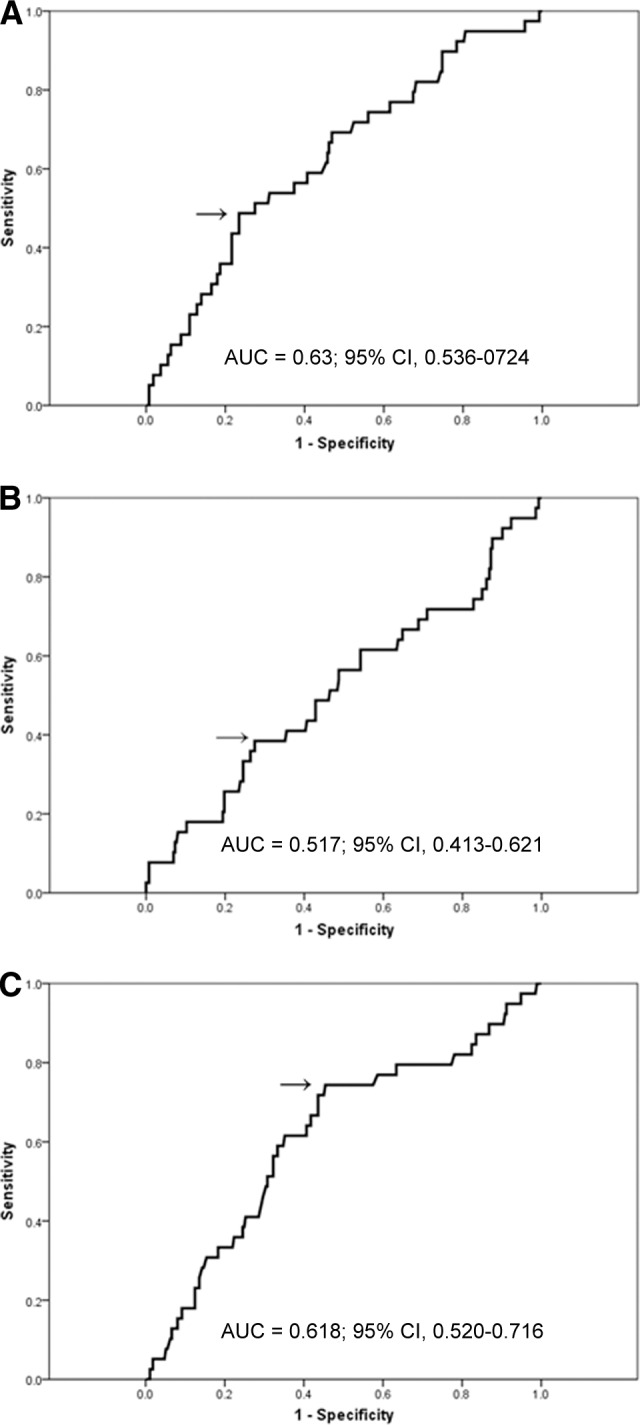
Receiver operating characteristic curve (ROC) and area under the curve (AUC) for the ALC (A), AMC (B), and ALC/AMC ratio (C) at diagnosis.
Abbreviations: ALC, absolute lymphocyte count; AMC, absolute monocyte count; CI, confidence interval.
Comparison of Patients with an ALC/AMC Ratio ≥2.9 and Patients with an ALC/AMC Ratio <2.9
The clinicopathological features of the patients with an ALC/AMC ratio ≥2.9 and those with an ALC/AMC ratio <2.9 are summarized in Table 2. One hundred fifty-eight patients (50.6%) had an ALC/AMC ratio ≥2.9 and 154 patients (49.4%) had an ALC/AMC ratio <2.9. An ALC/AMC ratio <2.9 was significantly correlated with a higher Ann Arbor stage (p < .001), the presence of B symptoms (p < .001), the IPS (p < .001), lower levels of albumin (p < .001) and hemoglobin (p < .001), and the CD163 score (p = .006). Considering the factors used to calculate the IPS, an ALC/AMC ratio <2.9 was associated with stage 4 disease (p < .001), an ALC <600 cells/μL or <8% of the WBC (p < .001), an albumin level <4 g/dL (p = .027), and a hemoglobin level <10.5 g/dL (p < .001). No distinction between the groups was observed in age (p = .063), sex (p = .204), histological type (p > .999), British National Lymphoma Investigation (BNLI) grade (p > .999), WBC (p = .219), treatment method (p = .228), EBV positivity by in situ hybridization (p = .412), and CD68 score (p = .1).
Table 2.
Clinical comparison between an ALC/AMC ≥2.9 and an ALC/AMC <2.9
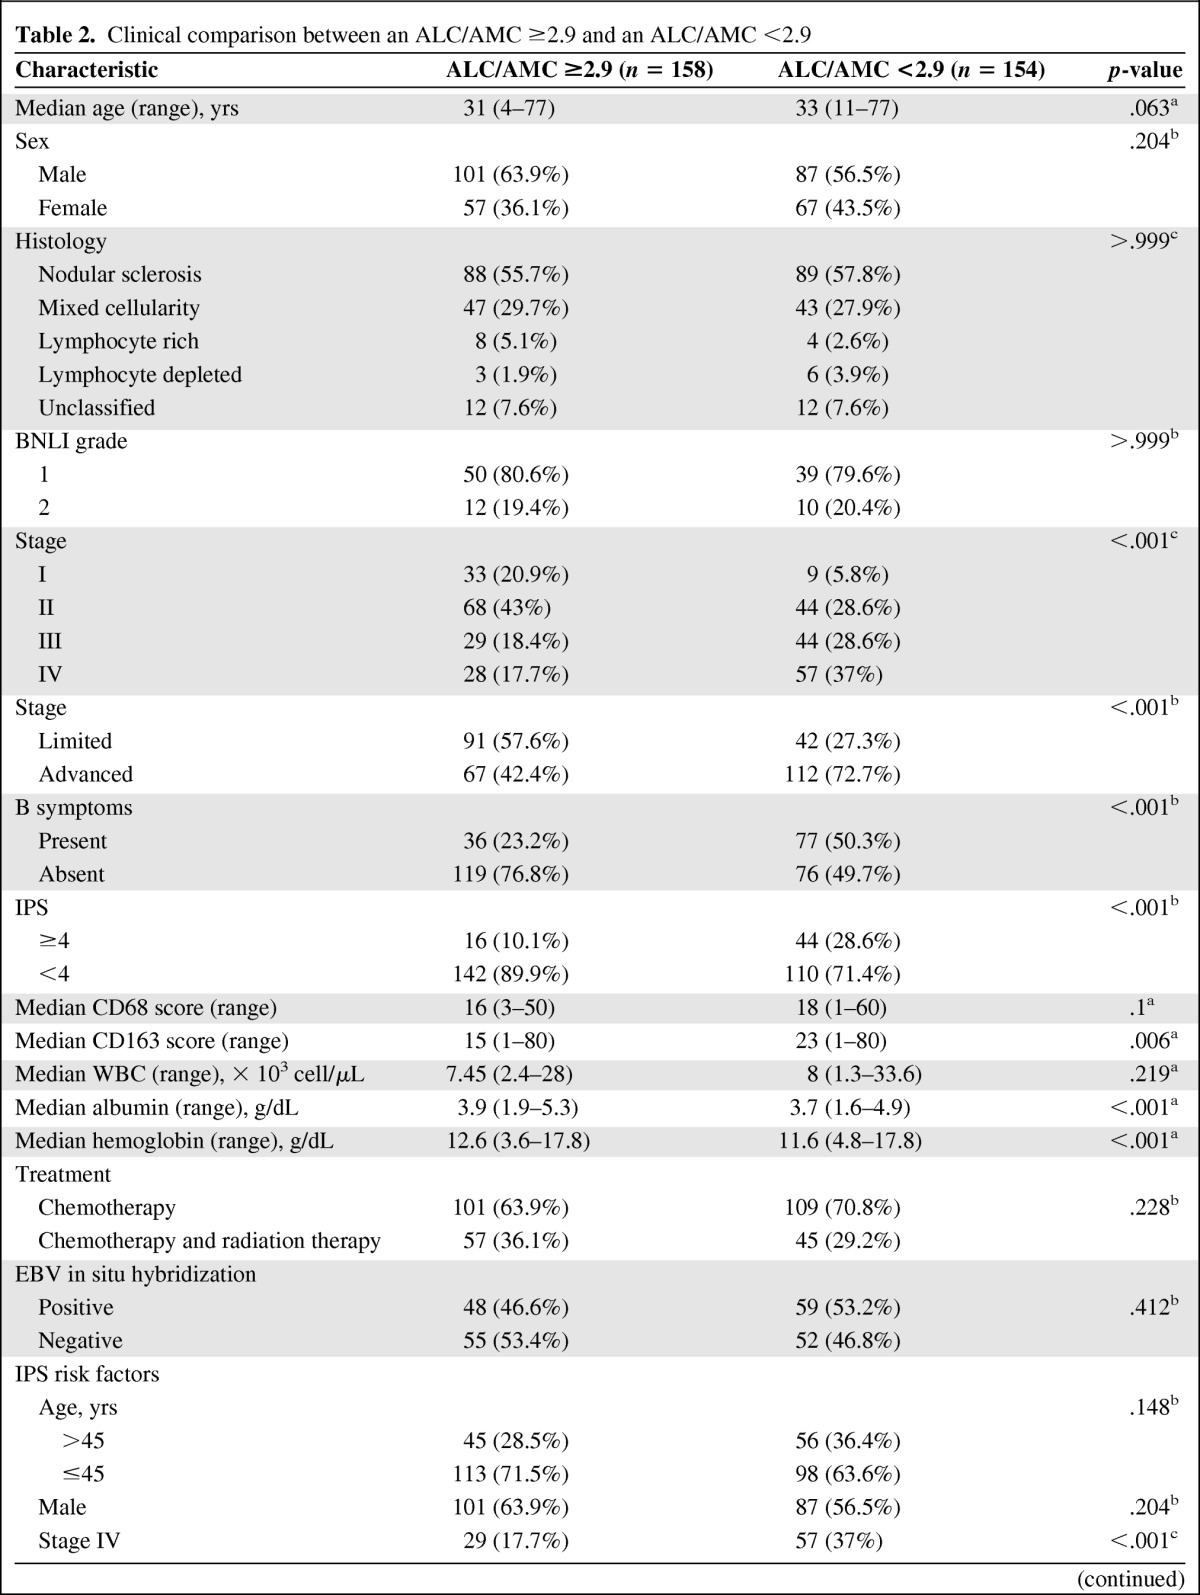
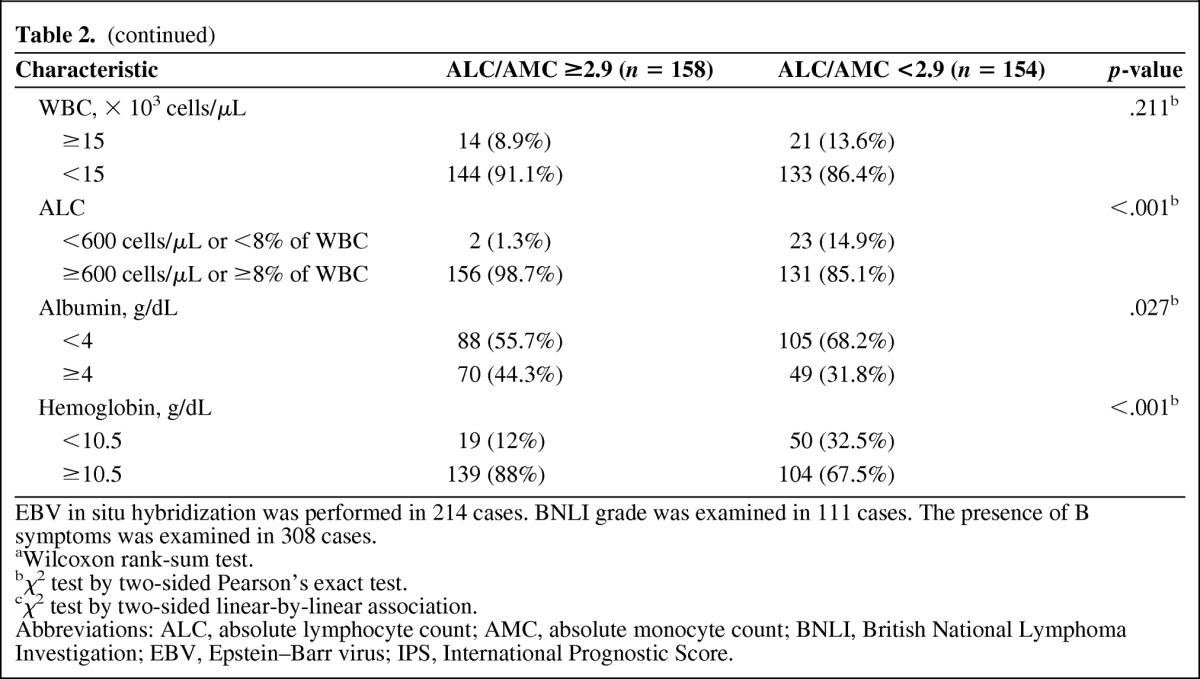
EBV in situ hybridization was performed in 214 cases. BNLI grade was examined in 111 cases. The presence of B symptoms was examined in 308 cases.
aWilcoxon rank-sum test.
bχ2 test by two-sided Pearson's exact test.
cχ2 test by two-sided linear-by-linear association.
Abbreviations: ALC, absolute lymphocyte count; AMC, absolute monocyte count; BNLI, British National Lymphoma Investigation; EBV, Epstein–Barr virus; IPS, International Prognostic Score.
Prognostic Significance of the ALC, AMC, and ALC/AMC Ratio
Patients with an ALC <1,100 cells/μL had a significantly lower OS rate than those with an ALC ≥1,100 cells/μL (5-year OS rate, 77.5% versus 92.1%; p = .002) (supplemental online Fig. 1A), although the EFS rates were comparable (5-year EFS rate, 60.5% versus 64.4%; p = .35) (supplemental online Fig. 1B). An AMC <690 cells/μL, however, was not significantly associated with either the OS (5-year OS rate, 83.4% versus 88.1%; p = .208) (supplemental online Fig. 2A) or EFS (5-year EFS rate, 58.8% versus 67.1%; p = .363) (supplemental online Fig. 2B) outcome. Patients with an ALC/AMC ratio <2.9 had significantly lower OS rate than those with an ALC/AMC ratio ≥2.9 (5-year OS rate, 80.9% versus 93.2%; p = .001) (Fig. 2A); however, an ALC/AMC ratio <2.9 was not significantly associated with the EFS outcome (5-year EFS rate, 61.1% versus 68.2%; p = .313) (Fig. 2B).
Figure 2.
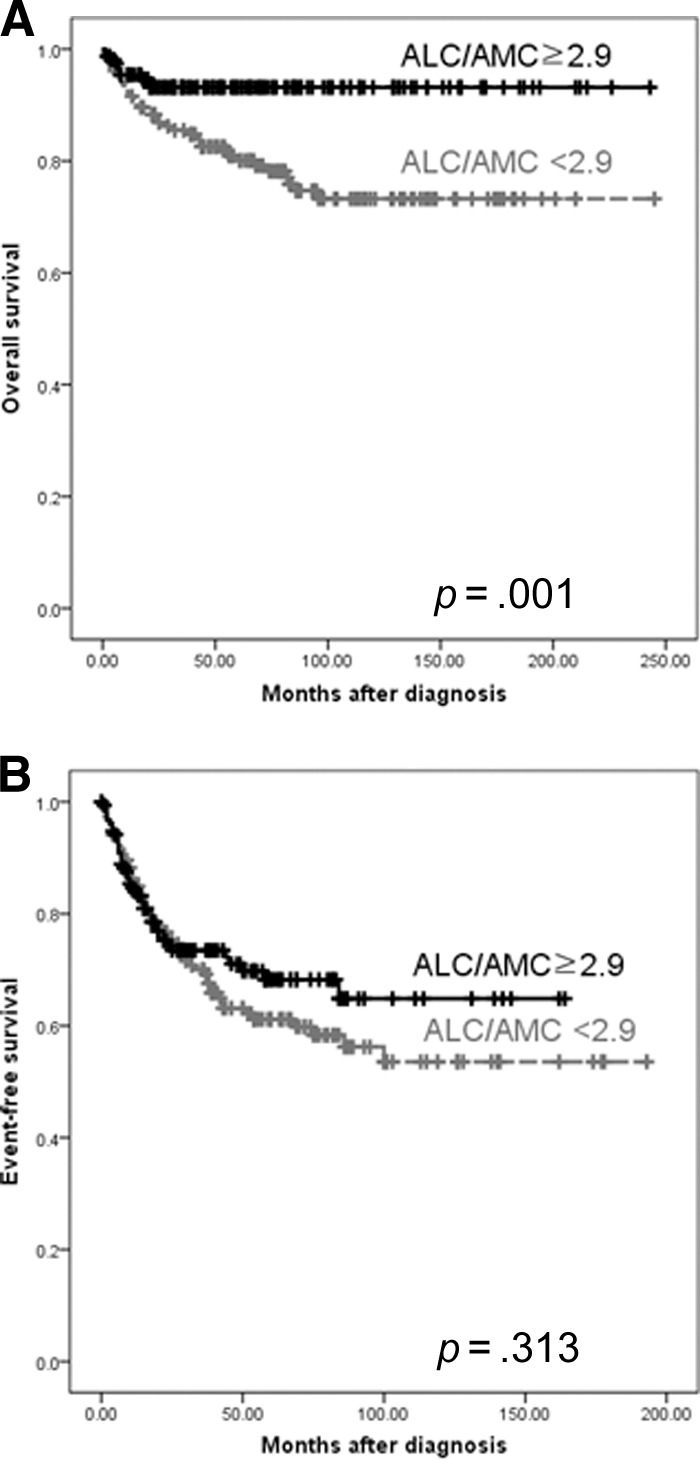
Comparison of the survival using the cutoff value of 2.9 for ALC/AMC ratio at diagnosis. (A): Overall survival and (B) even-free survival.
Abbreviations: ALC, absolute lymphocyte count; AMC, absolute monocyte count.
To evaluate the relationship between lymphopenia and monocytosis, we combined the dichotomized ALC and AMC and stratified patients into four risk groups (ALC <1,100 cells/μL and AMC ≥690 cells/μL, ALC <1,100 cells/μL and AMC <690 cells/μL, ALC ≥1,100 cells/μL and AMC ≥690 cells/μL, and ALC ≥1,100 cells/μL and AMC <690 cells/μL). In patients with an ALC <1,100, cases with an AMC ≥690 cells/μL had lower OS and EFS rates than cases with an AMC <690 cells/μL, although the difference was not statistically significant (p = .479 and p = .632, respectively) (supplemental online Fig. 3A, 3B). In patients with an ALC ≥1,100 cells/μL, cases with an AMC ≥690 cells/μL also had worse OS and EFS rates than cases with an AMC <690 cells/μL, although the difference was not statistically significant (p = .229 and p = .435, respectively) (supplemental online Fig. 3C, 3D).
On univariate analysis, both the OS and EFS outcomes were associated with male gender, age >45 years, stage 4 disease, and a hemoglobin level <10.5 g/dL. However, an ALC/AMC ratio <2.9, the presence of B symptoms, an albumin level <4 g/dL, and an IPS ≥4 were associated with the OS outcome, but not with the EFS outcome. In the multivariate analysis, an ALC/AMC ratio <2.9 proved to be an independent prognostic marker for OS outcome along with a high-risk IPS (≥4) and the presence of B symptoms (p = .039) (Table 3).
Table 3.
Univariate and multivariate analysis for OS and EFS outcomes
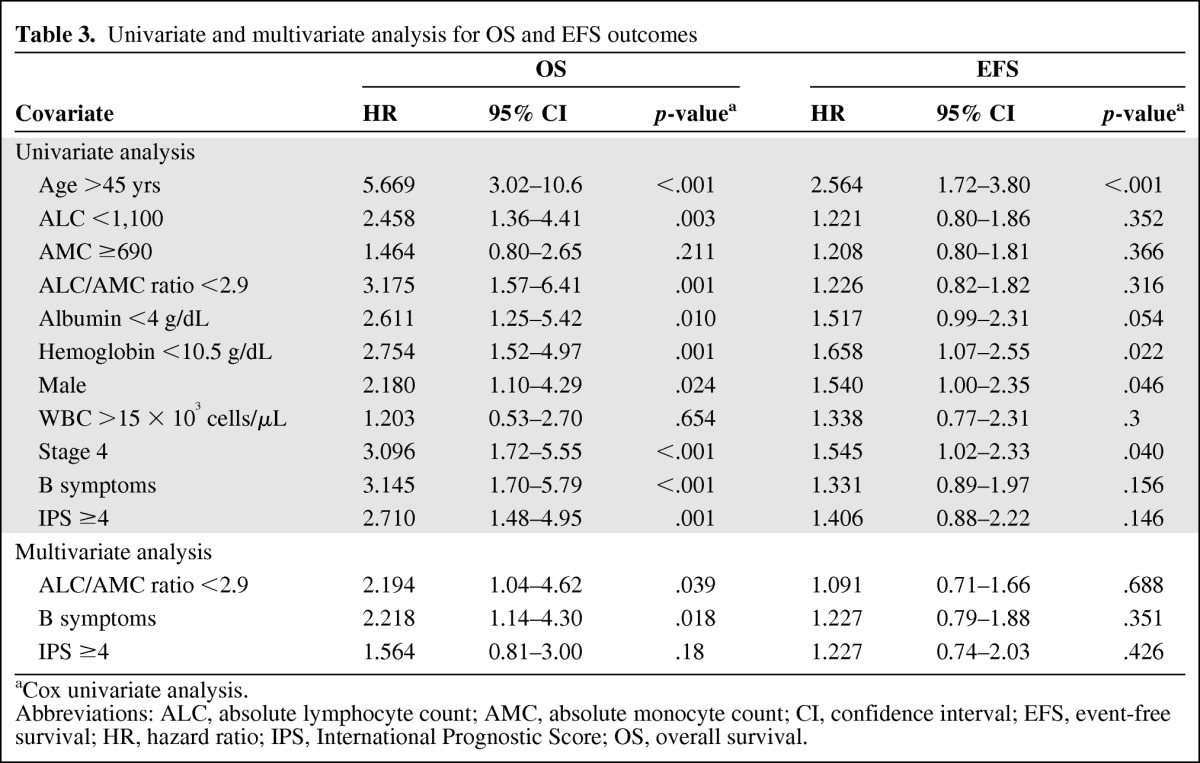
aCox univariate analysis.
Abbreviations: ALC, absolute lymphocyte count; AMC, absolute monocyte count; CI, confidence interval; EFS, event-free survival; HR, hazard ratio; IPS, International Prognostic Score; OS, overall survival.
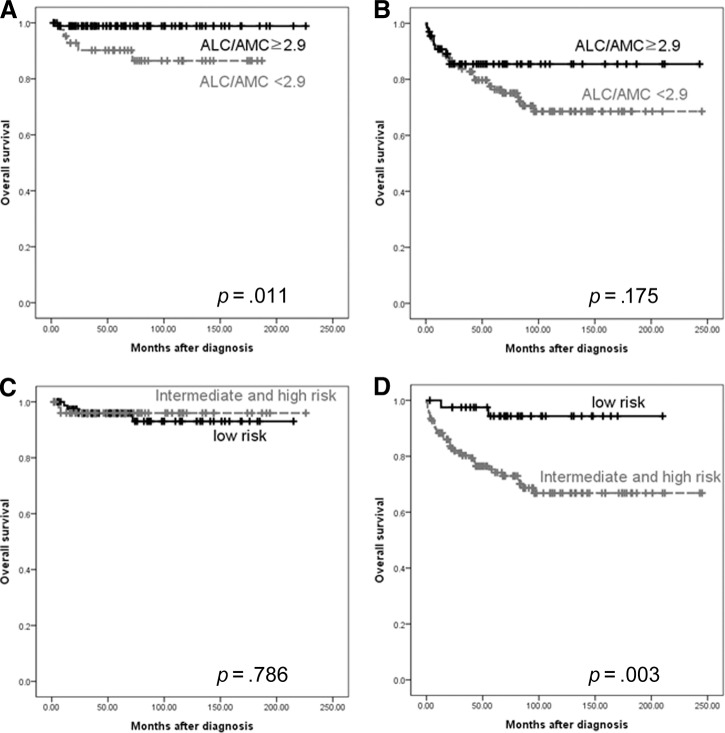
Because IPS is primarily a significant prognostic factor in patients with advanced-stage cHL [1], we compared the ALC/AMC ratio with the IPS in relation to disease stage to determine whether or not the ALC/AMC may have an advantage over the IPS. We combined the intermediate-risk IPS group with the high-risk IPS group because the number of patients with a high-risk IPS was too small for a meaningful analysis. In patients with limited-stage disease, those with an ALC/AMC ratio <2.9 had a worse OS rate than those with an ALC/AMC ratio ≥2.9 (p = .011) (Fig. 3A), whereas IPS subgroup was not significantly associated with the OS outcome (p = .786) (Fig. 3C). In patients with advanced-stage disease, those with an ALC/AMC ratio <2.9 had a trend toward worse OS rate than patients with an ALC/AMC ratio ≥2.9, but the difference was not statistically significant (p = .175) (Fig. 3B). However, high- and intermediate risk-patients identified by the IPS had an OS outcome inferior to that of patients in the low-risk group (p = .003) (Fig. 3D).
Figure 3.
Comparison of ALC/AMC ratio and International Prognostic Score in limited-stage disease (A, C) and advanced-stage disease (B, D).
Abbreviations: ALC, absolute lymphocyte count; AMC, absolute monocyte count.
No significant differences were observed between patients with an ALC/AMC ratio <2.9 and those with an ALC/AMC ratio >2.9 in terms of EBV positivity. We also performed an analysis by histologic subtype. In patients with the NS subtype, those with an ALC/AMC ratio <2.9 had a worse OS rate than those with an ALC/AMC ratio ≥2.9, although the statistical significance was marginal (5-year OS rate, 88.4% versus 96.3%; p = .062) (Fig. 4A). However, there was no difference in the EFS rates (p = .914). In patients with the MC subtype, those with an ALC/AMC ratio <2.9 had a worse OS rate than those with an ALC/AMC ratio ≥2.9 (5-year OS rate, 68.4% versus 86.6%; p = .008) (Fig. 4B). However, there was no difference in the EFS rates (p = .158).
Figure 4.
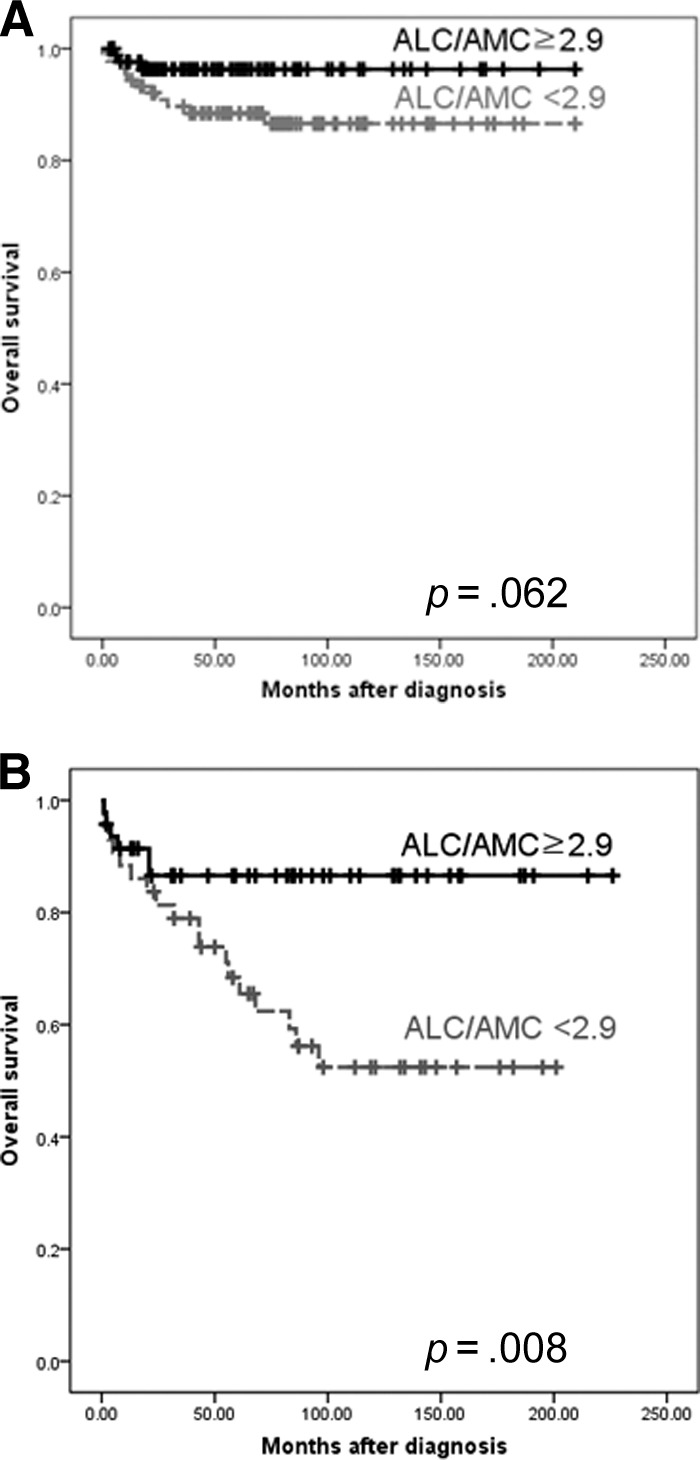
Comparison of the survival using the cutoff value of 2.9 for ALC/AMC ration at diagnosis in patients with the nodular sclerosis subtype (A) and mixed cellularity subtype (B) of Hodgkin's lymphoma.
Abbreviations: ALC, absolute lymphocyte count; AMC, absolute monocyte count.
Correlation Between Percentage of Peripheral Monocytes and TAM Content Expressed as CD68+ and CD163+ Cells in cHL Tissue
Our previous study revealed that patients with a high index of either CD68 or CD163 positivity (>20%) had significantly worse OS and EFS outcomes [7]. Therefore, we performed a correlation study of the relationship between the monocyte percentage and the density of TAMs in 144 previously reported patients [7]. There was a positive correlation between CD68 and CD163 scores in cHL tissues and the monocyte percentage in peripheral blood by Spearman correlation analysis (p = .019 and p < .001, respectively) (Fig. 5A, 5B). The correlation coefficients were 0.199 and 0.309, respectively. There was a negative correlation between the ALC/AMC ratio and CD163 score in cHL tissues (p = .006) (Fig. 5C) with a correlation coefficient of −0.234.
Figure 5.
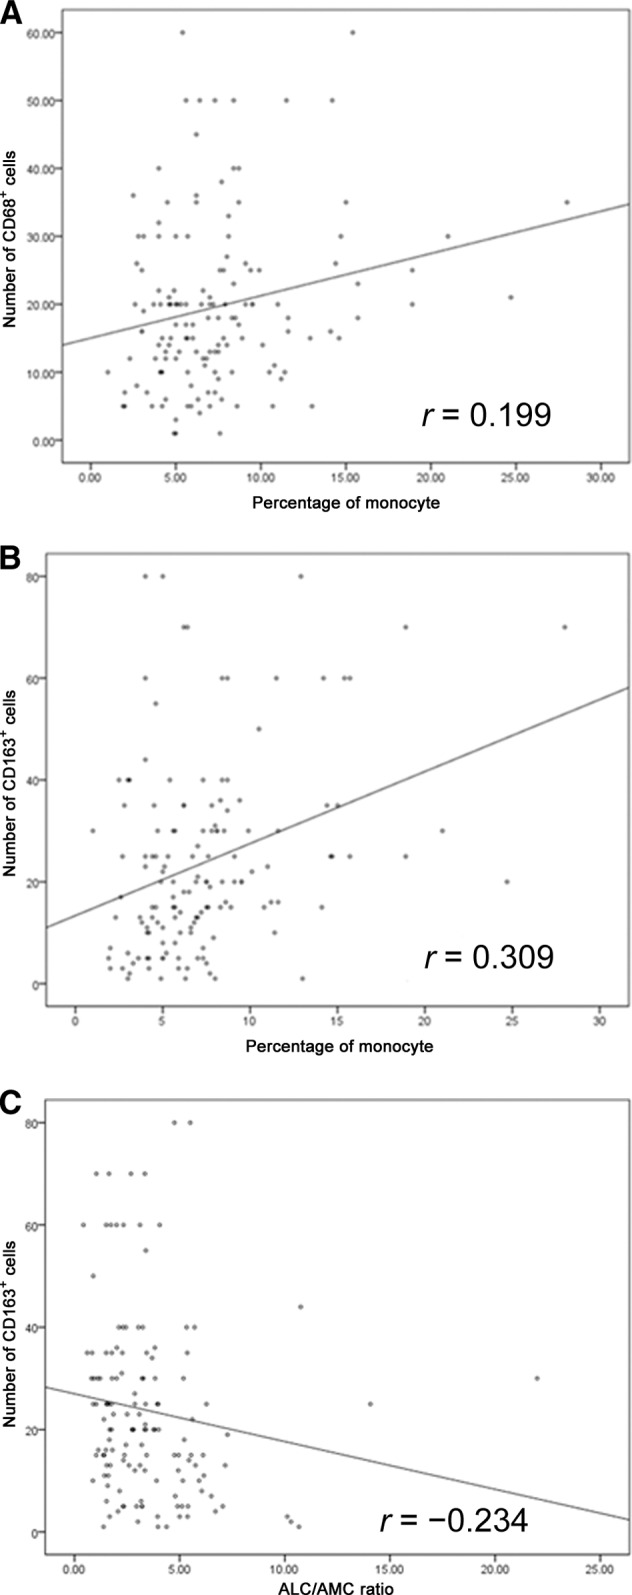
Spearman correlation between peripheral monocytes (%) and number of CD68+ cells (p = .019) (A), peripheral monocytes (%) and number of CD163+ cells (p < .001) (B), and the ALC/AMC ratio and number of CD68+ cells (p = .006) (C).
Abbreviations: ALC, absolute lymphocyte count; AMC, absolute monocyte count.
Discussion
The IPS classification is currently the standard stratification system for patients with cHL prior to any treatment [1]. Gene-expression profiles of tumor tissue have also been shown to have a prognostic impact [5, 18–20]. However, neither of these prognostic models takes into consideration the role of host immunity (i.e., the ALC) and the microenvironment produced by the tumor (i.e., the AMC). The aim of the present study was to examine the prognostic significance of the ALC/AMC ratio at diagnosis and its relationship with TAMs in lesional tissues in patients with cHL, two parameters that reflect the tumor microenvironment and host immunity. Peripheral monocytosis has been associated with a poor prognosis in patients with lymphomas as well as those with solid tumors [21–23]. Myeloid-lineage cells may promote tumorigenesis through immunosuppression and the promotion of the tumor vasculature required for tumor growth and progression [24, 25]. TAMs are a source of vascular endothelial growth factor (VEGF)-A, promoting tumor angiogenesis [24, 25]. TAMs also secrete matrix metalloproteinase 9, facilitating liberation of VEGF from the extracellular matrix [26, 27].
In our study, univariate analysis revealed the prognostic significance of lymphocytopenia but not monocytosis. However, the difference in the monocyte count may also have been intricately involved with prognosis. First, an attempt to combine the dichotomized ALC and AMC more accurately reclassified patients into high- and low-risk strata according to their AMC. Second, multivariate analysis showed the independence of the ALC/AMC ratio, although the AMC was not an independent prognostic factor.
In the multivariate analysis, a low ALC/AMC ratio was an independent prognostic marker for OS outcome (p = .039), in line with a previous study by Porrata et al. [15], although the cutoff value was different, possibly reflecting the difference in population. In our study, however, a low ALC/AMC ratio was not significantly associated with the EFS outcome. The reason why the effect of the ALC/AMC ratio is greater for the OS outcome than for the EFS outcome is unclear, although one explanation could be that patients with an ALC/AMC ratio <2.9 are more difficult to salvage after treatment failure or relapse. Only 10 of 42 patients with an ALC/AMC ratio ≥2.9 (23.8%) expired after treatment failure or relapse, whereas 35 of 58 patients with an ALC/AMC ratio <2.9 (60.3%) expired. This suggests that patients with an ALC/AMC ratio <2.9 may be more resistant to salvage treatment.
In our correlation analysis with TAMs, the ALC/AMC ratio and the monocyte percentage of the differential count were correlated with the TAM content. Here, the CD163 index had a better correlation with the ALC/AMC ratio and monocyte percentage than did the CD68 index. Although the heterogeneity of TAM expression with regional variation in histological sections may be responsible for this difference [28, 29], this also suggests that CD163 may be a superior marker of TAMs because of its higher specificity for the monocyte/macrophage lineage than CD68 [30].
Regarding histologic subtypes, an ALC/AMC ratio <2.9 was associated with a significantly poorer OS rate in patients with the NS and MC subtypes. However, BNLI grade was not prognostic for the OS outcome (data not shown), which is consistent with results from another Asian study [31]. Previous studies on BNLI grading have yielded contradictory results [32–39].
Our study has several novel findings. First, this study is the first to correlate the peripheral blood monocyte count and ALC/AMC ratio with the TAM count in corresponding histological sections for each patient. The result showed correlation between the ALC/AMC ratio and peripheral blood monocyte percentage, but no correlation with the AMC, which suggests a complex relationship between the AMC and the density of TAMs. Secondly, the ALC/AMC ratio was shown to have a prognostic role in patient with cHL with limited-stage disease. This issue deserves further study in a larger population. The limitation of this study includes the retrospective nature of the study design, short follow-up period, and relatively small sample size of patients.
In conclusion, our study suggests prognostic utility for the ALC/AMC ratio in cHL patients and supports the prognostic relevance of host immunity and the tumor-associated microenvironment in clinical outcomes in cHL patients. Although some correlation was observed among the ALC/AMC ratio, peripheral blood monocyte percentage, and TAM content, the ALC/AMC ratio offers new information about the risk for a patient with cHL, suggesting a promising role when added to the armamentarium of TAMs and the IPS in the stratification of cHL patients. The ALC/AMC ratio prognostic score, obtained from a CBC at diagnosis, is simple, widely available, and easy to use in clinical practice. In terms of the value per cost, the ALC/AMC ratio will probably be one of the most inexpensive tests that may be used as a predictive model in cancer. Further studies, including prospective clinical trials, are required to investigate the effect of the ALC/AMC ratio on clinical outcomes, and to confirm the present findings.
See www.TheOncologist.com for supplemental material available online.
Supplementary Material
Acknowledgment
Young Wha Koh and Hyo Jeong Kang contributed equally to this work. This study was supported by a grant (2011-090) from the Asan Institute for Life Sciences, Seoul, Korea.
Author Contributions
Conception/Design: Jooryung Huh, Young Wha Koh, Hyo Jeong Kang, Chansik Park, Dok Hyun Yoon, Cheolwon Suh
Provision of study material or patients: Jooryung Huh, Young Wha Koh, Hyo Jeong Kang
Collection and/or assembly of data: Jooryung Huh, Young Wha Koh, Hyo Jeong Kang, Shin Kim, Heounjeong Go, Ji Eun Kim, Chul-Woo Kim
Data analysis and interpretation: Jooryung Huh, Young Wha Koh, Hyo Jeong Kang
Manuscript writing: Jooryung Huh, Young Wha Koh, Hyo Jeong Kang
Final approval of manuscript: Jooryung Huh, Young Wha Koh, Hyo Jeong Kang, Chansik Park, Dok Hyun Yoon
References
- 1.Hasenclever D, Diehl V. A prognostic score for advanced Hodgkin's disease. International Prognostic Factors Project on Advanced Hodgkin's Disease. N Engl J Med. 1998;339:1506–1514. doi: 10.1056/NEJM199811193392104. [DOI] [PubMed] [Google Scholar]
- 2.Gallamini A, Hutchings M, Rigacci L, et al. Early interim 2-[18F]fluoro-2-deoxy-D-glucose positron emission tomography is prognostically superior to international prognostic score in advanced-stage Hodgkin's lymphoma: A report from a joint Italian-Danish study. J Clin Oncol. 2007;25:3746–3752. doi: 10.1200/JCO.2007.11.6525. [DOI] [PubMed] [Google Scholar]
- 3.Schreck S, Friebel D, Buettner M, et al. Prognostic impact of tumour-infiltrating Th2 and regulatory T cells in classical Hodgkin lymphoma. Hematol Oncol. 2009;27:31–39. doi: 10.1002/hon.878. [DOI] [PubMed] [Google Scholar]
- 4.Alvaro-Naranjo T, Lejeune M, Salvadó-Usach MT, et al. Tumor-infiltrating cells as a prognostic factor in Hodgkin's lymphoma: A quantitative tissue microarray study in a large retrospective cohort of 267 patients. Leuk Lymphoma. 2005;46:1581–1591. doi: 10.1080/10428190500220654. [DOI] [PubMed] [Google Scholar]
- 5.Steidl C, Lee T, Shah SP, et al. Tumor-associated macrophages and survival in classic Hodgkin's lymphoma. N Engl J Med. 2010;362:875–885. doi: 10.1056/NEJMoa0905680. [DOI] [PMC free article] [PubMed] [Google Scholar]
- 6.Kamper P, Bendix K, Hamilton-Dutoit S, et al. Tumor-infiltrating macrophages correlate with adverse prognosis and Epstein-Barr virus status in classical Hodgkin's lymphoma. Haematologica. 2011;96:269–276. doi: 10.3324/haematol.2010.031542. [DOI] [PMC free article] [PubMed] [Google Scholar]
- 7.Yoon DH, Koh YW, Kang HJ, et al. CD68 and CD163 as prognostic factors for Korean patients with Hodgkin lymphoma. Eur J Haematol. 2012;88:292–305. doi: 10.1111/j.1600-0609.2011.01731.x. [DOI] [PubMed] [Google Scholar]
- 8.Zaki MA, Wada N, Ikeda J, et al. Prognostic implication of types of tumor-associated macrophages in Hodgkin lymphoma. Virchows Arch. 2011;459:361–366. doi: 10.1007/s00428-011-1140-8. [DOI] [PubMed] [Google Scholar]
- 9.Tzankov A, Matter MS, Dirnhofer S. Refined prognostic role of CD68-positive tumor macrophages in the context of the cellular micromilieu of classical Hodgkin lymphoma. Pathobiology. 2010;77:301–308. doi: 10.1159/000321567. [DOI] [PubMed] [Google Scholar]
- 10.Jakovic LR, Mihaljevic BS, Perunicic Jovanovic MD, et al. The prognostic relevance of tumor associated macrophages in advanced stage classical Hodgkin lymphoma. Leuk Lymphoma. 2011;52:1913–1919. doi: 10.3109/10428194.2011.580026. [DOI] [PubMed] [Google Scholar]
- 11.Dave SS, Wright G, Tan B, et al. Prediction of survival in follicular lymphoma based on molecular features of tumor-infiltrating immune cells. N Engl J Med. 2004;351:2159–2169. doi: 10.1056/NEJMoa041869. [DOI] [PubMed] [Google Scholar]
- 12.Lamagna C, Aurrand-Lions M, Imhof BA. Dual role of macrophages in tumor growth and angiogenesis. J Leukoc Biol. 2006;80:705–713. doi: 10.1189/jlb.1105656. [DOI] [PubMed] [Google Scholar]
- 13.Shivakumar L, Ansell S. Targeting B-lymphocyte stimulator/B-cell activating factor and a proliferation-inducing ligand in hematologic malignancies. Clin Lymphoma Myeloma. 2006;7:106–108. doi: 10.3816/CLM.2006.n.046. [DOI] [PubMed] [Google Scholar]
- 14.Wilcox RA, Wada DA, Ziesmer SC, et al. Monocytes promote tumor cell survival in T-cell lymphoproliferative disorders and are impaired in their ability to differentiate into mature dendritic cells. Blood. 2009;114:2936–2944. doi: 10.1182/blood-2009-05-220111. [DOI] [PMC free article] [PubMed] [Google Scholar]
- 15.Porrata LF, Ristow K, Colgan JP, et al. Peripheral blood lymphocyte/monocyte ratio at diagnosis and survival in classical Hodgkin's lymphoma. Haematologica. 2012;97:262–269. doi: 10.3324/haematol.2011.050138. [DOI] [PMC free article] [PubMed] [Google Scholar]
- 16.Huh J, Cho K, Heo DS, et al. Detection of Epstein-Barr virus in Korean peripheral T-cell lymphoma. Am J Hematol. 1999;60:205–214. doi: 10.1002/(sici)1096-8652(199903)60:3<205::aid-ajh7>3.0.co;2-j. [DOI] [PubMed] [Google Scholar]
- 17.Tzankov A, Zlobec I, Went P, et al. Prognostic immunophenotypic biomarker studies in diffuse large B cell lymphoma with special emphasis on rational determination of cut-off scores. Leuk Lymphoma. 2010;51:199–212. doi: 10.3109/10428190903370338. [DOI] [PubMed] [Google Scholar]
- 18.Devilard E, Bertucci F, Trempat P, et al. Gene expression profiling defines molecular subtypes of classical Hodgkin's disease. Oncogene. 2002;21:3095–3102. doi: 10.1038/sj.onc.1205418. [DOI] [PubMed] [Google Scholar]
- 19.Sánchez-Aguilera A, Montalbán C, de la Cueva P, et al. Tumor microenvironment and mitotic checkpoint are key factors in the outcome of classic Hodgkin lymphoma. Blood. 2006;108:662–668. doi: 10.1182/blood-2005-12-5125. [DOI] [PubMed] [Google Scholar]
- 20.Chetaille B, Bertucci F, Finetti P, et al. Molecular profiling of classical Hodgkin lymphoma tissues uncovers variations in the tumor microenvironment and correlations with EBV infection and outcome. Blood. 2009;113:2765–3775. doi: 10.1182/blood-2008-07-168096. [DOI] [PubMed] [Google Scholar]
- 21.Schmidt H, Bastholt L, Geertsen P, et al. Elevated neutrophil and monocyte counts in peripheral blood are associated with poor survival in patients with metastatic melanoma: A prognostic model. Br J Cancer. 2005;93:273–278. doi: 10.1038/sj.bjc.6602702. [DOI] [PMC free article] [PubMed] [Google Scholar]
- 22.Jensen TO, Schmidt H, Młler HJ, et al. Macrophage markers in serum and tumor have prognostic impact in American Joint Committee on Cancer stage I/II melanoma. J Clin Oncol. 2009;27:3330–3337. doi: 10.1200/JCO.2008.19.9919. [DOI] [PubMed] [Google Scholar]
- 23.Dai F, Liu L, Che G, et al. The number and microlocalization of tumor-associated immune cells are associated with patient's survival time in non-small cell lung cancer. BMC Cancer. 2010;10:220. doi: 10.1186/1471-2407-10-220. [DOI] [PMC free article] [PubMed] [Google Scholar]
- 24.Tsutsumi C, Sonoda KH, Egashira K, et al. The critical role of ocular-infiltrating macrophages in the development of choroidal neovascularization. J Leukoc Biol. 2003;74:25–32. doi: 10.1189/jlb.0902436. [DOI] [PubMed] [Google Scholar]
- 25.Oh H, Takagi H, Takagi C, et al. The potential angiogenic role of macrophages in the formation of choroidal neovascular membranes. Invest Ophthalmol Vis Sci. 1999;40:1891–1898. [PubMed] [Google Scholar]
- 26.Ahn GO, Brown JM. Matrix metalloproteinase-9 is required for tumor vasculogenesis but not for angiogenesis: Role of bone marrow-derived myelomonocytic cells. Cancer Cell. 2008;13:193–205. doi: 10.1016/j.ccr.2007.11.032. [DOI] [PMC free article] [PubMed] [Google Scholar]
- 27.Yang L, DeBusk LM, Fukuda K, et al. Expansion of myeloid immune suppressor Gr+CD11b+ cells in tumor-bearing host directly promotes tumor angiogenesis. Cancer Cell. 2004;6:409–421. doi: 10.1016/j.ccr.2004.08.031. [DOI] [PubMed] [Google Scholar]
- 28.Gordon S, Taylor PR. Monocyte and macrophage heterogeneity. Nat Rev Immunol. 2005;5:953–964. doi: 10.1038/nri1733. [DOI] [PubMed] [Google Scholar]
- 29.Mosser DM, Edwards JP. Exploring the full spectrum of macrophage activation. Nat Rev Immunol. 2008;8:958–969. doi: 10.1038/nri2448. [DOI] [PMC free article] [PubMed] [Google Scholar]
- 30.Lau SK, Chu PG, Weiss LM. CD163: A specific marker of macrophages in paraffin-embedded tissue samples. Am J Clin Pathol. 2004;122:794–801. doi: 10.1309/QHD6-YFN8-1KQX-UUH6. [DOI] [PubMed] [Google Scholar]
- 31.Asano N, Oshiro A, Matsuo K, et al. Prognostic significance of T-cell or cytotoxic molecules phenotype in classical Hodgkin's lymphoma: A clinicopathologic study. J Clin Oncol. 2006;24:4626–4633. doi: 10.1200/JCO.2006.06.5342. [DOI] [PubMed] [Google Scholar]
- 32.Haybittle JL, Hayhoe FG, Easterling MJ, et al. Review of British National Lymphoma Investigation studies of Hodgkin's disease and development of prognostic index. Lancet. 1985;1:967–972. doi: 10.1016/s0140-6736(85)91736-2. [DOI] [PubMed] [Google Scholar]
- 33.MacLennan KA, Bennett MH, Tu A, et al. Relationship of histopathologic features to survival and relapse in nodular sclerosing Hodgkin's disease. A study of 1659 patients. Cancer. 1989;64:1686–1693. doi: 10.1002/1097-0142(19891015)64:8<1686::aid-cncr2820640822>3.0.co;2-i. [DOI] [PubMed] [Google Scholar]
- 34.Wijlhuizen TJ, Vrints LW, Jairam R, et al. Grades of nodular sclerosis (NSI-NSII) in Hodgkin's disease. Are they of independent prognostic value? Cancer. 1989;63:1150–1153. doi: 10.1002/1097-0142(19890315)63:6<1150::aid-cncr2820630618>3.0.co;2-4. [DOI] [PubMed] [Google Scholar]
- 35.Ferry JA, Linggood RM, Convery KM, et al. Hodgkin disease, nodular sclerosis type. Implications of histologic subclassification. Cancer. 1993;71:457–463. doi: 10.1002/1097-0142(19930115)71:2<457::aid-cncr2820710229>3.0.co;2-u. [DOI] [PubMed] [Google Scholar]
- 36.d'Amore ES, Lee CK, Aeppli DM, et al. Lack of prognostic value of histopathologic parameters in Hodgkin's disease, nodular sclerosis type. A study of 123 patients with limited stage disease who had undergone laparotomy and were treated with radiation therapy. Arch Pathol Lab Med. 1992;116:856–861. [PubMed] [Google Scholar]
- 37.Masih AS, Weisenburger DD, Vose JM, et al. Histologic grade does not predict prognosis in optimally treated, advanced-stage nodular sclerosing Hodgkin's disease. Cancer. 1992;69:228–232. doi: 10.1002/1097-0142(19920101)69:1<228::aid-cncr2820690137>3.0.co;2-9. [DOI] [PubMed] [Google Scholar]
- 38.Hess JL, Bodis S, Pinkus G, et al. Histopathologic grading of nodular sclerosis Hodgkin's disease. Lack of prognostic significance in 254 surgically staged patients. Cancer. 1994;74:708–714. doi: 10.1002/1097-0142(19940715)74:2<708::aid-cncr2820740226>3.0.co;2-7. [DOI] [PubMed] [Google Scholar]
- 39.van Spronsen DJ, Vrints LW, Hofstra G, et al. Disappearance of prognostic significance of histopathological grading of nodular sclerosing Hodgkin's disease for unselected patients, 1972–92. Br J Haematol. 1997;96:322–327. doi: 10.1046/j.1365-2141.1997.d01-2010.x. [DOI] [PubMed] [Google Scholar]
Associated Data
This section collects any data citations, data availability statements, or supplementary materials included in this article.


