

Abstract
We make decisions about where to look approximately three times per second in normal viewing. It has been suggested that eye movements may be guided by activity in the lateral intraparietal area (LIP), which is thought to represent the relative value of objects in space. However, it is not clear how values for saccade goal selection are prioritized while free-viewing in a cluttered visual environment. To address this question, we compared the neural responses of LIP neurons in two subjects with their saccadic behavior and three estimates of stimulus value. These measures were extracted from the subjects’ performance in a visual foraging task, in which we parametrically controlled the number of objects on the screen. We found that the firing rates of LIP neurons did not correlate well with the animals’ behavior or any of our estimated measures of value. However, if the LIP activity was further normalized, it became highly correlated with the animals’ decisions. These data suggest that LIP activity does not represent value in complex environments, but that the value can easily be extracted with one further step of processing. We propose that activity in LIP represents attentional priority and that the downstream normalization of this activity is an essential process in guiding action.
Keywords: priority map, attention, visual search, parietal cortex, vision
In everyday visual behavior, we make two to three eye movements per second. For each of these, a decision must be made about where to look. These decisions are made based on the layout of the scene, the salience of various aspects of the scene, our experience, prior expectations, and often, with goals in mind (1). It is widely thought that cortical areas functioning as priority maps guide this decision process (2, 3). One of these areas, the lateral intraparietal area (LIP), is known to combine bottom-up and top-down inputs to create responses that are relative to the attentional priority of the objects in the neurons’ receptive fields (4). A major factor in attentional priority is reward, and LIP activity has been related to reward in terms of its relative desirability or subjective value (5–9). In each of these cases, the relationship was tested under highly constrained conditions in which one of two stimuli had to be chosen for an animal to get a reward at the end of the decision. However, in everyday life there are rarely only two stimuli present, and single eye movements are almost never rewarded or punished. To test whether the activity in LIP continues to correlate with relative value and, thus, can explain dynamic saccade target selection in more natural behavior, we compared the activity in LIP with the behavior of two monkeys performing a foraging task in which we parametrically controlled the number and value of items on the screen.
Results
Behavior in the Visual Foraging Task.
Two rhesus monkeys were trained to perform a visual foraging task (10, 11). In this task, the animals had to visually search through an array of distractors (+) and potential targets (T) to find the target (Fig. 1A). The target was one of the Ts; it was indistinguishable from the other Ts, but it had a reward linked to it. To get the reward the animal had to fixate the target for 500 ms. After the stimuli appeared, the monkeys were free to move their eyes to find the target within 8 s. By having multiple potential targets, the animals were forced to forage through the Ts to find the target, thereby inducing a dynamic form of visual search. Because the task did not punish the animals when they looked at distractors and they were free to forage through all of the stimuli on the screen, there were no incorrect eye movements within a trial. In this study, we parametrically varied the number of potential targets and the number of distractors, which, in effect, varied the value of each T. The total number of objects was always equal to or less than 10, the number of potential targets ranged from one to seven, and number of distractors from zero to seven.
Fig. 1.

Task and behavior. (A) Example stimulus arrangement in the foraging task, in which five potential targets (T) and five distracters (+) were presented. One T (the target) had a fluid reward linked to it, such that when the monkey looked at it for 500 ms, he obtained the reward. The stimuli were arranged so that when looking at one stimulus (small yellow circle) another stimulus was centered in the LIP neuron’s receptive field (large yellow circle). Note: the number of potential targets and distracters varied across trials. (B–E) The mean (±SEM) probability of fixating a potential target is plotted against the number of potential targets (B and C) and distractors (D and E) for monkeys D and E, respectively. The data have been compressed from 3D (plotting the probability as a function of both the number of Ts and the number of distractors) into 2D, by pooling data across the third dimension (pooling number of distractors in B and C and the number of Ts in D and E). The solid red traces represent the nonlinear fit. Blue dotted lines are 95% confidence intervals of the fit.
On any given fixation, the probability that an animal would make a saccade to fixate any T depended on the number of potential targets and the number of distractors present in the stimulus array. When more distractors were included in the array, the probability that the animals would fixate any T decreased (Fig. 1 D and E; P << 0.001, two-way ANOVAs) and, for monkey D, when more potential targets were included in the array, the animal was more likely to fixate any T (Fig. 1 B and C; P << 0.001). In both animals there was a significant interaction between the number of potential targets and the number of distractors (P ≤ 0.02). The probability of looking at any distractor was complementary to this: it increased when more distractors were presented and decreased when more targets were presented (P << 0.001).
The probability of fixating any T was considerably higher than would be expected if the animal treated Ts and distractors as being of equal worth. If the animals treated Ts and distractors as being equal and did not focus their search on potentially rewarding stimuli, then we would expect the probability of fixating any T to be very low when seven distractors were present. In these cases there were between one and three Ts present, so the probability of fixating any T should range between 0.125 and 0.30 if all stimuli were treated equally. However, in both animals the probability of fixating any T in these conditions was always significantly greater than 0.5 (one-sample t tests, P < 0.002). Thus, the animals were significantly more likely to fixate a T than a distractor.
Relationship Between LIP Responses and Behavior.
To test whether the activity in LIP could explain the animals’ saccade goal selection behavior, we recorded the responses from 95 neurons (42 from monkey D; 53 from monkeys E) in six standard conditions. In these conditions, we either presented three potential targets with zero, two, or four distractors or kept the number of objects fixed at 10, by presenting three, five, or seven potential targets with seven, five, or three distractors, respectively. In 22 sessions, trials containing all conditions were interleaved. In the remaining sessions, blocks of trials were presented in which either the number of objects or the number of potential targets remained constant. Data collected in these two ways were statistically indistinguishable and have been pooled for further analyses. All responses show the average activity in a 350-ms epoch starting 150 ms after the end of the previous saccade.
We first examined the neural activity as a function of the number of objects or the number of potential targets. On the basis of previous studies showing that LIP responses are related to the relative value of a stimulus (5, 6, 9), we expected that the response to a T would not vary when we only varied the number of distractors. However, we found that there was a significant effect of the number of objects on the response (P = 0.011, ANOVA), with responses decreasing as a function of the number of objects (Fig. 2A; P = 0.03, linear regression). This is reminiscent of the changes in response seen as the number of objects in search tasks vary (12–14) and can be explained by a normalization process within LIP (15). We also predicted that the response to a T would be significantly reduced as we increased the number of Ts and, thus, decreased the probability that each could be the target. We found a significant (P = 0.019, ANOVA) effect of the number of Ts on the response; however, the activity was not as predicted: it showed a slight increase in response as the number of Ts increased (Fig. 2B).
Fig. 2.

Neural responses in LIP. (A) Mean (±SEM) responses from all neurons across both monkeys are plotted as a function of the number of objects in the array. In each case, three potential targets were present, so the array varied as a function of the number of distractors. (B) Mean responses from all neurons across both monkeys are plotted as a function of the number of potential targets in the array, from trials in which there were always 10 objects. Note that the last point in A is the same as the first point in B. (C and D) Mean responses to a potential target are plotted against the probability of fixating any T in monkeys D and E, respectively. Each point represents response of one neuron in one condition and the animal’s probability of fixating any T in that condition in that session. (E and F) Calculated downstream responses to a potential target are plotted against the probability of fixating any T in monkeys D and E, respectively. In all panels, the solid lines are least square regression fit lines.
The neural activity in LIP did not correlate with the probability that the animal would fixate any T. Given that LIP activity did not seem to correlate with stimulus value (Fig. 2 A and B), we asked whether the activity in LIP correlated with the animals’ behavior. Specifically, we compared the mean neural response from all fixations recorded from each condition (i.e., with the same number of Ts and distractors) within a session with the mean probability that the animal would fixate any T calculated from the same condition in the same session. We found either no correlation (Fig. 2C; r = −0.13; P = 0.053, linear regression) or a weak significant correlation (Fig. 2D; r = 0.32; P << 0.001) for monkeys D and E, respectively. It is possible that the lack of a strong correlation could be due to the fact that the neurons all had different ranges of response magnitudes. To account for this, we calculated normalized firing rates, in which the response of a neuron in any condition was divided by the mean response for that neuron under all conditions. When we compared the mean normalized responses with the probability of fixating any T, we found no significant correlation for either monkey (P > 0.29, linear regressions). These results suggest that the activity in LIP does not seem to be strongly related to saccade goal selection in this task.
In the priority map model, attention is allocated to the peak of activity on the map (16, 17), which suggests that it is the relative activity rather than the absolute activity that is important (18) in guiding eye movements. Our data have implied that the actual response in LIP is inadequate to explain each animal’s performance; however, it is possible that if the activity in LIP were to be further processed, then it might explain the behavior. To test this, we created a calculated downstream response, which incorporates the activity across the entire priority map by normalizing the responses by the sum of all of the activity present in the map.
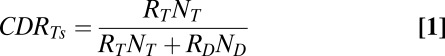 |
where CDRTs is the calculated downstream response to any T as a function of the mean response to a T ( ), the mean response to a distractor (
 ), the number of Ts (
 ), and the number of distractors (
 ). This formula can also be used to calculate the probability of looking at a single T by removing
  from the numerator.
The animals’ behavioral responses were well correlated with the calculated downstream responses. Using the same condition by condition analysis, we compared the probability that an animal would fixate any T with the calculated downstream response to any T from each condition in each session (Fig. 2 E and F). In both animals we found highly significant positive correlations (P << 0.001; r = 0.84, monkey D; r = 0.58, monkey E), showing that when the total responses to all Ts across LIP was proportionally greater than the total responses to all objects, there was a greater probability that the animal would fixate one of those Ts. This means that a low neural response to a T in LIP can still lead to a high probability of fixating a T if the response to the distractor was much lower or if there were many more Ts than distractors. This explains why there is little correlation between the actual neural response in LIP and the animal’s behavior and why an extra step of processing is necessary before the activity in LIP can be used to guide behavior.
The correlation between the calculated downstream response and the probability of fixating any T was not due to the inclusion of trials in which monkeys made a saccade into the receptive field. To test this, we excluded the neural data from all fixations that were followed by a saccade into the receptive field and found that the correlations were highly similar (Fig. S1).
Fitting the Behavioral Data to Obtain Measures of Value.
Previous studies have found that LIP activity is better related to the relative value of a stimulus (5, 6, 9) than to the animals’ choice per se; however, the correlation we show above relates the activity to the choice and not to any measure of value. To get an estimate of each animal’s value for the different classes of stimuli, we used an economics approach (justification and more information in SI Results). We found that the behavioral data for each animal could be fit using a formula similar to that used in a study relating the activity in LIP to subjective value (6):
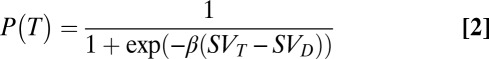 |
where  is the predicted probability of making a saccade to any T as a function of the difference between the subjective value of a T (SVT) and the subjective value of a distractor (SVD), with β as the fit parameter. Subjective value was defined using a standard hyperbolic discount function, which is often used to relate the outcome probability and delay (6, 19). However, this function can also be used in any case in which reward is delivered in various probabilities unrelated to delay (20); in our study, increasing or decreasing the number of Ts and distractors changes the probability of reward delivery across trials. Therefore, we defined subjective value as:
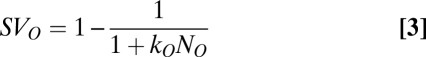 |
where  is a fit parameter for each class,
  represents the number of objects present in the class, and O represents the class (T or D). Thus, the predicted probability of making a saccade to a T (Eq. 2) varied as a function of both the number of Ts and the number of distractors.
The behavioral data were well fit by these equations (red lines, Fig. 1 B–E), using only the number of Ts, the number of distractors, and three fit parameters. For illustrative purposes, we have compressed the data from a 3D space into 2D graphs, which makes the fits look irregular but roughly demonstrates the goodness of fit because almost all of the observed data lie within the 95% confidence intervals (blue dotted lines). We can more accurately represent the goodness of fit by plotting the monkeys’ observed probability of making a saccade to any T as a function of the predicted probability based on the fit (Fig. 3). In both animals, the probabilities were highly correlated (P << 0.001; r = 0.96 and 0.98 for monkeys D and E, respectively), and the lines of best fit overlapped the unity lines. The behavior of both monkeys was fit using the same functions but with individual fit parameters for each monkey (top two rows of Table S1).
Fig. 3.

Goodness of fit of the behavioral data. Observed probability of making a saccade to a potential target is plotted against the predicted probabilities obtained from the 3D fits for monkeys D and E. Solid lines represent the least square regression lines, and dashed lines are the unity lines.
The benefit of fitting the data with these equations is that they provide estimates for three different forms of value for any number of Ts and distractors based on the animals’ behavior. Using the parameters obtained by fitting the complete data set, we were able to estimate the subjective value of a T (Eq. 3), the predicted probability of making a saccade to any T (Eq. 2), and the preference for a T over a distractor. We defined the preference as the difference in subjective value between the two stimuli:
where PRT is the preference for a T. This is the step between subjective value and the behavioral probability and is within the parentheses in the denominator in Eq. 2.
Relationship Between LIP Activity and Estimate Measures of Value.
Using the behavioral fits, we asked whether the neural activity in LIP was related to any of our three estimate measures of value: the predicted probability of fixating any T, the subjective value of a T, and the preference for a T. Specifically, we compared the mean neural response from all fixations recorded from each condition within a session with the outputs of the equations, using the three fit parameters obtained when fitting the entire set of data for that animal. Thus, when a specific number of Ts and distractors was present, the same estimate of value was always used to compare with the neural activity from different sessions.
We found that the raw and normalized responses to a T were, at best, poorly correlated with the predicted probability of making a saccade to any T, our estimate of subjective value, and our estimate of stimulus preference (Figs. S2 A–F and S3 A–F). However, after further normalizing the data we found a strong correlation. We compared the calculated downstream response (Eq. 1) with our estimate measures of value. We found that the calculated downstream responses to Ts were best correlated with our estimate of the preference for a T over a distractor (P << 0.001; r = 0.95 and 0.84 for monkeys D and E, respectively; Fig. 4 A and B). The preference, as described above (Eq. 4), represents the difference in the subjective values between Ts and distractors. The values of the two fit parameters (KT and KD; Eq. 3) were set according to the original fit to the behavioral data shown in Fig. 1 and are shown in the top two rows of Table S1. Because the preference is directly related to the probability of making a saccade to a T (Eq. 2), we found significant, albeit weaker, correlations between the calculated downstream response to a T and the predicted probability of making a saccade to a T (Figs. S2G and S3G). However, unlike previous studies (5, 6, 9), we found that the calculated downstream response to a T were not well correlated with our estimates of subjective value (Figs. S2H and S3H). We believe that this difference is due to the fact that the numbers of both classes of stimuli impacted the animals’ decisions, whereas in those previous studies, a single variable could account for the animals’ choices. Thus, as the task becomes more complex, all relevant variables are incorporated into the decision.
Fig. 4.

Relationship between the calculated downstream response and stimulus preference. (A and B) calculated downstream responses to a potential target are plotted as a function of the preference for any T for monkeys D and E, respectively. Each point represents the calculated downstream response of one neuron in one condition and the animal’s preference for any T in that condition. In all panels, the solid lines are least square regression fit lines.
Both our behavioral fits and the relationship between the fits and the calculated downstream responses continued to be robust when tested with a more complex analysis of the data. Thus far, we have described the data in terms of the number of Ts and number of distractors. However, behavior in the task is dynamic; as the animal searches through the array, stimuli can change in their behavioral importance. Once the animal has fixated a T and discovered that it is not the target, the behavioral importance of that stimulus is reduced and the number of remaining potential targets is reduced. In addition, we have previously shown that the LIP response to such a stimulus is also reduced (10). To test whether our hypothesis holds under these more complex conditions, we refit our behavioral data, dividing the stimuli into three categories: fixated Ts, potential targets (i.e., Ts that have not been fixated), and distractors. Furthermore, we separated the data into conditions according to how many of each of the three classes of stimuli were present in individual fixations and calculated the predicted probability that the animal would look at any T under these conditions. In practical terms, this means that for each fixation, the probability calculation takes into account how many stimuli are present and how many Ts the animal has already fixated. To achieve this, we added only a single new fit parameter: KfT. This fit parameter comes from the calculation of SVfT (the subjective value of a fixated T), calculated using the formula shown in Eq. 3. Thus, there are only four fit parameters—β, KT, KD, and KfT—and the predicted probability of fixating any T is calculated using the function:
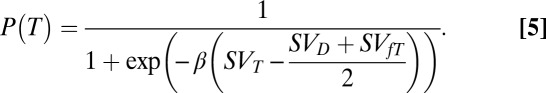 |
In this case, the preference for a potential target over the other two classes of stimuli is calculated as the difference between the subjective value for the potential target minus the mean of the subjective values of the other two objects.
This new equation fits the behavioral data well (Fig. 5 A and B; r = 0.84, P << 0.001 and r = 0.88, P << 0.001 for monkeys D and E, respectively). In fact, the behavioral probability of looking at a distractor or a fixated T could be explained using the same parameter values from this fit (see the bottom two rows of Table S1 for fit parameters), by just changing the position of the subjective values for each object within the preference part of the equation (inside the parentheses in the denominator in Eq. 5). This means that within an animal, there is a robust relationship between the desirability of each stimulus and the animal’s overall behavior. More importantly, when these same variables were used to calculate preference for each of the three stimulus conditions, the calculated downstream responses in each condition continued to be highly correlated with the appropriate preference (Fig. 5 C–H; r = 0.77, 0.59, 0.81, 0.71, 0.73, and 0.64 for C–H, respectively; P << 0.001). Thus, the three estimates of subjective value calculated using only one set of fit parameters explain all of the animal’s behavior and produce estimates of stimulus preference that are well correlated by the calculated downstream responses for each those objects. This suggests that our fitting of the behavior and the relationship between LIP activity and behavior is incredibly robust.
Fig. 5.

Behavioral and neural analyses of dynamic saccadic behavior. (A and B) Observed probability of fixating a potential target is plotted against the predicted probability obtained by fitting all of the behavioral data with the function in Eq. 5 for monkeys D and E, respectively. (C and D) Using the parameters from the behavioral fit, the calculated downstream responses to potential targets are plotted against the preference for a potential target in monkeys D and E. (E and F) calculated downstream responses to fixated Ts are plotted against the preference for a fixated T in monkeys D and E. (G and H) calculated downstream responses to distractors are plotted against the preference for a distractor in monkeys D and E. For each animal, the same parameters were used to calculate stimulus preference in all three cases.
We ran three control analyses to show that the correlations between stimulus preference and the calculated downstream response were real. First, we asked whether the correlations could have arisen from over-fitting the dataset. To test whether this was the case, we used a cross-validation test (details in SI Results) and found that fits to a subset of the data could explain the behavior in the remaining subset of the data (Fig. S4). Second, we asked whether the correlations could have arisen because the denominators in both formulae included the number of objects in each category. To show that this was not the case, we shuffled the neural data and randomly assigned them to one of the three conditions and reran the analysis. The result of this analysis showed that part of the correlation could be due to the common factors but that the strong correlations we found with the actual data could not be fully explained (Fig. S5; details in SI Results). Finally, we asked whether the correlations could have arisen because we pooled the responses from fixations when saccades were about to be made into the receptive field and from fixations when saccades were about to be made away from the receptive field. We found that this was not the case: we obtained the same correlation when only data from fixations in which the monkey was about to make a saccade away from the receptive field were used (Fig. S6).
Discussion
We found that the raw activity in LIP did not correlate with the animal’s saccade goal selection or any estimates of value obtained by fitting the behavior. However, only a single additional step of processing was necessary to transform the LIP responses into a form that correlated with behavior and estimates of value. This result suggests that multiple steps along the visual–motor pathway are necessary for value to be calculated in cluttered or complex visual scenes.
The finding that it is the calculated downstream response that best correlates with behavior illustrates the importance that normalization plays in transforming information about a particular object into motor actions concerning that object. The idea that normalization may play an important role in the cortical processing of visual information is not new (15, 21–24); however, here we demonstrate how important it is in transforming information processing from one system to another—in this case from a more visual response to a response that will be used to guide eye movements. A recent study has identified how a normalization process can explain the activity in LIP (15), and we would predict that their model would explain the raw responses we found using our task. Our calculated downstream response normalization is a process that must occur after the signal leaves LIP and suggests that normalization processes occur at each processing step in the visuo-motor transformation.
Our evidence that the calculated downstream response normalization occurs downstream from LIP comes from two facts: we found that LIP activity did not correlate with behavior or any of our estimates of value; and the calculated downstream response was best correlated with our estimate of stimulus preference and, thus, guides target selection (as shown in Eq. 2). This means that the activity in LIP acts as a precursor to responses that can guide behavior. Because the behavior exists, we suggest that the LIP activity is transformed downstream rather than being calculated independently and in parallel in other oculomotor areas.
At first glance, our results may seem to contradict previous studies that have found LIP activity to be directly related to expected or subjective value (5, 6, 9). However, our hypothesis that further normalization occurs downstream from LIP and that it is best correlated with stimulus preference can explain these differences. We have changes in both the number of stimuli and the number of potentially rewarding stimuli, which dynamically changes within a trial. This variation greatly impacts the denominator of our calculated downstream response equation, resulting in large differences in the calculated downstream responses as well as in our estimates of stimulus preference. In the more tightly controlled experiments, the denominator is more stable, resulting in LIP responses that are similar to the downstream normalized responses. Together with the fact that previous calculations of subjective or relative value are correlated to our preference measure (again because of the controlled conditions), we believe that our findings do not contradict these previous studies but add to them by explaining what occurs in more complex dynamic behavior.
In addition to being consistent with previous studies, our findings also explain several other previous results. It had been suggested that the reduction in activity in priority maps when multiple stimuli were used was related to the reduced probability that each would become a target (13, 14); however, others have suggested that although the activity does depend on how many available alternatives there are, the strongest changes seen in those previous studies were due to the introduction of more stimuli, rather than more targets per se (12, 15). Our data are consistent with this latter interpretation. We found that the raw responses varied more strongly as a function of the number of stimuli than as a function of the number of potential targets (Fig. 2 A and B). However, because we propose that the output of LIP will be further normalized downstream, the general effect of reduced responses when more stimuli are present should not have an affect on performance if all are normalized by the same denominator.
In a previous study (10), we found an unexpected result: the responses to potential targets did not increase during a trial, even as the likelihood that they would be the target increased. On the basis of previous studies showing relative value encoding in LIP (5, 9), we initially interpreted this to mean that perhaps the subjects did not maintain a moment-by-moment measure of value. However, our present findings explain this discrepancy; if the calculated downstream response is examined, then it increases as targets go from being a potential target with high activity to a seen target with low activity. Mathematically, this translates into a reduction in the denominator of the calculated downstream response function (Eq. 1), so although the response to a single potential target remains static, its calculated downstream response increases. This means that the guidance of visual search can incorporate both the reduction in reward probability at seen locations and an increase at the remaining locations by only suppressing activity at the seen location in LIP; the normalization process sorts out the remaining probabilities. It also means that the premise of inhibition of return (25, 26) truly aids in making search more efficient. Not only does decreasing the priority of already examined Ts reduce the chance that they will be refixated, but it also increases the preference for the remaining potential targets without having to actively increase their responses in earlier visual areas.
If LIP activity in complex scenes or in dynamic conditions does not directly correlate with subjective value, then what does it represent, and where could the normalization occur? We propose that LIP activity represents the attentional priority of the object within individual neurons’ receptive fields. We use the term “priority” to indicate that the response is made up of a combination of bottom-up inputs (27, 28) combined with top-down biases (4) and the term “attentional” to indicate that it drives attention—both covert (16, 29) and overt (30–32). We suggest that under more complicated conditions, attentional priority does not seem to be strongly influenced by the priority of stimuli outside of the receptive field; however, there are clearly some normalization processes occurring within LIP (15), and it is possible there is some less spatially specific inhibition as well (33). It is unclear where the normalization process we termed the calculated downstream response may occur; it could be on the way to the frontal eye field or superior colliculus (34), or at the level of the motor neurons in the brainstem nuclei.
A large open question in sensorimotor physiology asks: what are the differences among LIP, the superior colliculus, and the frontal eye field? A number of subtle but significant differences have been seen in the responses (32, 35, 36) and behavior (37, 38) during visual search and in the responses during two alternative forced-choice direction discrimination tasks (39–41). However, no clear and consistent processing differences have been identified. Our data suggest that in complex visual scenes and dynamic search, the activity in LIP is inadequate to guide eye movements and that these later areas allow for further processing, in the form of normalization, which is necessary to guide behavior. Thus, it may be that the differences among the areas can only be elucidated when more complex tasks, such as our foraging task, are used to probe the system.
Methods
Details can be found in the SI Methods. All experiments were approved by the Chancellor’s Animal Research Committee at University of California, Los Angeles as complying with the guidelines established in the Public Health Service Guide for the Care and Use of Laboratory Animals. Electrophysiological recordings were made from two rhesus monkeys, which were trained on a standard memory-guided saccade task and the foraging search task (Fig. 1A). Single-unit activity was analyzed during fixations in which there was a single object inside the receptive field. Data were aligned by the beginning of fixation, and we analyzed the mean spike rates within a 350-ms window starting 150 ms after the end of the last saccade.
Supplementary Material
Acknowledgments
We thank Mickey Goldberg for many useful discussions about the data, Behrad Noudoost and Roozbeh Kiani for their comments on an earlier version of the manuscript, and the members of the University of California, Los Angeles Division of Laboratory Animal Medicine for their superb animal care. This work was supported by a McKnight Scholar Award and by National Eye Institute Grant R01 EY019273-01.
Footnotes
The authors declare no conflict of interest.
This article is a PNAS Direct Submission.
This article contains supporting information online at www.pnas.org/lookup/suppl/doi:10.1073/pnas.1120763109/-/DCSupplemental.
References
- 1.Yarbus AL. Eye Movements and Vision. New York: Plenum Press; 1967. [Google Scholar]
- 2.Fecteau JH, Munoz DP. Salience, relevance, and firing: a priority map for target selection. Trends Cogn Sci. 2006;10:382–390. doi: 10.1016/j.tics.2006.06.011. [DOI] [PubMed] [Google Scholar]
- 3.Bisley JW, Goldberg ME. Attention, intention, and priority in the parietal lobe. Annu Rev Neurosci. 2010;33:1–21. doi: 10.1146/annurev-neuro-060909-152823. [DOI] [PMC free article] [PubMed] [Google Scholar]
- 4.Ipata AE, Gee AL, Bisley JW, Goldberg ME. Neurons in the lateral intraparietal area create a priority map by the combination of disparate signals. Exp Brain Res. 2009;192:479–488. doi: 10.1007/s00221-008-1557-8. [DOI] [PMC free article] [PubMed] [Google Scholar]
- 5.Dorris MC, Glimcher PW. Activity in posterior parietal cortex is correlated with the relative subjective desirability of action. Neuron. 2004;44:365–378. doi: 10.1016/j.neuron.2004.09.009. [DOI] [PubMed] [Google Scholar]
- 6.Louie K, Glimcher PW. Separating value from choice: Delay discounting activity in the lateral intraparietal area. J Neurosci. 2010;30:5498–5507. doi: 10.1523/JNEUROSCI.5742-09.2010. [DOI] [PMC free article] [PubMed] [Google Scholar]
- 7.Platt ML, Glimcher PW. Neural correlates of decision variables in parietal cortex. Nature. 1999;400:233–238. doi: 10.1038/22268. [DOI] [PubMed] [Google Scholar]
- 8.Seo H, Barraclough DJ, Lee D. Lateral intraparietal cortex and reinforcement learning during a mixed-strategy game. J Neurosci. 2009;29:7278–7289. doi: 10.1523/JNEUROSCI.1479-09.2009. [DOI] [PMC free article] [PubMed] [Google Scholar]
- 9.Sugrue LP, Corrado GS, Newsome WT. Matching behavior and the representation of value in the parietal cortex. Science. 2004;304:1782–1787. doi: 10.1126/science.1094765. [DOI] [PubMed] [Google Scholar]
- 10.Mirpour K, Arcizet F, Ong WS, Bisley JW. Been there, seen that: A neural mechanism for performing efficient visual search. J Neurophysiol. 2009;102:3481–3491. doi: 10.1152/jn.00688.2009. [DOI] [PMC free article] [PubMed] [Google Scholar]
- 11.Mirpour K, Ong WS, Bisley JW. Microstimulation of posterior parietal cortex biases the selection of eye movement goals during search. J Neurophysiol. 2010;104:3021–3028. doi: 10.1152/jn.00397.2010. [DOI] [PMC free article] [PubMed] [Google Scholar]
- 12.Balan PF, Oristaglio J, Schneider DM, Gottlieb J. Neuronal correlates of the set-size effect in monkey lateral intraparietal area. PLoS Biol. 2008;6:e158. doi: 10.1371/journal.pbio.0060158. [DOI] [PMC free article] [PubMed] [Google Scholar]
- 13.Basso MA, Wurtz RH. Modulation of neuronal activity by target uncertainty. Nature. 1997;389:66–69. doi: 10.1038/37975. [DOI] [PubMed] [Google Scholar]
- 14.Lee KM, Keller EL. Neural activity in the frontal eye fields modulated by the number of alternatives in target choice. J Neurosci. 2008;28:2242–2251. doi: 10.1523/JNEUROSCI.3596-07.2008. [DOI] [PMC free article] [PubMed] [Google Scholar]
- 15.Louie K, Grattan LE, Glimcher PW. Reward value-based gain control: Divisive normalization in parietal cortex. J Neurosci. 2011;31:10627–10639. doi: 10.1523/JNEUROSCI.1237-11.2011. [DOI] [PMC free article] [PubMed] [Google Scholar]
- 16.Bisley JW, Goldberg ME. Neuronal activity in the lateral intraparietal area and spatial attention. Science. 2003;299:81–86. doi: 10.1126/science.1077395. [DOI] [PubMed] [Google Scholar]
- 17.Itti L, Koch C. A saliency-based search mechanism for overt and covert shifts of visual attention. Vision Res. 2000;40:1489–1506. doi: 10.1016/s0042-6989(99)00163-7. [DOI] [PubMed] [Google Scholar]
- 18.Bisley JW, Goldberg ME. Neural correlates of attention and distractibility in the lateral intraparietal area. J Neurophysiol. 2006;95:1696–1717. doi: 10.1152/jn.00848.2005. [DOI] [PMC free article] [PubMed] [Google Scholar]
- 19.Rangel A, Camerer C, Montague PR. A framework for studying the neurobiology of value-based decision making. Nat Rev Neurosci. 2008;9:545–556. doi: 10.1038/nrn2357. [DOI] [PMC free article] [PubMed] [Google Scholar]
- 20.Rachlin H, Raineri A, Cross D. Subjective probability and delay. J Exp Anal Behav. 1991;55:233–244. doi: 10.1901/jeab.1991.55-233. [DOI] [PMC free article] [PubMed] [Google Scholar]
- 21.Ghose GM. Attentional modulation of visual responses by flexible input gain. J Neurophysiol. 2009;101:2089–2106. doi: 10.1152/jn.90654.2008. [DOI] [PMC free article] [PubMed] [Google Scholar]
- 22.Heeger DJ. Normalization of cell responses in cat striate cortex. Vis Neurosci. 1992;9:181–197. doi: 10.1017/s0952523800009640. [DOI] [PubMed] [Google Scholar]
- 23.Lee J, Maunsell JH. A normalization model of attentional modulation of single unit responses. PLoS ONE. 2009;4:e4651. doi: 10.1371/journal.pone.0004651. [DOI] [PMC free article] [PubMed] [Google Scholar]
- 24.Reynolds JH, Heeger DJ. The normalization model of attention. Neuron. 2009;61:168–185. doi: 10.1016/j.neuron.2009.01.002. [DOI] [PMC free article] [PubMed] [Google Scholar]
- 25.Klein RM. Inhibition of return. Trends Cogn Sci. 2000;4:138–147. doi: 10.1016/s1364-6613(00)01452-2. [DOI] [PubMed] [Google Scholar]
- 26.Posner MI, Rafal RD, Choate LS, J., V Inhibition of return: Neural basis and function. Cogn Neuropsychol. 1985;2:211–228. [Google Scholar]
- 27.Arcizet F, Mirpour K, Bisley JW. A pure salience response in posterior parietal cortex. Cereb Cortex. 2011;21:2498–2506. doi: 10.1093/cercor/bhr035. [DOI] [PMC free article] [PubMed] [Google Scholar]
- 28.Gottlieb JP, Kusunoki M, Goldberg ME. The representation of visual salience in monkey parietal cortex. Nature. 1998;391:481–484. doi: 10.1038/35135. [DOI] [PubMed] [Google Scholar]
- 29.Herrington TM, Assad JA. Neural activity in the middle temporal area and lateral intraparietal area during endogenously cued shifts of attention. J Neurosci. 2009;29:14160–14176. doi: 10.1523/JNEUROSCI.1916-09.2009. [DOI] [PMC free article] [PubMed] [Google Scholar]
- 30.Gnadt JW, Andersen RA. Memory related motor planning activity in posterior parietal cortex of macaque. Exp Brain Res. 1988;70:216–220. doi: 10.1007/BF00271862. [DOI] [PubMed] [Google Scholar]
- 31.Ipata AE, Gee AL, Goldberg ME, Bisley JW. Activity in the lateral intraparietal area predicts the goal and latency of saccades in a free-viewing visual search task. J Neurosci. 2006;26:3656–3661. doi: 10.1523/JNEUROSCI.5074-05.2006. [DOI] [PMC free article] [PubMed] [Google Scholar]
- 32.Thomas NW, Paré M. Temporal processing of saccade targets in parietal cortex area LIP during visual search. J Neurophysiol. 2007;97:942–947. doi: 10.1152/jn.00413.2006. [DOI] [PubMed] [Google Scholar]
- 33.Falkner AL, Krishna BS, Goldberg ME. Surround suppression sharpens the priority map in the lateral intraparietal area. J Neurosci. 2010;30:12787–12797. doi: 10.1523/JNEUROSCI.2327-10.2010. [DOI] [PMC free article] [PubMed] [Google Scholar]
- 34.Andersen RA, Asanuma C, Cowan WM. Callosal and prefrontal associational projecting cell populations in area 7A of the macaque monkey: A study using retrogradely transported fluorescent dyes. J Comp Neurol. 1985;232:443–455. doi: 10.1002/cne.902320403. [DOI] [PubMed] [Google Scholar]
- 35.Bichot NP, Schall JD. Saccade target selection in macaque during feature and conjunction visual search. Vis Neurosci. 1999;16:81–89. doi: 10.1017/s0952523899161042. [DOI] [PubMed] [Google Scholar]
- 36.McPeek RM, Keller EL. Saccade target selection in the superior colliculus during a visual search task. J Neurophysiol. 2002;88:2019–2034. doi: 10.1152/jn.2002.88.4.2019. [DOI] [PubMed] [Google Scholar]
- 37.Wardak C, Ibos G, Duhamel JR, Olivier E. Contribution of the monkey frontal eye field to covert visual attention. J Neurosci. 2006;26:4228–4235. doi: 10.1523/JNEUROSCI.3336-05.2006. [DOI] [PMC free article] [PubMed] [Google Scholar]
- 38.Wardak C, Olivier E, Duhamel JR. A deficit in covert attention after parietal cortex inactivation in the monkey. Neuron. 2004;42:501–508. doi: 10.1016/s0896-6273(04)00185-0. [DOI] [PubMed] [Google Scholar]
- 39.Ding L, Gold JI. Neural correlates of perceptual decision making before, during, and after decision commitment in monkey frontal eye field. Cereb Cortex. 2012;22:1052–1067. doi: 10.1093/cercor/bhr178. [DOI] [PMC free article] [PubMed] [Google Scholar]
- 40.Horwitz GD, Batista AP, Newsome WT. Representation of an abstract perceptual decision in macaque superior colliculus. J Neurophysiol. 2004;91:2281–2296. doi: 10.1152/jn.00872.2003. [DOI] [PubMed] [Google Scholar]
- 41.Roitman JD, Shadlen MN. Response of neurons in the lateral intraparietal area during a combined visual discrimination reaction time task. J Neurosci. 2002;22:9475–9489. doi: 10.1523/JNEUROSCI.22-21-09475.2002. [DOI] [PMC free article] [PubMed] [Google Scholar]
Associated Data
This section collects any data citations, data availability statements, or supplementary materials included in this article.