Abstract
The transcription factors aryl hydrocarbon receptor (AhR), constitutive androstane receptor (CAR), pregnane X receptor (PXR), peroxisome proliferator-activated receptor α (PPARα), and nuclear factor erythroid 2-related factor 2 (Nrf2) regulate genes encoding drug-metabolizing enzymes and transporters in livers of mice after chemical activation. However, the specificity of their transcriptional regulation has not been determined systematically in vivo. The purpose of this study was to identify genes encoding drug-metabolizing enzymes and transporters altered by chemical activators in a transcription factor-dependent manner using wild-type and transcription factor-null mice. Chemical activators were administered intraperitoneally to mice once daily for 4 days. Livers were collected 24 h after the final dose, and total RNA was isolated for mRNA quantification of cytochromes P450, NAD(P)H quinone oxidoreductase 1 (Nqo1), aldehyde dehydrogenases (Aldhs), glutathione transferases (Gsts), sulfotransferases (Sults), UDP-glucuronosyltransferases (Ugts), organic anion-transporting polypeptides (Oatps), and multidrug resistance-associated proteins (Mrps). Pharmacological activation of each transcription factor leads to mRNA induction of drug metabolic and transport genes in livers of male and female wild-type mice, but no change in null mice: AhR (Cyp1a2, Nqo1, Aldh7a1, Ugt1a1, Ugt1a6, Ugt1a9, Ugt2b35, Sult5a1, Gstm3, and Mrp4), CAR (Cyp2b10, Aldh1a1, Aldh1a7, Ugt1a1, Ugt2b34, Sult1e1, Sult3a1, Sult5a1, Papps2, Gstt1, Gsta1, Gsta4, Gstm1–4, and Mrp2–4), PXR (Cyp3a11, Ugt1a1, Ugt1a5, Ugt1a9, Gsta1, Gstm1–m3, Oatp1a4, and Mrp3), PPARα (Cyp4a14, Aldh1a1, mGst3, Gstm4, and Mrp4), and Nrf2 (Nqo1, Aldh1a1, Gsta1, Gsta4, Gstm1–m4, mGst3, and Mrp3–4). Taken together, these data reveal transcription factor specificity and overlap in regulating hepatic drug disposition genes by chemical activators. Coordinated regulation of phase I, phase II, and transport genes by activators of transcription factors can have implications in development of pharmaceuticals as well as risk assessment of environmental contaminants.
Introduction
Early work by our laboratory demonstrated that xenobiotics known to induce microsomal enzyme activity also altered the hepatic excretion of chemicals (Klaassen, 1970, 1974, 1976). Over the following years, differential expression of phase I and II drug-metabolizing enzymes and hepatobiliary transporters after chemical treatment became recognized as an important pharmacological phenomenon that contributes to changes in drug disposition. Coordinated regulation of drug-metabolizing enzymes and transporters is mediated by a number of hepatic transcription factors (Handschin and Meyer, 2003; Klaassen and Slitt, 2005; Xu et al., 2005). Transcription factor-mediated regulation of drug-metabolizing and transport genes involves the aryl hydrocarbon receptor (AhR), constitutive androstane receptor (CAR, NR1I3), pregnane X receptor (PXR, NR1I2), and peroxisome proliferator-activated receptor α (PPARα, NR1C1). These receptors (with the exception of AhR) function by heterodimerizing with the retinoid X receptor α (NR2B1). Other transcription factors involved in hepatic gene regulation include the oxidative stress sensor, nuclear factor erythroid 2-related factor 2 (Nrf2, NFE2L2).
AhR binds to xenobiotic-responsive elements and mediates the induction of cytochrome P450 (P450) 1a1 by chemicals such as 2′,3′,7′,8′-tetrachlorodibenzo-p-dioxin (TCDD) (Whitlock et al., 1989). Isoforms of the Cyp2B subfamily are associated with CAR activation (Wang and Negishi, 2003). PXR is a major chemical sensor known to induce the expression of Cyp3A enzymes. Foreign substances, such as pregnenolone-16α-carbonitrile (PCN), trigger PXR heterodimerization with RXRα and binding to its response elements in the promoter regions of genes involved in detoxification and transport (Staudinger et al., 2001a). Similar to agonists of CAR and PXR, chemical activators such as clofibrate (CFB) cause PPARα to bind to specific response elements (Dreyer et al., 1993). The Cyp4A subfamily isoforms are most sensitive to PPARα signaling (Johnson et al., 1996). Nrf2 is a transcription factor that is activated in response to electrophiles and oxidative stress. Exposure to oxidative stress or chemicals such as oltipraz (OPZ) causes Nrf2 to bind to antioxidant response elements in the regulatory regions of target genes, such as NAD(P)H:quinone oxidoreductase 1 (Nqo1), and activates transcription (Venugopal and Jaiswal, 1996; Nioi et al., 2003; Aleksunes and Manautou, 2007).
Our laboratory has used a battery of 15 chemical activators to identify hepatic phase I and II enzymes and transport genes as target genes of AhR, CAR, PXR, PPARα, and Nrf2 in male mice. For example, isoforms of the phase I enzyme aldehyde dehydrogenase (Aldh) are strongly induced by ligands of CAR, PXR, and PPARα (Alnouti and Klaassen, 2008b). Likewise, phase II enzymes including sulfotransferases (Sults), UDP-glucuronosyltransferases (Ugts), and glutathione transferases (Gsts) are increased by chemical activators of all five transcription factors (Alnouti and Klaassen, 2008a; Knight et al., 2008; Buckley and Klaassen, 2009a; Yeager et al., 2009). Evidence also suggests that transport genes including isoforms of the ATP-binding cassette (Abc) and the solute carrier (Slc) families are up- or down-regulated by chemicals that activate AhR, CAR, PXR, PPARα, and Nrf2 (Cheng et al., 2005; Maher et al., 2005; Cheng and Klaassen, 2006; Moffit et al., 2006; Klaassen and Aleksunes, 2010). These studies have primarily been performed in male wild-type C57BL/6 mice and do not account for gender differences in responsiveness nor confirm the dependence of these mRNA changes on specific transcription factors.
The extent to which phase I and II enzymes and transport genes are coordinately regulated in networks by ligand-activated transcription factors has not been explored in depth. Xenobiotics may not only act on their target receptor but also activate other transcription factors. For example, 3,3′,5,5′-tetrachloro-1,4-bis(pyridyloxy)benzene (TCPOBOP) induces Cyp2b10 as well as Cyp3a11, suggesting that this chemical may activate both CAR and PXR signaling pathways (Petrick and Klaassen, 2007). Alternatively, chemicals may be specific for a single transcription factor, and the target gene can be transcriptionally activated by multiple transcription factors. Therefore, we have developed a systematic approach to identify the in vivo target genes of AhR, CAR, PXR, PPARα, and Nrf2 in response to chemical activators. The purpose of the present study was to 1) comprehensively evaluate the transcriptional profiles of hepatic drug-metabolizing and transport genes in male and female mice in response to pharmacological activation and 2) use transcription factor-null mice to delineate the signaling pathways involved in transcriptional activation and repression. Five chemicals were selected as prototypical activators for these experiments: TCDD (AhR), TCPOBOP (CAR), PCN (PXR), CFB (PPARα), and OPZ (Nrf2). Selection of enzyme and transporter genes was based on up- or down-regulation in male wild-type mice treated with these activators in previous studies (Cheng et al., 2005; Maher et al., 2005; Alnouti and Klaassen, 2008a,b; Knight et al., 2008; Buckley and Klaassen, 2009a).
Materials and Methods
Animals.
Eight- to 10-week-old male and female C57BL/6 mice were purchased from Charles River Laboratories, Inc. (Wilmington, MA). AhR-null mice (>99% congenic for C57BL/6 background) were obtained from The Jackson Laboratory (Bar Harbor, ME) and were described previously (Schmidt et al., 1996). Breeder pairs from the CAR-null mouse line on the C57BL/6 background, engineered by Tularik, Inc. (South San Francisco, CA) as described previously (Ueda et al., 2002), were obtained from Dr. Ivan Rusyn (University of North Carolina, Chapel Hill, NC). Nrf2-null breeding pairs were obtained from Dr. Jefferson Chan (University of California, Irvine, Irvine, CA) (Chan et al., 1996) and were backcrossed into the C57BL/6 background to >99% congenicity, as determined by the speed congenics group at The Jackson Laboratory. Breeders of PPARα-null mice were originally engineered in the laboratory of Dr. Frank J. Gonzalez at the National Institutes of Health/National Cancer Institute (Bethesda, MD) (Lee et al., 1995) and backcrossed into the C57BL/6 strain (Akiyama et al., 2001). PXR-null breeder pairs were engineered and backcrossed into the C57BL/6 background (Staudinger et al., 2001a). Mice were allowed food (Teklad 8064; Harlan Teklad, Madison, WI) and water ad libitum and were acclimated to the housing facility for at least 1 week before treatment. Mice were treated intraperitoneally with either vehicle control (corn oil) or activators of AhR, CAR, Nrf2, PPARα, or PXR as detailed in Table 1. Activators and dosing regimens were selected on the basis of previous studies (Cheng et al., 2005). Mice were dosed once daily for 4 consecutive days. On day 5, livers were removed, snap-frozen in liquid nitrogen, and stored at −80°C. Groups of four to five mice were used in each treatment group, with the exception of AhR-null female mice for which only three animals were available for treatment with vehicle. The institutional animal care and use committee at the University of Kansas Medical Center approved these studies.
TABLE 1.
Dosing regimens in wild-type and transcription factor-null mice
| Compound | Transcription Factor | Dose | Vehicle | Route |
|---|---|---|---|---|
| TCDD | AhR | 40 μg/kg | Corn oil | i.p. |
| TCPOBOP | CAR | 300 μg/kg | Corn oil | i.p. |
| PCN | PXR | 200 mg/kg | Corn oil | i.p. |
| CFB | PPARα | 500 mg/kg | Corn oil | i.p. |
| OPZ | Nrf2 | 75 mg/kg | Corn oil | i.p. |
RNA Isolation and mRNA Quantification.
Total RNA was isolated using RNA-Bee reagent (Tel-Test Inc., Friendswood, TX). The concentration of total RNA in each sample was quantified spectrophotometrically at 260 nm, and purity was confirmed by 260/280 nm ratio using a Nanodrop 2000 (Thermo Fisher Scientific, Waltham, MA). The RNA integrity was assessed by visualization of 18S and 28S rRNA bands on formaldehyde-agarose gels. Hepatic mRNA expression was determined by the Quantigene Plex 2.0 Reagent System (Affymetrix Inc., Santa Clara, CA). Panomics Plex sets were used: 2.0 panels 21085 and 21086. Samples were analyzed using a Bio-Plex System Array reader (Bio-Rad Laboratories, Hercules, CA). Five hundred nanograms of total RNA were used for each Plex set. Subsequent steps have been reported previously (Aleksunes et al., 2009).
Statistical Analysis.
GraphPad Prism (version 5; GraphPad Software Inc., La Jolla, CA) was used for statistical analysis. Differences among individual groups were evaluated by one-way analysis of variance followed by Tukey's multiple comparison test. Differences were considered statistically significant at p < 0.05.
Results
Hepatic Regulation of Cytochrome P450 Enzymes and Nqo1 mRNA.
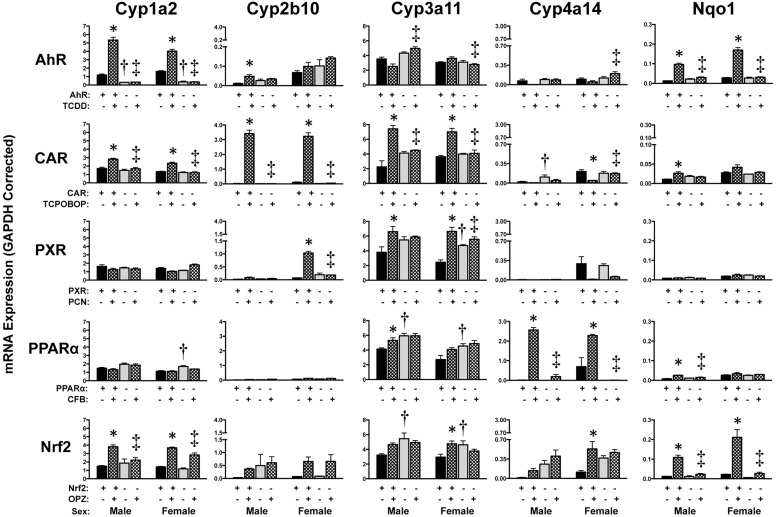
The prototypical target genes of each transcription factor were induced in male and female wild-type mice after chemical activation, with no change observed in null mice: AhR, Cyp1a2 (2.5–5-fold); CAR, Cyp2b10 (30–180-fold); PXR, Cyp3a11 (1.5–3-fold); PPARα, Cyp4a14 (3–200-fold); and Nrf2, Nqo1 (9–10-fold) (Fig. 1). The five chemical inducers were not entirely specific because they increased target genes of the other transcription factors; however, induction was often to a much lesser extent. In addition to AhR-mediated regulation, Cyp1a2 mRNA was increased approximately 2- to 2.5-fold in livers of wild-type mice treated with TCPOBOP and OPZ. Cyp2b10 mRNA was also elevated in male wild-type mice treated with TCDD (4.7-fold) and female wild-type mice treated with PCN (15-fold), however, to a lesser degree than that observed in TCPOBOP-treated wild-type mice. Cyp3a11 mRNA was also up-regulated in livers of wild-type mice, but not null mice, treated with TCPOBOP (2–3-fold), CFB (males only, 1.3-fold), and OPZ (females only, 1.6-fold). CFB and OPZ increased Cyp4a14 mRNA 3- and 5-fold in female wild-type mice, respectively, whereas TCPOBOP decreased Cyp4a14 mRNA to 22% of that of vehicle-treated female mice. In addition to OPZ, other chemical activators such as TCDD, TCPOBOP (males only), or CFB (males only), modestly increased Nqo1 mRNA in wild-type but not in AhR-, CAR-, or PPARα-null mice.
Fig. 1.
Hepatic mRNA expression of cytochrome P450 enzymes in livers of wild-type and transcription factor-null mice after chemical activation. mRNA expression was quantified using total hepatic RNA from control and inducer-treated wild-type and transcription factor-null mice on day 5. Data were normalized to glyceraldehyde 3-phosphate dehydrogenase (GAPDH) mRNA and are presented as mean relative expression ± S.E. For each graph, males are on the left and females are on the right. *, statistically significant difference (p < 0.05) compared with control mice of that genotype. †, statistically significant difference (p < 0.05) between wild-type and null control mice. ‡, statistically significant difference (p < 0.05) between wild-type and null inducer-treated mice.
In general, basal mRNA expression of cytochrome P450 enzymes was similar between wild-type and null mice with some exceptions (Fig. 1). AhR-null mice had lower basal Cyp1a2 mRNA (25% of that of wild type mice). Constitutive expression of Cyp3a11 mRNA was slightly higher (1.5–2-fold) in PXR (female mice)-, PPARα-, and Nrf2-null mice.
Hepatic Regulation of Aldehyde Dehydrogenase mRNAs.
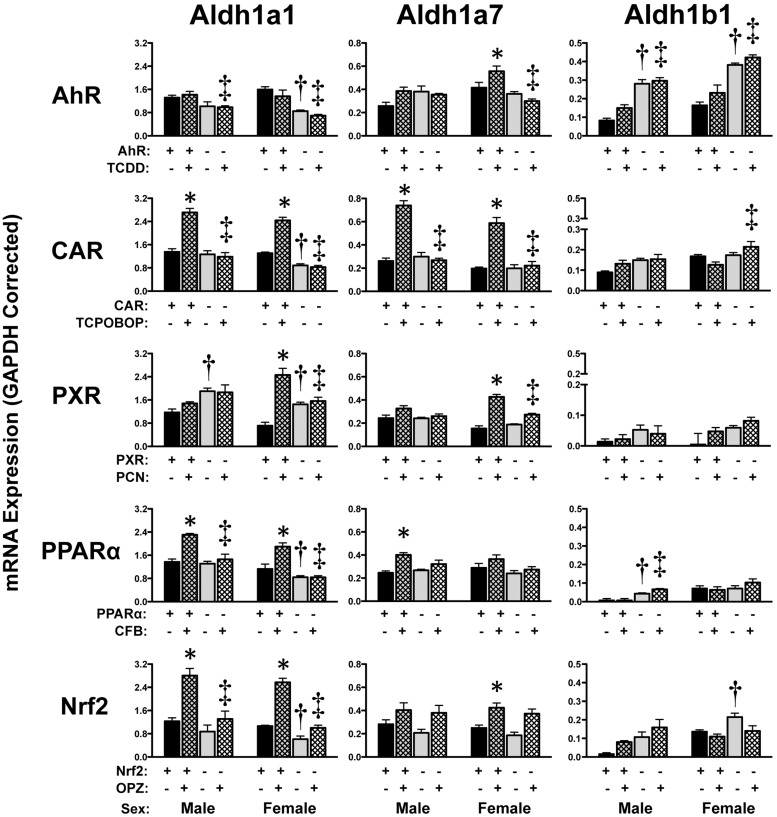
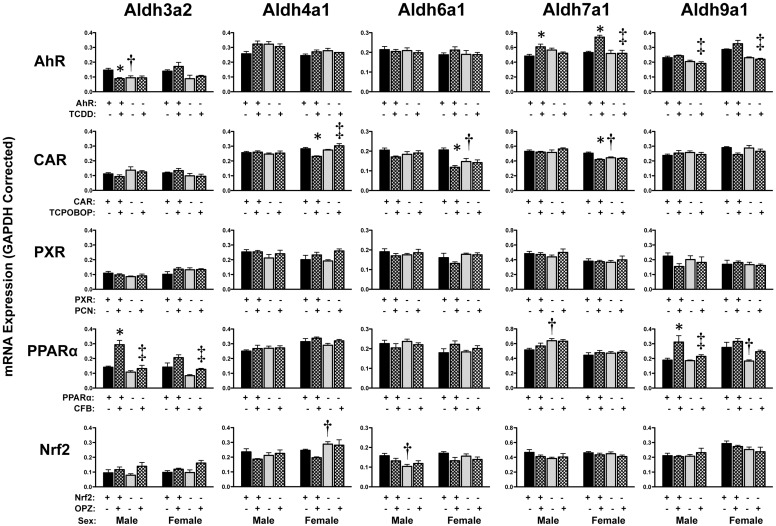
Up-regulation of Aldh1a1 mRNA was observed in livers of wild-type mice treated with TCPOBOP (male and female, 2-fold), PCN (females only, 3.5-fold), CFB (male and female, 1.6-fold), or OPZ (male and female, 2.3-fold), but not in the respective transcription factor-null mice (Fig. 2). Induction of Aldh1a7 mRNA was observed in wild-type mice given TCPOBOP (3-fold) or PCN (females only, 2.8-fold), and to a lesser extent in mice treated with TCDD (females only, 1.3-fold), CFB (males only, 1.6-fold), or OPZ (females only, 1.7-fold). Of note, Aldh1a7 mRNA also tended to be increased in Nrf2-null mice treated with OPZ, further suggesting that multiple transcription factors are involved in regulating this gene. In wild-type male mice, Aldh3a2 mRNA was modestly increased and decreased by CFB and TCDD, respectively, with no change in PPARα- and AhR-null mice (Fig. 3). The remaining Aldh members (4a1, 6a1, 7a1, and 9a1) exhibited only minor changes in livers of wild-type mice in response to TCPOBOP, TCDD, or CFB (Fig. 3).
Fig. 2.
Hepatic mRNA expression of Aldh family 1 enzymes in livers of wild-type and transcription factor-null mice after chemical activation. mRNA expression was quantified using total hepatic RNA from control and inducer-treated wild-type and transcription factor-null mice on day 5. Data were normalized to glyceraldehyde 3-phosphate dehydrogenase (GAPDH) mRNA and are presented as mean relative expression ± S.E. For each graph, males are on the left and females are on the right. *, statistically significant difference (p < 0.05) compared with control mice of that genotype. †, statistically significant difference (p < 0.05) between wild-type and null control mice. ‡, statistically significant difference (p < 0.05) between wild-type and null inducer-treated mice.
Fig. 3.
Hepatic mRNA expression of Aldh family 3 to 9 enzymes in livers of wild-type and transcription factor-null mice after chemical activation. mRNA expression was quantified using total hepatic RNA from control and inducer-treated wild-type and transcription factor-null mice on day 5. Data were normalized to glyceraldehyde 3-phosphate dehydrogenase (GAPDH) mRNA and are presented as mean relative expression ± S.E. For each graph, males are on the left and females are on the right. *, statistically significant difference (p < 0.05) compared with control mice of that genotype. †, statistically significant difference (p < 0.05) between wild-type and null control mice. ‡, statistically significant difference (p < 0.05) between wild-type and null inducer-treated mice.
Compared with vehicle-treated wild-type mice, the constitutive mRNA expression of Aldh1a1 and Aldh1b1 was elevated in PXR- and AhR-null mice, respectively (Fig. 2). A variety of other Aldh isoforms were also differentially expressed in control wild-type and transcription factor-null mice in one gender or the other. It should be noted that Aldh2, 3a1, and 8a1 are largely unchanged by activator treatment (Alnouti and Klaassen, 2008b) and were excluded from the present study.
Hepatic Regulation of UDP-Glucuronyltransferase mRNAs.
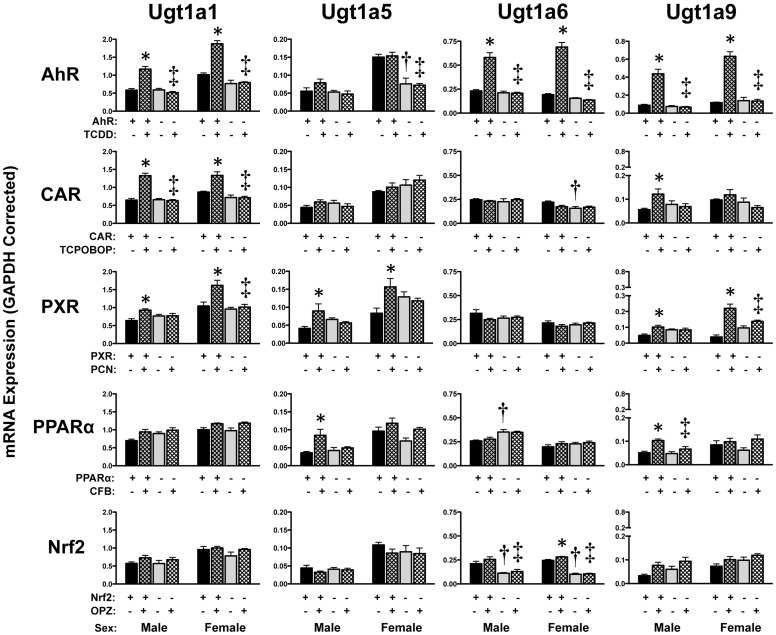
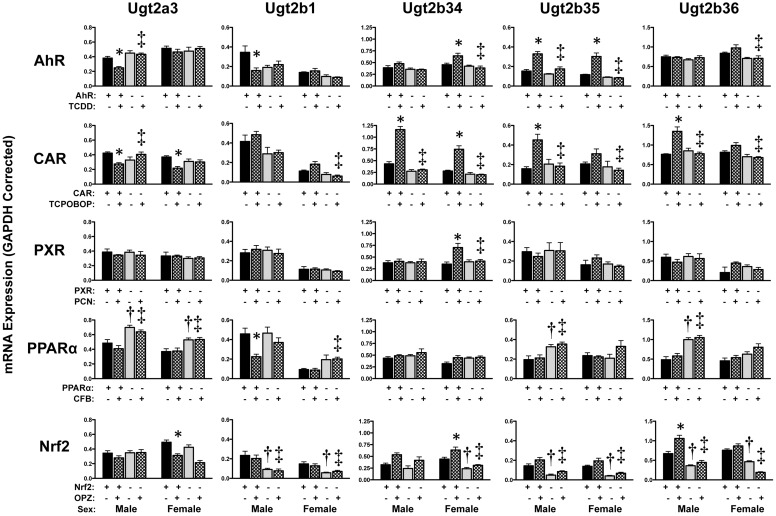
Hepatic Ugt expression was inducible (Figs. 4 and 5). TCDD increased Ugt1a1, 1a6, 1a9, 2b34 (females only), and 2b35 mRNA by 2- to 5-fold in wild-type but not in AhR-null mice. Ugt1a1 and Ugt2b34 mRNA levels were elevated in both male and female wild-type mice treated with TCPOBOP, with no change observed in CAR-null mice. Of interest, TCPOBOP induced mRNA expression of Ugt1a9, 2b35, and 2b36 in male mice only. Activation of PXR with PCN increased hepatic Ugt1a1, 1a5, and 1a9 mRNAs in both genders of wild-type but not PXR-null mice. CFB treatment caused slight increases in Ugt1a5 and Ugt1a9 mRNA levels in male mice only. OPZ increased mRNA expression of Ugt2b34 (females only, 1.4-fold) and Ugt2b36 (males only, 1.6-fold) in wild-type but not Nrf2-null mice.
Fig. 4.
Hepatic mRNA expression of Ugt family 1 enzymes in livers of wild-type and transcription factor-null mice after chemical activation. mRNA expression was quantified using total hepatic RNA from control- and inducer-treated wild-type and transcription factor-null mice on day 5. Data were normalized to glyceraldehyde 3-phosphate dehydrogenase (GAPDH) mRNA and are presented as mean relative expression ± S.E. For each graph, males are on the left and females are on the right. *, statistically significant differences (p < 0.05) compared with control mice of that genotype. †, statistically significant difference (p < 0.05) between wild-type and null control mice. ‡, statistically significant difference (p < 0.05) between wild-type and null inducer-treated mice.
Fig. 5.
Hepatic mRNA expression of Ugt family 2 enzymes in livers of wild-type and transcription factor-null mice after chemical activation. mRNA expression was quantified using total hepatic RNA from control- and inducer-treated wild-type and transcription factor-null mice on day 5. Data were normalized to glyceraldehyde 3-phosphate dehydrogenase (GAPDH) mRNA and are presented as mean relative expression ± S.E. For each graph, males are on the left and females are on the right. *, statistically significant differences (p < 0.05) compared with control mice of that genotype. †, statistically significant difference (p < 0.05) between wild-type and null control mice. ‡, statistically significant difference (p < 0.05) between wild-type and null inducer-treated mice.
Down-regulation of Ugt2a3 in response to TCDD (males only), TCPOBOP, or OPZ (females only) was also observed in wild-type mice. Whereas Ugt2a3 mRNA was unchanged in AhR-null and PPARα-null mice, it was reduced in Nrf2-null mice administered the chemical activator, suggesting Nrf2-independent regulation of this gene. In addition, Ugt2b1 mRNA was reduced approximately 40% in livers of male wild-type mice treated with TCDD or CFB.
Transcription factor-null mice treated with vehicle only demonstrated some differences in basal Ugt mRNA expression (Figs. 4 and 5). For example, Ugt2a3 mRNA was elevated in male and female PPARα-null mice, whereas Ugt1a6 and Ugt2b1 were reduced in Nrf2-null mice. Additional gender-specific basal differences were also noted for the other Ugt isoforms. Ugt1a2, 1a7, 1a10, and 3a1/2 were unchanged by these chemical activators (Buckley and Klaassen, 2009a) and were not included in the present study.
Hepatic Regulation of Sulfotransferase mRNAs.
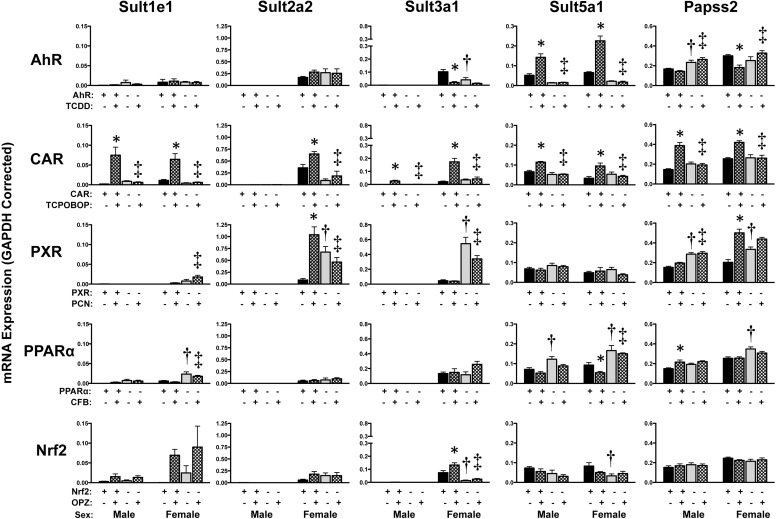
Similar to findings in a prior publication, mRNA of most Sult isoforms was higher in female than in male mice (Fig. 6) (Alnouti and Klaassen, 2006). In addition to Sult isoforms, mRNA expression of 3′-phosphoadenosine 5′-phosphosulfate synthase 2 (Papss2), which generates the sulfate source for Sult enzymes, was also quantified. TCPOBOP increased mRNA expression of all Sult enzymes as well as Papss2 in wild-type but not in CAR-null mice. Likewise, other chemical activators elevated Sult mRNA including Sult2a2 (PCN, females, 1.8-fold), Sult3a1 (OPZ, females, 1.8-fold), Sult5a1 (TCDD, 3-fold), and Papss2 (PCN, females, 2.5-fold, and CFB, males, 1.4-fold) in livers of wild-type mice, with little to no change in transcription factor-null mice. Down-regulation of Sult3a1 (20% of control) or Sult5a1 (58% of control) was observed in wild-type female mice in response to TCDD or CFB administration, respectively.
Fig. 6.
Hepatic mRNA expression of Sult and Papss2 enzymes in livers of wild-type and transcription factor-null mice after chemical activation. mRNA expression was quantified using total hepatic RNA from control- and inducer-treated wild-type and transcription factor-null mice on day 5. Data were normalized to glyceraldehyde 3-phosphate dehydrogenase (GAPDH) mRNA and are presented as mean relative expression ± S.E. For each graph, males are on the left and females are on the right. *, statistically significant differences (p < 0.05) compared with control mice of that genotype. †, statistically significant difference (p < 0.05) between wild-type and null control mice. ‡, statistically significant difference (p < 0.05) between wild-type and null inducer-treated mice.
Compared with wild-type mice, some Sult genes were differentially expressed in vehicle-treated transcription factor-null mice. Of note, Sult5a1 and Papss2 mRNA were elevated in PPARα- and PXR-null mice, respectively. The majority of other basal differences in Sult isoforms in the various transcription factor-null mice were observed in female mice. Sult1a1, 1b1, 1c1, 1c2, 1d1, 2b1, and 4a1 are largely unchanged by these microsomal activators (Alnouti and Klaassen, 2008a) and were excluded from the present study.
Hepatic Regulation of Glutathione Transferase mRNAs.
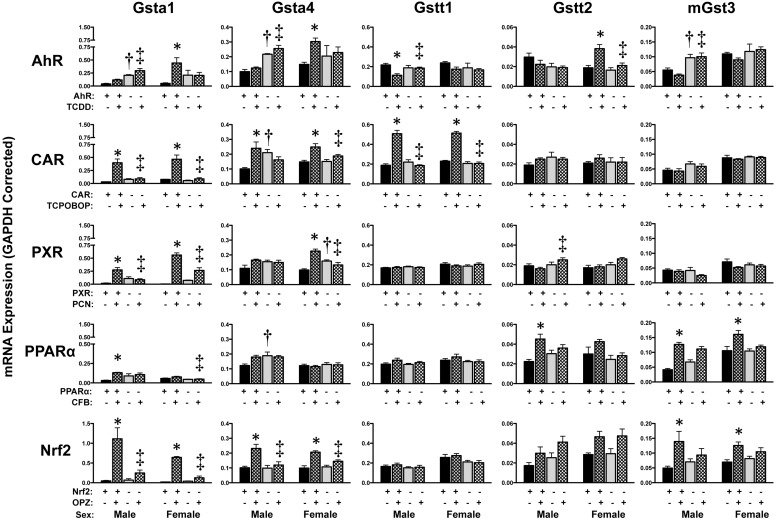
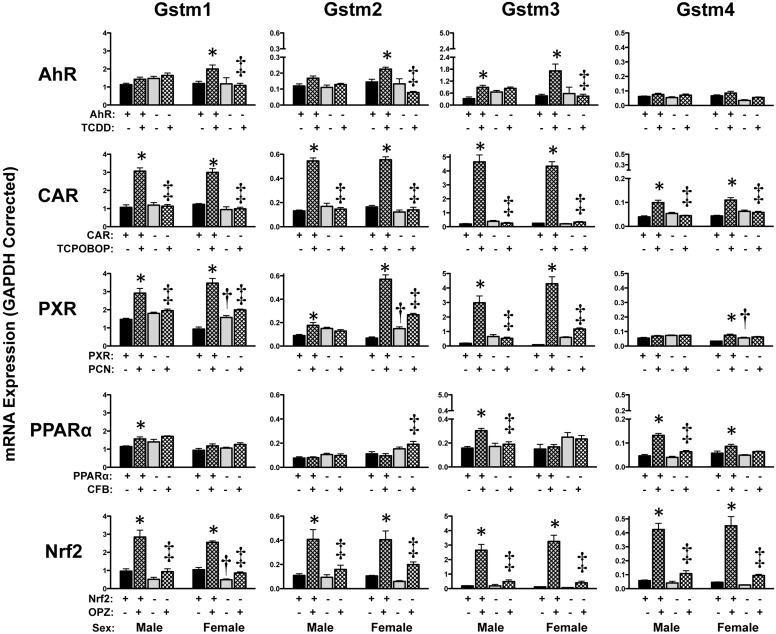
mRNA expression of Gsta and Gstm isoforms was highly inducible by multiple chemical activators (Figs. 7 and 8). The most consistent up-regulation of Gst isoforms in both sexes was observed in response to TCPOBOP, PCN, or OPZ. TCPOBOP increased (between 1.6- and 23-fold) Gsta1, Gsta4, Gstt1, and Gstm1-m4 in wild-type but not in CAR-null mice. Likewise, PCN increased Gsta1 (16-fold in males and 113-fold in females) and Gstm1–3 mRNAs (2- to 50-fold). OPZ elevated Gsta1, Gsta4, and Gstm1–4 between 2.3- and 33-fold in male and female wild-type mice. TCDD and CFB also induced Gst mRNA expression but often to a lesser extent and only in one sex of mice. Most Gst mRNA elevations occurred only in wild-type mice. Notable exceptions include Gsta1 and Gstm2–4 mRNAs, which were also induced in Nrf2-null and PXR-null mice treated with activators, albeit to a lesser degree.
Fig. 7.
Hepatic mRNA expression of Gst enzymes in livers of wild-type and transcription factor-null mice after chemical activation. mRNA expression was quantified using total hepatic RNA from control- and inducer-treated wild-type and transcription factor-null mice on day 5. Data were normalized to glyceraldehyde 3-phosphate dehydrogenase (GAPDH) mRNA and are presented as mean relative expression ± S.E. For each graph, males are on the left and females are on the right. *, statistically significant differences (p < 0.05) compared with control mice of that genotype. †, statistically significant difference (p < 0.05) between wild-type and null control mice. ‡, statistically significant difference (p < 0.05) between wild-type and null inducer-treated mice.
Fig. 8.
Hepatic mRNA expression of Gst enzymes in livers of wild-type and transcription factor-null mice after chemical activation. mRNA expression was quantified using total hepatic RNA from control- and inducer-treated wild-type and transcription factor-null mice on day 5. Data were normalized to glyceraldehyde 3-phosphate dehydrogenase (GAPDH) mRNA and are presented as mean relative expression ± S.E. For each graph, males are on the left and females are on the right. *, statistically significant differences (p < 0.05) compared with control mice of that genotype. †, statistically significant difference (p < 0.05) between wild-type and null control mice. ‡, statistically significant difference (p < 0.05) between wild-type and null inducer-treated mice.
Constitutive mRNA expression of hepatic Gst isoforms, as assessed in vehicle-treated mice, was largely similar between wild-type and transcription factor-null mice (Figs. 7 and 8). In fact, no Gst isoform was consistently altered in both male and female transcription factor-null mice. Instead, male AhR-null mice exhibited higher Gsta1, Gsta4, and mGst3 mRNA and female PXR-null mice had elevated levels of Gsta4, m1, m2, and m4 mRNA. Because Gsta3, k1, m5, m6, p1/2, t3, and z1 and mGst1 mRNA exhibit little to no change in response to chemical activator treatment (Knight et al., 2008), they were not included in this study.
Hepatic Regulation of Slc and Abc Transporter mRNAs.
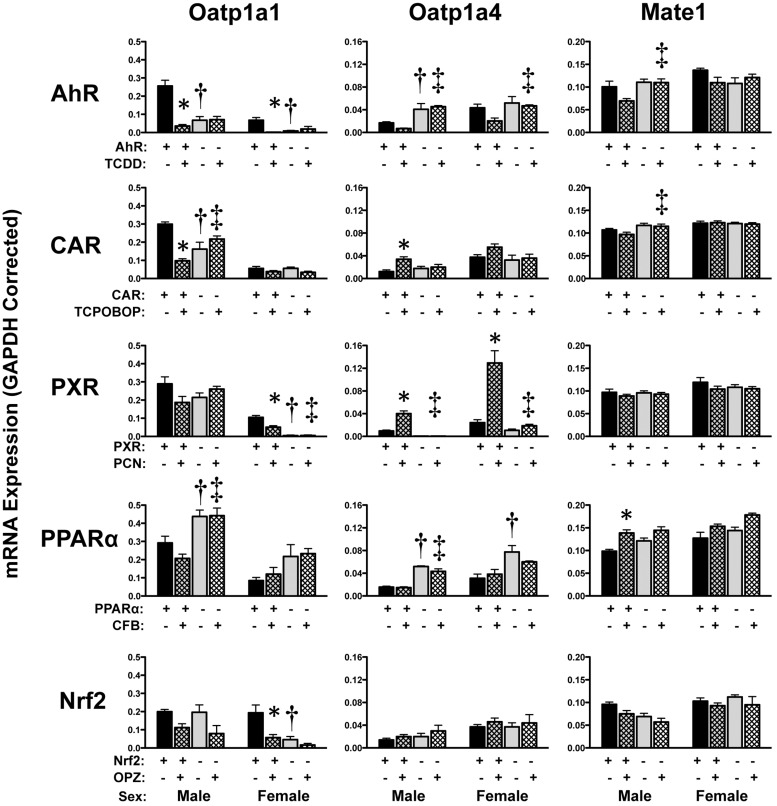
Slc transporters, namely organic anion-transporting polypeptide (Oatp) 1a1 and 1a4, were differentially regulated by knocking out various transcription factors and in response to chemical activators (Fig. 9). Other prominent liver-expressed transporters including Oatp1b2 and Oatp2b1 exhibited little to no change after chemical activator treatment (Cheng et al., 2005) and were not included in the present study. One intriguing observation was the marked TCDD-mediated down-regulation of Oatp1a1 mRNA to 13 and 3% of that of vehicle-treated controls in male and female wild-type mice, respectively. Additional chemical activators reduced Oatp1a1 mRNA in only one gender; these included TCPOBOP (males), PCN (females), or OPZ (females). In each case, down-regulation of Oatp1a1 was observed only in wild-type mice but not in transcription factor-null mice. In contrast, Oatp1a4 mRNA was markedly induced in both sexes between 4.4- and 5.4-fold by PCN treatment as well as in male mice treated with TCPOBOP (2.8-fold). Multidrug and toxin extrusion protein 1 (Mate1) mRNA expression was only slightly induced (1.4-fold) by CFB in wild-type male mice.
Fig. 9.
Hepatic mRNA expression of uptake transporters in livers of wild-type and transcription factor-null mice after chemical activation. mRNA expression of Oatp and Mate transporters was quantified using total hepatic RNA from control- and inducer-treated wild-type and transcription factor-null mice on day 5. Data were normalized to glyceraldehyde 3-phosphate dehydrogenase (GAPDH) mRNA and are presented as mean relative expression ± S.E. For each graph, males are on the left and females are on the right. *, statistically significant differences (p < 0.05) compared with control mice of that genotype. †, statistically significant difference (p < 0.05) between wild-type and null control mice. ‡, statistically significant difference (p < 0.05) between wild-type and null inducer-treated mice.
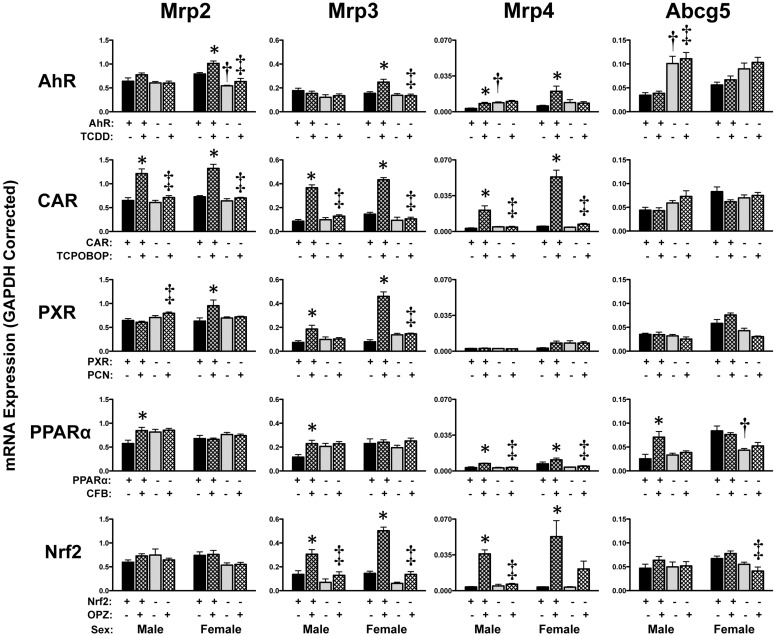
Induction of multidrug resistance-associated protein (Mrp) 2 (2-fold), Mrp3 (3–4-fold), and Mrp4 (6.7–11-fold) mRNA was observed in male and female TCPOBOP-treated wild-type mice, with no change in expression in CAR-null mice. Similar up-regulation of Mrp2 mRNA, albeit to a much lower degree (1.5-fold), was detected in livers of wild-type mice treated with TCDD (females only), PCN (females only), or CFB (males only). Mrp3 mRNA was induced 2- to 6-fold in a transcription factor-dependent manner in response to TCDD (females only), PCN, CFB (males only), or OPZ. In addition to TCPOBOP, OPZ markedly increased Mrp4 mRNA in livers of wild-type mice, suggesting that CAR and Nrf2 are key transcription factors for this gene. CFB also induced mRNA expression of Abcg5 2.8-fold in wild-type but not in PPARα-null male mice.
It should be noted that higher basal Oatp1a1 mRNA expression (1.5-fold) was observed in vehicle-treated PPARα-null male mice and lower Oatp1a1 mRNA was detected in vehicle-treated AhR-, CAR-, PXR-, and Nrf2-null male or female mice. mRNA expression of Oatp1a4 was higher basally in AhR (males only, 2.4-fold)- and PPARα-null mice (3-fold). Constitutive mRNA expression of hepatic Mrp2–4 isoforms, as assessed in vehicle-treated mice, was largely similar between wild-type and transcription factor-null mice (Fig. 10).
Fig. 10.
Hepatic mRNA expression of efflux transporters in livers of wild-type and transcription factor-null mice after chemical activation. mRNA expression of Abc transporters, including the Mrp transporters, was quantified using total hepatic RNA from control- and inducer-treated wild-type and transcription factor-null mice on day 5. Data were normalized to glyceraldehyde 3-phosphate dehydrogenase (GAPDH) mRNA and are presented as mean relative expression ± S.E. For each graph, males are on the left and females are on the right. *, statistically significant differences (p < 0.05) compared with control mice of that genotype. †, statistically significant difference (p < 0.05) between wild-type and null control mice. ‡, statistically significant difference (p < 0.05) between wild-type and null inducer-treated mice.
Discussion
In the current study, we used a systematic approach to investigate five transcription factors in the in vivo regulation of drug-metabolizing and transport genes in response to microsomal enzyme inducers. Mice lacking these transcription factors are useful tools in evaluating the physiological and chemical regulation of drug-processing genes. Use of null mice demonstrated that the majority of the transcriptional changes in response to chemical treatment were dependent on expression of particular transcription factors. As expected, prototypical genes for each transcription factor (P450s and Nqo1) were induced in response to corresponding chemical activators. Similar to prior work in this laboratory, the pharmacological inducers used in this study are not entirely specific to one target P450 gene but produce minor increases in other P450 isoforms (Petrick and Klaassen, 2007). For example, TCPOBOP activates its target gene, Cyp2b10, but also Cyp1a2, Cyp3a11, and Nqo1 (Fig. 1). In each of these cases, TCPOBOP-mediated induction was dependent on CAR expression. Taken together, the results of this study 1) document the critical role of transcription factors in the basal expression of some drug metabolism and transport genes (Table 2), 2) provide evidence of transcription factor-dependent regulation of phase I and II enzymes and transport genes in response to chemical activation (Table 3), and 3) identify the influence of gender on the transcriptional regulation of drug disposition genes.
TABLE 2.
Constitutive expression of metabolism and transport genes in livers from transcription factor-null mice relative to wild-type mice
Basal expression of genes is shown as increased (↑) or decreased (↓) relative to that in wild-type mice. Bold font denotes consistent changes in both male and female mice.
| Genes | Transcription Factor-Null Mice |
||||
|---|---|---|---|---|---|
| AhR | CAR | PXR | PPARα | Nrf2 | |
| Phase I enzymes | |||||
| Cyp | ↓ Cyp1a2 | ↑ Cyp4a14 (♂) | ↑ Cyp3a11 (♀) | ↑ Cyp1a2 (♀) | ↑ Cyp3a11 |
| ↑ Cyp3a11 | ↑ Cyp4a14 | ||||
| Aldh | ↑ Aldh1b1 | ↓ Aldh1a1 (♀) | ↑ Aldh1a1 | ↓ Aldh1a1 (♀) | ↓ Aldh1a1 (♀) |
| ↓ Aldh1a1 (♀) | ↓ Aldh6a1 (♀) | ↑ Aldh1b1 (♀) | ↑ Aldh1b1 (♀) | ||
| ↓ Aldh3a2 (♂) | ↓ Aldh7a1 (♀) | ↑ Aldh7a1 (♂) | ↑ Aldh4a1 (♀) | ||
| ↓ Aldh9a1 (♀) | ↓ Aldh6a1 (♂) | ||||
| Phase II enzymes | |||||
| Ugt | ↓ Ugt1a5 (♀) | ↓ Ugt1a6 (♀) | ↑ Ugt1a6 (♂) | ↓ Ugt1a6 | |
| ↑ Ugt2a3 | ↓ Ugt2b1 | ||||
| ↑ Ugt2b35 (♂) | ↓ Ugt2b34 (♀) | ||||
| ↑ Ugt2b36 (♂) | ↓ Ugt2b35 | ||||
| ↓ Ugt2b36 | |||||
| Sult | ↓ Sult3a1 (♀) | ↑ Sult2a2 (♀) | ↑ Sult1e1 (♀) | ↓ Sult3a1 (♀) | |
| ↑ Papss2 (♂) | ↑ Sult3a1 (♀) | ↑ Sult5a1 | ↓ Sult5a1 (♀) | ||
| ↑ Papss2 | ↑ Papss2 (♀) | ||||
| Gst | ↑ Gsta1 (♂) | ↑ Gsta4 (♂) | ↑ Gsta4 (♀) | ↑ Gsta4 (♂) | ↓ Gstm1 (♀) |
| ↑ Gsta4 (♂) | ↑ Gstm1 (♀) | ||||
| ↑ mGst3 (♂) | ↑ Gstm2 (♀) | ||||
| ↑ Gstm4 (♀) | |||||
| Transporters | |||||
| Slco | ↓ Oatp1a1 | ↓ Oatp1a1 (♂) | ↓ Oatp1a1 (♀) | ↑ Oatp1a1 (♂) | ↓ Oatp1a1 (♀) |
| ↑ Oatp1a4 (♂) | ↑ Oatp1a4 | ||||
| Abc | ↓ Mrp2 (♀) | ↓ Abcg5 (♀) | |||
| ↑ Mrp4 (♂) | |||||
| ↑ Abcg5 (♂) | |||||
TABLE 3.
Summary of chemical- and transcription factor-dependent mRNA changes
Increases in mRNA expression are denoted as <3-fold (↑), 3- to 30-fold (↑↑), and >30-fold (↑↑↑). Reductions in mRNA expression are denoted as levels decreased to >75% of control (↓), 50 to 75% of control (↓↓), and <50% of control (↓↓↓).
| Genes | AhR |
CAR |
PXR |
PPARα |
Nrf2 |
|||||
|---|---|---|---|---|---|---|---|---|---|---|
| ♂ | ♀ | ♂ | ♀ | ♂ | ♀ | ♂ | ♀ | ♂ | ♀ | |
| Phase I enzymes | ||||||||||
| Cyp1a2 | ↑↑ | ↑ | ↑ | ↑ | ↑ | ↑ | ||||
| Cyp2b10 | ↑↑ | ↑↑↑ | ↑↑↑ | ↑↑ | ||||||
| Cyp3a11 | ↑↑ | ↑ | ↑ | ↑ | ↑ | ↑ | ||||
| Cyp4a11 | ↓↓↓ | ↑↑↑ | ↑↑ | ↑↑ | ||||||
| Nqo1 | ↑↑ | ↑↑ | ↑ | ↑↑ | ↑↑ | ↑↑ | ||||
| Aldh1a1 | ↑ | ↑ | ↑↑ | ↑ | ↑ | ↑ | ↑ | |||
| Aldh1a7 | ↑ | ↑ | ↑↑ | ↑ | ↑ | ↑ | ||||
| Aldh1b1 | ||||||||||
| Aldh3a2 | ↓↓↓ | ↑ | ||||||||
| Aldh4a1 | ↓ | |||||||||
| Aldh6a1 | ↓↓ | |||||||||
| Aldh7a1 | ↑ | ↑ | ↓ | |||||||
| Aldh9a1 | ↑ | |||||||||
| Phase II enzymes | ||||||||||
| Ugt1a1 | ↑ | ↑ | ↑ | ↑ | ↑ | ↑ | ||||
| Ugt1a5 | ↑ | ↑ | ↑ | |||||||
| Ugt1a6 | ↑ | ↑↑ | ↑ | |||||||
| Ugt1a9 | ↑↑ | ↑↑ | ↑ | ↑ | ↑↑ | ↑ | ||||
| Ugt2a3 | ↓↓ | ↓↓ | ↓↓ | ↓↓ | ||||||
| Ugt2b1 | ↓↓↓ | ↓↓↓ | ||||||||
| Ugt2b34 | ↑ | ↑ | ↑ | ↑ | ↑ | |||||
| Ugt2b35 | ↑ | ↑ | ↑↑ | |||||||
| Ugt2b36 | ↑ | ↑ | ||||||||
| Sult1e1 | ↑↑↑ | ↑↑ | ||||||||
| Sult2a2 | ↑ | ↑↑ | ||||||||
| Sult3a1 | ↓↓↓ | ↑↑↑ | ↑↑ | ↑ | ||||||
| Sult5a1 | ↑ | ↑↑ | ↑ | ↑ | ↓↓ | |||||
| Papss2 | ↓↓ | ↑ | ↑ | ↑ | ↑ | |||||
| Gsta1 | ↑↑ | ↑↑ | ↑↑ | ↑↑ | ↑↑↑ | ↑↑ | ↑↑ | ↑↑↑ | ||
| Gsta4 | ↑ | ↑ | ↑ | ↑ | ↑ | ↑ | ||||
| Gstt1 | ↓↓ | ↑ | ↑ | |||||||
| Gstt2 | ↑ | ↑ | ||||||||
| mGst3 | ↑↑ | ↑ | ↑ | ↑ | ||||||
| Gstm1 | ↑ | ↑↑ | ↑ | ↑ | ↑↑ | ↑ | ↑↑ | ↑ | ||
| Gstm2 | ↑ | ↑↑ | ↑↑ | ↑ | ↑↑ | ↑↑ | ↑↑ | |||
| Gstm3 | ↑ | ↑↑ | ↑↑ | ↑↑ | ↑↑ | ↑↑↑ | ↑ | ↑↑ | ↑↑ | |
| Gstm4 | ↑ | ↑ | ↑ | ↑ | ↑ | ↑↑ | ↑↑ | |||
| Transporters | ||||||||||
| Oatp1a1 | ↓↓↓ | ↓↓↓ | ↓↓↓ | ↓↓ | ↓↓↓ | |||||
| Oatp1a4 | ↑ | ↑↑ | ↑↑ | |||||||
| Mate1 | ↑ | |||||||||
| Mrp2 | ↑ | ↑ | ↑ | ↑ | ↑ | |||||
| Mrp3 | ↑ | ↑↑ | ↑ | ↑ | ↑↑ | ↑ | ↑ | ↑↑ | ||
| Mrp4 | ↑ | ↑↑ | ↑↑ | ↑↑ | ↑ | ↑ | ↑↑ | ↑↑ | ||
| Abcg5 | ↑ | |||||||||
Constitutive expression of a few hepatic genes was altered in the absence of a transcription factor (Table 2). The genes that were consistently increased in both male and female transcription factor-null mice include Aldh1b1 in AhR-null mice, Aldh1a1 and Papss2 in PXR-null mice, Cyp3a11, Ugt2a3, Sult5a1, and Oatp1a4 in PPARα-null mice, and Cyp3a11 and Cyp4a14 in Nrf2-null mice. Conversely, lower basal mRNA expression in both sexes was observed for Cyp1a2 and Oatp1a1 in AhR-null mice and Ugt1a6 and Ugt2b1 in Nrf2-null mice. It is unclear why the remaining differences in constitutive expression occur in one gender but not the other. This laboratory has previously investigated gender-divergent regulation of Ugt and Sult enzymes (Buckley and Klaassen, 2009b; Alnouti and Klaassen, 2011). Sult enzymes are critically regulated by the stimulatory effects of estrogens and growth hormone secretion patterns and suppressed by androgens. Of interest, the differences in basal Sult mRNA expression in PXR- and PPARα-null mice were largely observed in female mice. It is important to also note that low basal Ugt expression in male Nrf2-null mice corresponds with a prior study from this laboratory (Yeager et al., 2009). To better understand the mechanisms underlying gender-specific patterns in basal metabolic and transport genes, future studies should focus on sex and growth hormone signaling in the various transcription factor-null mice.
The use of both male and female mice in the current study provides novel insight into the genes that are consistently regulated by activation of transcription factors, regardless of gender (Table 3). Activation of CAR signaling using TCPOBOP resulted in the up-regulation of the largest number of genes in a CAR-dependent manner including Cyp1a2, Cyp2b10, Cyp3a11, Aldh1a1, Aldh1a7, Ugt1a1, Ugt2b34, Sult1e1, Sult3a1, Sult5a1, Papss2, Gsta1, Gsta4, Gstt1, Gstm1–m4, and Mrp2–4. This wide range of target genes points to the critical role of this transcription factor as well as the potency of TCPOBOP to transactivate CAR-mediated gene expression. AhR and PXR signaling are important in up-regulating various isoforms of the Ugt and Mrp families. PXR was also a consistent inducer of Gst enzymes. Activation of Nrf2 using OPZ treatment was mostly limited to regulating Gst and Mrp genes. The broad regulation of Mrp transport genes by each transcription factor has been reviewed previously (Klaassen and Slitt, 2005; Klaassen and Aleksunes, 2010). Taken together, the results of this study highlight the role of each transcription factor to particularly regulate different families of drug metabolism genes.
There were a few genes that were down-regulated in both male and female mice treated with chemical activators. The most notable reactions include the reduced expression of Ugt2a3 mRNA in TCPOBOP-treated mice and Oatp1a1 mRNA in TCDD-treated mice. Work from this laboratory previously observed these changes in male mice (Cheng et al., 2005; Buckley and Klaassen, 2009a); however, the consistent down-regulation of both genes in female mice points to a critical role for AhR and CAR in regulating the levels of target genes.
Similar to constitutive expression patterns, the inducible regulation of some genes demonstrated gender-specific patterns. Because of the preferentially higher expression of Sult isoforms in female mice, it was not surprising that the majority of transcriptional changes (induction of Sult2a2 and Sult3a1) were observed in this gender. Moreover, up-regulation of Aldh1a7 mRNA was observed in female wild-type mice treated with TCDD, PCN, or OPZ and in male wild-type mice treated with CFB (Fig. 2). TCPOBOP-mediated up-regulation of Aldh1a7 was observed in both genders. Likewise, most genes induced by TCPOBOP were similarly increased in both male and female wild-type livers, suggesting that hormonal differences may not be critical in regulating CAR target genes.
Overlap in responses between different transcription factors is evident in the current study. Similar to prior work, up-regulation of Nqo1 was observed in response to activation of AhR, CAR, PPARα, and Nrf2 in wild-type but not in transcription factor-null mice (Maher et al., 2007; Merrell et al., 2008; Yeager et al., 2009). These data suggest cross-regulation of Nqo1 and other drug disposition genes by interrelated signaling pathways (Slitt et al., 2006; Köhle and Bock, 2009). This overlap in responses is often termed “cross-talk” and was evident for a number of genes. Work in our laboratory has demonstrated roles for both Nrf2 and PPARα in up-regulation of Mrp3 and Mrp4 mRNA in response to chemicals such as perfluorooctanoic acid (Maher et al., 2008). Additional work is necessary to delineate whether regulation occurs directly or indirectly and the temporal sequence in which pathways participate in transcriptional up-regulation.
The results of this study correspond with prior studies using prototypical inducers in male wild-type mice. Strong concordance was notable for P450, Sult, Gst, and Mrp mRNA regulation (Maher et al., 2005; Petrick and Klaassen, 2007; Alnouti and Klaassen, 2008a; Knight et al., 2008). There were a limited number of genes in which induction was noted in a prior publication but not in the current study. For example, Aldh1b1 mRNA was modestly up-regulated by chemical activators of all five transcription factors (Alnouti and Klaassen, 2008b). However, in the current study, only nonsignificant increases were observed in male mice (Fig. 2). Likewise, CFB was previously shown to up-regulate Aldh4a1, Aldh6a1, and Aldh7a1 mRNA, which was not observed in the present work (Fig. 3). Likewise, Ugt1a6 mRNA induction by ligands of PXR, PPARα, and Nrf2 (Buckley and Klaassen, 2009a) was not detected in this study (Fig. 4). Attempts were made to control the experimental design between the current and prior studies including animal strain, age, and dosing time. However, there were minor differences including the dose and route of administration of oltipraz (75 mg/kg i.p. in the current study versus 150 mg/kg p.o. in the prior study) (Alnouti and Klaassen, 2008a). The quantification of mRNA expression in both studies was based on the branched DNA signal amplification assay; however, the current study used a multiplex format with redesigned probes. These differences may account for some minor differences between the current and prior studies.
Prototypical chemical inducers were used in the present study; however, these data are applicable to other xenobiotics and pathological states. It is known that activation of CAR and PXR protects against bile acid toxicity and cholestasis in mice (Staudinger et al., 2001b; Wagner et al., 2005). The transcriptional pathways that are activated in response to injury via CAR and PXR may be better understood in the context of data generated in the present study. Likewise, the U.S. Environmental Protection Agency's ToxCast program uses screening mechanisms for identifying interactions of environmental chemicals and xenobiotics with key nuclear receptors, including those in this study (Martin et al., 2010; Rotroff et al., 2010). The responses of wild-type and transcription factor-null mice in response to chemical inducers is of potential importance to better understand the toxicological regulation of these pathways by chemicals and toxicants.
Extrapolation of the current data to humans is supported in part by in vitro exposure of human hepatocytes to activators of key pathways. For example, similar to the rodent data, treatment of human hepatocytes with phenobarbital (CAR agonist), rifampin (PXR agonist), or OPZ induces mRNA expression of CYP2B6, CYP3A4, or NQO1, respectively, as well as up-regulation of MRP2 by all three chemicals (Jigorel et al., 2006). Exposure of human hepatocytes to AhR, CAR, or PXR ligands up-regulates UGT activity in human hepatocytes in a manner similar to our in vivo rodent mRNA data (Soars et al., 2004). Of note, differences in receptor regulation between rodents and humans (such as those for PPARα) and responsiveness to xenobiotic activation between species (such as that for CAR and PXR) are limitations to extrapolation of the present data. Likewise, responses documented in this work may be dependent on the specific chemicals, doses, routes of administration, and durations selected for the current study. Additional studies will also be needed to confirm protein and functional changes in each of these disposition pathways. However, the fact that preclinical studies are typically performed in rodents strongly supports dissecting the transcriptional networks of AhR, CAR, PXR, PPARα, and Nrf2 in mice.
Using prototypical chemical activators and transcription factor-null mice, in the present study we document the transcriptional responses of male and female mice to chemical treatment and identify the dependence of these responses on the function of key hepatic transcription factors. In general, differential expression of target genes in wild-type mice treated with prototypical chemical activators was largely absent in transcription factor-null mice. Taken together, the results of this study provide a comprehensive understanding of the basal and inducible regulation of phase I and II enzymes and transport genes in livers of mice via AhR-, CAR-, PXR-, PPARα-, and Nrf2-mediated pathways.
Acknowledgments
We thank the graduate students and fellows of the Klaassen laboratory including Drs. Scott Reisman, Rachel Chennault, and Ronnie Yeager as well as Allison Johnson, a high school teacher, for contributions to this project.
This work was supported by the National Institutes of Health National Institute of Diabetes and Digestive and Kidney Diseases [Grants DK080774, DK081461]; National Institutes of Health National Institute of Environmental Health Sciences [Grants ES019487, ES020522, ES009649, ES007079]; National Institutes of Health National Center for Research Resources [Grant RR021940]; and in part by National Institutes of Health National Institute of Environmental Health Sciences-sponsored University of Medicine and Dentistry of New Jersey Center for Environmental Exposures and Disease [Grant P30-ES005022].
Article, publication date, and citation information can be found at http://dmd.aspetjournals.org.
- AhR
- aryl hydrocarbon receptor
- CAR
- aryl hydrocarbon receptor
- PXR
- pregnane X receptor
- PPARα
- peroxisome proliferator-activated receptor α
- Nrf2
- nuclear factor erythroid 2-related factor 2
- P450
- cytochrome P450
- TCDD
- 2′,3′,7′,8′-tetrachlorodibenzo-p-dioxin
- PCN
- pregnenolone-16-α-carbonitrile
- CBF
- clofibrate
- OPZ
- oltipraz
- Nqo1
- NAD(P)H:quinone oxidoreductase 1
- Aldh
- aldehyde dehydrogenase
- Sult
- sulfotransferase
- Gst
- glutathione transferase
- Ugt
- UDP-glucuronosyltransferase
- Abc
- ATP-binding cassette
- Slc
- solute carrier
- TCPOBOP
- 3,3′,5,5′-tetrachloro-1,4-bis(pyridyloxy)benzene
- P450
- cytochrome P450
- Papss2
- 3′-phosphoadenosine 5′-phosphosulfate synthase 2
- Oatp
- organic anion-transporting polypeptide
- Mate
- multidrug and toxin extrusion
- Mrp
- multidrug resistance-associated protein.
Authorship Contributions
Participated in research design: Aleksunes and Klaassen.
Conducted experiments: Aleksunes.
Contributed new reagents or analytic tools: Klaassen.
Performed data analysis: Aleksunes.
Wrote or contributed to the writing of the manuscript: Aleksunes and Klaassen.
References
- Akiyama TE, Nicol CJ, Fievet C, Staels B, Ward JM, Auwerx J, Lee SS, Gonzalez FJ, Peters JM. (2001) Peroxisome proliferator-activated receptor-α regulates lipid homeostasis, but is not associated with obesity: studies with congenic mouse lines. J Biol Chem 276:39088–39093 [DOI] [PubMed] [Google Scholar]
- Aleksunes LM, Manautou JE. (2007) Emerging role of Nrf2 in protecting against hepatic and gastrointestinal disease. Toxicol Pathol 35:459–473 [DOI] [PubMed] [Google Scholar]
- Aleksunes LM, Yeager RL, Klaassen CD. (2009) Application of multivariate statistical procedures to identify transcription factors that correlate with MRP2, 3, and 4 mRNA in adult human livers. Xenobiotica 39:514–522 [DOI] [PMC free article] [PubMed] [Google Scholar]
- Alnouti Y, Klaassen CD. (2006) Tissue distribution and ontogeny of sulfotransferase enzymes in mice. Toxicol Sci 93:242–255 [DOI] [PubMed] [Google Scholar]
- Alnouti Y, Klaassen CD. (2008a) Regulation of sulfotransferase enzymes by prototypical microsomal enzyme inducers in mice. J Pharmacol Exp Ther 324:612–621 [DOI] [PubMed] [Google Scholar]
- Alnouti Y, Klaassen CD. (2008b) Tissue distribution, ontogeny, and regulation of aldehyde dehydrogenase (Aldh) enzymes mRNA by prototypical microsomal enzyme inducers in mice. Toxicol Sci 101:51–64 [DOI] [PubMed] [Google Scholar]
- Alnouti Y, Klaassen CD. (2011) Mechanisms of gender-specific regulation of mouse sulfotransferases (Sults). Xenobiotica 41:187–197 [DOI] [PMC free article] [PubMed] [Google Scholar]
- Buckley DB, Klaassen CD. (2009a) Induction of mouse UDP-glucuronosyltransferase mRNA expression in liver and intestine by activators of aryl-hydrocarbon receptor, constitutive androstane receptor, pregnane X receptor, peroxisome proliferator-activated receptor α, and nuclear factor erythroid 2-related factor 2. Drug Metab Dispos 37:847–856 [DOI] [PMC free article] [PubMed] [Google Scholar]
- Buckley DB, Klaassen CD. (2009b) Mechanism of gender-divergent UDP-glucuronosyltransferase mRNA expression in mouse liver and kidney. Drug Metab Dispos 37:834–840 [DOI] [PMC free article] [PubMed] [Google Scholar]
- Chan K, Lu R, Chang JC, Kan YW. (1996) NRF2, a member of the NFE2 family of transcription factors, is not essential for murine erythropoiesis, growth, and development. Proc Natl Acad Sci USA 93:13943–13948 [DOI] [PMC free article] [PubMed] [Google Scholar]
- Cheng X, Klaassen CD. (2006) Regulation of mRNA expression of xenobiotic transporters by the pregnane X receptor in mouse liver, kidney, and intestine. Drug Metab Dispos 34:1863–1867 [DOI] [PubMed] [Google Scholar]
- Cheng X, Maher J, Dieter MZ, Klaassen CD. (2005) Regulation of mouse organic anion-transporting polypeptides (Oatps) in liver by prototypical microsomal enzyme inducers that activate distinct transcription factor pathways. Drug Metab Dispos 33:1276–1282 [DOI] [PubMed] [Google Scholar]
- Dreyer C, Keller H, Mahfoudi A, Laudet V, Krey G, Wahli W. (1993) Positive regulation of the peroxisomal β-oxidation pathway by fatty acids through activation of peroxisome proliferator-activated receptors (PPAR). Biol Cell 77:67–76 [DOI] [PubMed] [Google Scholar]
- Handschin C, Meyer UA. (2003) Induction of drug metabolism: the role of nuclear receptors. Pharmacol Rev 55:649–673 [DOI] [PubMed] [Google Scholar]
- Jigorel E, Le Vee M, Boursier-Neyret C, Parmentier Y, Fardel O. (2006) Differential regulation of sinusoidal and canalicular hepatic drug transporter expression by xenobiotics activating drug-sensing receptors in primary human hepatocytes. Drug Metab Dispos 34:1756–1763 [DOI] [PubMed] [Google Scholar]
- Johnson EF, Palmer CN, Griffin KJ, Hsu MH. (1996) Role of the peroxisome proliferator-activated receptor in cytochrome P450 4A gene regulation. FASEB J 10:1241–1248 [DOI] [PubMed] [Google Scholar]
- Klaassen CD. (1970) Plasma disappearance and biliary excretion of sulfobromophthalein and phenol-3,6-dibromphthalein disulfonate after microsomal enzyme induction. Biochem Pharmacol 19:1241–1249 [DOI] [PubMed] [Google Scholar]
- Klaassen CD. (1974) Effect of microsomal enzyme inducers on the biliary excretion of cardiac glycosides. J Pharmacol Exp Ther 191:201–211 [PubMed] [Google Scholar]
- Klaassen CD. (1976) Effect of microsomal enzyme inducers on the biliary excretion of an exogenous load of bilirubin in newborn rats. Proc Soc Exp Biol Med 153:370–373 [DOI] [PubMed] [Google Scholar]
- Klaassen CD, Aleksunes LM. (2010) Xenobiotic, bile acid, and cholesterol transporters: function and regulation. Pharmacol Rev 62:1–96 [DOI] [PMC free article] [PubMed] [Google Scholar]
- Klaassen CD, Slitt AL. (2005) Regulation of hepatic transporters by xenobiotic receptors. Curr Drug Metab 6:309–328 [DOI] [PubMed] [Google Scholar]
- Knight TR, Choudhuri S, Klaassen CD. (2008) Induction of hepatic glutathione S-transferases in male mice by prototypes of various classes of microsomal enzyme inducers. Toxicol Sci 106:329–338 [DOI] [PMC free article] [PubMed] [Google Scholar]
- Köhle C, Bock KW. (2009) Coordinate regulation of human drug-metabolizing enzymes, and conjugate transporters by the Ah receptor, pregnane X receptor and constitutive androstane receptor. Biochem Pharmacol 77:689–699 [DOI] [PubMed] [Google Scholar]
- Lee SS, Pineau T, Drago J, Lee EJ, Owens JW, Kroetz DL, Fernandez-Salguero PM, Westphal H, Gonzalez FJ. (1995) Targeted disruption of the α isoform of the peroxisome proliferator-activated receptor gene in mice results in abolishment of the pleiotropic effects of peroxisome proliferators. Mol Cell Biol 15:3012–3022 [DOI] [PMC free article] [PubMed] [Google Scholar]
- Maher JM, Aleksunes LM, Dieter MZ, Tanaka Y, Peters JM, Manautou JE, Klaassen CD. (2008) Nrf2- and PPARα-mediated regulation of hepatic Mrp transporters after exposure to perfluorooctanoic acid and perfluorodecanoic acid. Toxicol Sci 106:319–328 [DOI] [PMC free article] [PubMed] [Google Scholar]
- Maher JM, Cheng X, Slitt AL, Dieter MZ, Klaassen CD. (2005) Induction of the multidrug resistance-associated protein family of transporters by chemical activators of receptor-mediated pathways in mouse liver. Drug Metab Dispos 33:956–962 [DOI] [PubMed] [Google Scholar]
- Maher JM, Dieter MZ, Aleksunes LM, Slitt AL, Guo G, Tanaka Y, Scheffer GL, Chan JY, Manautou JE, Chen Y, Dalton TP, Yamamoto M, Klaassen CD. (2007) Oxidative and electrophilic stress induces multidrug resistance-associated protein transporters via the nuclear factor-E2-related factor-2 transcriptional pathway. Hepatology 46:1597–1610 [DOI] [PubMed] [Google Scholar]
- Martin MT, Dix DJ, Judson RS, Kavlock RJ, Reif DM, Richard AM, Rotroff DM, Romanov S, Medvedev A, Poltoratskaya N, Gambarian M, Moeser M, Makarov SS, Houck KA. (2010) Impact of environmental chemicals on key transcription regulators and correlation to toxicity end points within EPA's ToxCast program. Chem Res Toxicol 23:578–590 [DOI] [PubMed] [Google Scholar]
- Merrell MD, Jackson JP, Augustine LM, Fisher CD, Slitt AL, Maher JM, Huang W, Moore DD, Zhang Y, Klaassen CD, Cherrington NJ. (2008) The Nrf2 activator oltipraz also activates the constitutive androstane receptor. Drug Metab Dispos 36:1716–1721 [DOI] [PMC free article] [PubMed] [Google Scholar]
- Moffit JS, Aleksunes LM, Maher JM, Scheffer GL, Klaassen CD, Manautou JE. (2006) Induction of hepatic transporters multidrug resistance-associated proteins (Mrp) 3 and 4 by clofibrate is regulated by peroxisome proliferator-activated receptor alpha. J Pharmacol Exp Ther 317:537–545 [DOI] [PubMed] [Google Scholar]
- Nioi P, McMahon M, Itoh K, Yamamoto M, Hayes JD. (2003) Identification of a novel Nrf2-regulated antioxidant response element (ARE) in the mouse NAD(P)H:quinone oxidoreductase 1 gene: reassessment of the ARE consensus sequence. Biochem J 374:337–348 [DOI] [PMC free article] [PubMed] [Google Scholar]
- Petrick JS, Klaassen CD. (2007) Importance of hepatic induction of constitutive androstane receptor and other transcription factors that regulate xenobiotic metabolism and transport. Drug Metab Dispos 35:1806–1815 [DOI] [PubMed] [Google Scholar]
- Rotroff DM, Beam AL, Dix DJ, Farmer A, Freeman KM, Houck KA, Judson RS, LeCluyse EL, Martin MT, Reif DM, Ferguson SS. (2010) Xenobiotic-metabolizing enzyme and transporter gene expression in primary cultures of human hepatocytes modulated by ToxCast chemicals. J Toxicol Environ Health B Crit Rev 13:329–346 [DOI] [PubMed] [Google Scholar]
- Schmidt JV, Su GH, Reddy JK, Simon MC, Bradfield CA. (1996) Characterization of a murine Ahr null allele: involvement of the Ah receptor in hepatic growth and development. Proc Natl Acad Sci USA 93:6731–6736 [DOI] [PMC free article] [PubMed] [Google Scholar]
- Slitt AL, Cherrington NJ, Dieter MZ, Aleksunes LM, Scheffer GL, Huang W, Moore DD, Klaassen CD. (2006) trans-Stilbene oxide induces expression of genes involved in metabolism and transport in mouse liver via CAR and Nrf2 transcription factors. Mol Pharmacol 69:1554–1563 [DOI] [PubMed] [Google Scholar]
- Soars MG, Petullo DM, Eckstein JA, Kasper SC, Wrighton SA. (2004) An assessment of UDP-glucuronosyltransferase induction using primary human hepatocytes. Drug Metab Dispos 32:140–148 [DOI] [PubMed] [Google Scholar]
- Staudinger J, Liu Y, Madan A, Habeebu S, Klaassen CD. (2001a) Coordinate regulation of xenobiotic and bile acid homeostasis by pregnane X receptor. Drug Metab Dispos 29:1467–1472 [PubMed] [Google Scholar]
- Staudinger JL, Goodwin B, Jones SA, Hawkins-Brown D, MacKenzie KI, LaTour A, Liu Y, Klaassen CD, Brown KK, Reinhard J, Willson TM, Koller BH, Kliewer SA. (2001b) The nuclear receptor PXR is a lithocholic acid sensor that protects against liver toxicity. Proc Natl Acad Sci USA 98:3369–3374 [DOI] [PMC free article] [PubMed] [Google Scholar]
- Ueda A, Hamadeh HK, Webb HK, Yamamoto Y, Sueyoshi T, Afshari CA, Lehmann JM, Negishi M. (2002) Diverse roles of the nuclear orphan receptor CAR in regulating hepatic genes in response to phenobarbital. Mol Pharmacol 61:1–6 [DOI] [PubMed] [Google Scholar]
- Venugopal R, Jaiswal AK. (1996) Nrf1 and Nrf2 positively and c-Fos and Fra1 negatively regulate the human antioxidant response element-mediated expression of NAD(P)H:quinone oxidoreductase1 gene. Proc Natl Acad Sci USA 93:14960–14965 [DOI] [PMC free article] [PubMed] [Google Scholar]
- Wagner M, Halilbasic E, Marschall HU, Zollner G, Fickert P, Langner C, Zatloukal K, Denk H, Trauner M. (2005) CAR and PXR agonists stimulate hepatic bile acid and bilirubin detoxification and elimination pathways in mice. Hepatology 42:420–430 [DOI] [PubMed] [Google Scholar]
- Wang H, Negishi M. (2003) Transcriptional regulation of cytochrome p450 2B genes by nuclear receptors. Curr Drug Metab 4:515–525 [DOI] [PubMed] [Google Scholar]
- Whitlock JP, Jr, Denison MS, Fisher JM, Shen ES. (1989) Induction of hepatic cytochrome P450 gene expression by 2,3,7,8-tetrachlorodibenzo-p-dioxin. Mol Biol Med 6:169–178 [PubMed] [Google Scholar]
- Xu C, Li CY, Kong AN. (2005) Induction of phase I, II and III drug metabolism/transport by xenobiotics. Arch Pharmacol Res 28:249–268 [DOI] [PubMed] [Google Scholar]
- Yeager RL, Reisman SA, Aleksunes LM, Klaassen CD. (2009) Introducing the “TCDD-inducible AhR-Nrf2 gene battery.” Toxicol Sci 111:238–246 [DOI] [PMC free article] [PubMed] [Google Scholar]


