

Abstract
The 5-y survival for cancer patients after diagnosis and treatment is strongly dependent on tumor type. Prostate cancer patients have a >99% chance of survival past 5 y after diagnosis, and pancreatic patients have <6% chance of survival past 5 y. Because each cancer type has its own molecular signaling network, we asked if there are “signatures” embedded in these networks that inform us as to the 5-y survival. In other words, are there statistical metrics of the network that correlate with survival? Furthermore, if there are, can such signatures provide clues to selecting new therapeutic targets? From the Kyoto Encyclopedia of Genes and Genomes Cancer Pathway database we computed several conventional and some less conventional network statistics. In particular we found a correlation (R2 = 0.7) between degree-entropy and 5-y survival based on the Surveillance Epidemiology and End Results database. This correlation suggests that cancers that have a more complex molecular pathway are more refractory than those with less complex molecular pathway. We also found potential new molecular targets for drugs by computing the betweenness—a statistical metric of the centrality of a node—for the molecular networks.
Keywords: network entropy, signaling pathway, degree distribution, prostate cancer, basal cell carcinoma
Standard treatment modalities for cancer include surgery, radiation, and chemotherapy. These therapies are fairly nonspecific, and recently the emphasis has shifted toward molecularly targeted therapies to inhibit important cancer-signaling pathways within tumor cells or essential support cells; for example, imatinib, a tyrosine kinase inhibitor (1), or bevacizumab, a VEGF-blocking antibody (2). Combinations of surgery, radiation, and chemotherapy have been shown to be effective to varying degrees of success (3); however, prediction of cancer survival is difficult (4–6). Simply stated, therapeutic attack involves two inseparable components: benefits and costs. The benefits are realized in terms of the patient survival time or the time to recurrence (disease-free survival), and lesser measures, such as relief of symptoms or tumor-shrinkage rates. The cost can be assessed by the severity and frequency of side effects, including even the development of second cancers. Unfortunately mortality rates for major cancers, despite a few notable exceptions, have not significantly changed over the last few decades (3). Cancer survival is known to vary dramatically as a function of cancer site; for example, breast or prostate cancer patients have a considerably higher probability of surviving 5 y compared with lung or pancreatic cancer patients (6).
In this study, we investigate whether indications of survival probability exist that manifest at the molecular network level. Specifically, we examine if indicators of survival can be extracted by a quantitative and statistical analysis of the molecular networks underlying intracellular signaling pathways for these different cancers. If that is the case, then perhaps careful examination of the relevant network metrics may also provide clues to target these more refractory cancers, or indeed there may be indications about which segments of the molecular pathways are the most important to inhibit. Moreover, in the case of radiotherapy, these insights could give indications, for or against, about the usefulness of proposed dose escalations.
Molecular pathways for a number of cancer sites were examined and network metrics computed, specifically betweenness centrality and degree-entropy. Strikingly, we found that the degree-entropy metric, which is related to network complexity and robustness, is correlated with 5-y survival. Those networks that were found to have the highest degree-entropy were associated with a lower probability of 5-y survival.
Background
Cancer can be viewed as a systems disease with potentially multiple causes for any cancer site (7–9). The behavior of cancer cells is governed and coordinated by biochemical signaling networks that translate external cues—such as hormonal signals, growth factors, or microenvironmental stress—into appropriate biological responses, such as cell growth, proliferation, differentiation, or apoptosis. Therefore, a mechanistic understanding of cell-cycle malfunction during carcinogenesis, cancer progression, and response to treatment, is crucial for optimum drug development and proper drug administration.
The cell is comprised of a huge number of different molecular species interacting in a complex network that is not yet fully understood. Nonetheless, some insights on how specific drugs interact with their molecular targets in the cell are beginning to be elucidated (10, 11). Cancer therapeutic agents currently in clinical use can be divided into several classes according to their mode of action or their molecular targets. For example: alkylating agents, such as cisplatin, which are genotoxic; microtubule-targeting agents, such as paclitaxel, which are antimitotic; antimetabolites, such as methotrexate, which inhibits base synthesis; angiogenesis or immune modulators, such as bevacizumab, which targets VEGF-A; and direct targeting agents, such as imatinib, which is a tyrosine kinase inhibitor (1, 2).
Biochemical networks, such as signaling pathways or metabolic pathways, can also be viewed as concurrent communicating systems. These pathways consist of sequences of interactions, which sometimes affect other parallel pathways. The interactions between the biochemical species can induce or inhibit each other. In many cases, details of these interactions have been worked out by a combination of yeast two-hybrid, affinity pull-down mass spectrometry, or biochemical techniques (12). As an example, consider two pathways involved in the cell cycle. The Ras/Raf pathway, which controls cell proliferation or differentiation, and the PI3K/Akt pathway, which is involved in cell proliferation and survival, are both triggered by the same growth factor. The sequences of interactions in both pathways run concurrently, with some interaction (13).
Many biological networks are observed to be scale-free, as are communication networks, social networks, and other types of networks (14, 15). Scale-free networks are built from collections of a large number of nodes with a small number of connections, and a small number of nodes with a much larger number of connections. The fact that so many networks are scale-free (and actually, such a wealth of diverse phenomena in nature appears to be scale-free) results in some controversy concerning the meaning of scale-free networks in molecular biology (16, 17).
Cellular-molecular interaction networks exist at an edge of chaos (18). These networks are metastable dynamic systems that could, given the right perturbation, either transition to a different state or collapse entirely. This edge of chaos is a result of the large-scale organization of these networks; they are small-worlds or scale-free networks (19). This topology results in networks that are both robust to attack and yet have key nodes that can cause the entire dynamical system, represented by the network, to collapse (20).
Materials and Methods
For some cancer sites, moderately detailed pathway networks have been worked out, and 14 of these cancer pathways are available from the Kyoto Encyclopedia of Genes and Genomes (KEGG) (http://www.genome.jp/kegg/). KEGG PATHWAY is a collection that includes comprehensive pathways manually derived from textbooks, literature, other databases (e.g., National Center for Biotechnology Information), and expert knowledge (21–25). The cancer pathways embed a consensus of information concerning each cancer site, where “cancer site” refers to the tissue or cell type of the primary tumor.
For example, virtually all basal cell carcinomas exhibit dysregulation of the Hedgehog (Hh) pathway (26). Similarly, many basal carcinomas exhibit dysregulation associated with Wnt signaling pathway (27). Consequently, both these pathways are embedded in the basal cell carcinoma pathway network as represented by KEGG. Furthermore, as Daya-Grosjean and Couvé-Privat (26) note, mutations in SHH, PTCH1, and SMO (three genes involved in the Hh pathway) are found in 0–1%, 12–38%, and 6–21%, respectively, of sporadic basal cell carcinomas. Possibly this variation in mutation rates is a result of the varied ploidy among the cancers (28). Consequently, the pathways are comprehensive but obviously cannot represent every ploidy or mutation possible for any given cancer.
Diagrams of the KEGG pathways for the 14 cancer sites are provided in Fig. S1. Each node in these diagrams can be mapped to one or more KEGG GENE entry, meaning that the actual KEGG pathway is more complex and detailed than represented on the diagrams. As can be observed in the KEGG pathways, some segments of individual pathways have built-in redundancies, which means that there are multiple parallel arrows originating from a signaling molecule, for example in the crucial p53 pathway. A potential advantage of these redundancies is to offer robustness to the system when it is subjected to stress or assault.
Other pathway databases, such as BioCyc (http://biocyc.org/), Reactome (http://www.reactome.org/), and BioGRID (http://thebiogrid.org/) were not suitable for this study because they do not include pathways that correspond directly to a specific cancer site, which is required information to perform a correlation with the cancer survival data. Hopefully efforts will be made in the future to address this issue. For example, the BioCyc database (HumanCyc subset) includes the “MAP kinase cascade” pathway, which is known to play a critical role in the development and progression of cancer (29); however, BioCyc does not associate this signaling pathway with a specific cancer site (such as lung or pancreatic cancer). Similarly, BioGRID includes the cancer-related pathways “Signaling by EGFR in Cancer (Homo sapiens)” and “p53-Dependent G1/S DNA damage checkpoint (Homo sapiens),” but these also are not associated with specific cancer sites.
The KEGG cancer pathways were downloaded as KGML files from the KEGG PATHWAY database (http://www.genome.jp/kegg/pathway.html). The next step was to generate a mathematical graph representation of the pathway. In the graph representation, each protein is associated with a node (also known as a vertex), and interactions between proteins are associated with edges (connections between pairs of nodes). To generate the actual list of edges (the adjacency list), an external package not provided by KEGG was used, the KEGGgraph package (KEGGgraph can be downloaded from the Bioconductor Web site, http://www.bioconductor.org/) (30). The pathways in KEGG have directional connections (i.e., separate incoming and outgoing paths); however, this information was not required for the computation of the network metrics, and therefore the directionality information was discarded and undirected graphs were generated. The pathway diagrams shown in KEGG sometimes include nodes representing nonprotein molecules, such as DNA; however, those nodes were not present in the KGML files. This process effectively generated a protein–protein interaction network (31) for each cancer site. Fig. 1 shows the resulting basal cell carcinoma pathway as a protein–protein interaction network with the nodes identified by Human Gene Nomenclature Committee (HGNC) gene symbols (http://www.genenames.org/). It is important to note the protein interactions in the KEGG pathways are not always at the level of detail of binary molecular interactions. In the example of the basal cell carcinoma illustrated in Fig. 1, the nodes in the Wnt and Frizzled pathways (WNT1, WNT2, FZD1, and so forth) are represented in the KEGG pathway as each being connected to many other nodes in these two pathways, resulting in the large ring of interconnected nodes, which can be seen in the center of the interaction network. In effect, this means that in the KEGG pathway data the actual molecular interactions between some proteins are not represented.
Fig. 1.

Protein–protein interaction network for basal cell carcinoma as constructed from the KEGG pathway processed by KEGGgraph. Node labels are HGNC gene symbols. Yellow nodes are the top three highest in betweenness centrality.
In addition to the cancer pathways from KEGG, we accessed 5-y survival statistics from the Surveillance Epidemiology and End Results (SEER) Program database (http://seer.cancer.gov/), which is a resource for epidemiological data compiled by the National Cancer Institute as a service to researchers and physicians. The number of KEGG cancer pathways is relatively small compared with the number of cancer sites available in the SEER data because of the fact that, as of yet, not all cancers have detailed pathway information compiled. Only the survival statistics for the 14 cancer sites corresponding to the KEGG cancer pathways were used.
Molecular networks, such as protein–protein interaction networks and gene networks, can be analyzed using statistical mechanics techniques developed by physicists for the study of complex networks, such as social networks and communication networks, in addition to biological networks (32). A general review monograph is Dorogovtsev and Mendes (33), and from a more biological perspective, Junker and Schreiber (34). Many network metrics have been defined including degree distribution (a histogram of the number of connections to the nodes) (32), entropy (a measure of the complexity of the network) (35), cluster coefficient (another measure of complexity) (32), betweenness centrality (a measure of the extent that a node lays on the paths between other nodes) (14), path length (the number of edges or links between two, perhaps distant, nodes) (32), and diameter (the path length between the two most distant nodes) (32). Our analysis focused only on betweenness centrality and degree-entropy.
Betweenness centrality, or simply betweenness (denoted  ), is a network topology metric and a measure of the centrality of a node,
  . Specifically, it is the sum of the fractions of shortest paths that pass through
  . The relation is given by
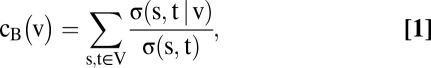 |
where  is the number of shortest paths between two nodes
  and
and  is the number of those paths passing through nodes other than the
  pair (14). In other words, betweenness centrality is a measure of the extent that a node lays on the paths between other nodes. This measure is important because it may indicate the influence within the network that this node plays in controlling information transfer between other nodes.
The second network topology metric we explored was network entropy, specifically degree-entropy, denoted  , which is simply defined as
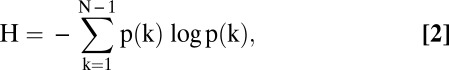 |
where  is the total number of nodes in the network and
  is the degree (number of incident lines) of node
  (35). In words, the degree-entropy provides a measure of the network’s heterogeneity and complexity.
Results and Discussion
Nacher and Schwartz (10), and Yildirim et al. (11), discuss general protein–protein interaction networks and drug targets for a wide variety of diseases. Hornberg et al. (36) discuss networks associated specifically with cancer. All three of these analyses are qualitative. Our interests are not to examine the interaction network for heuristic purposes,but rather to relate a statistical metric of the network to cancer patient survival.
As an example of our study on network degree-entropy, we start by examining the basal cell carcinoma pathway in Fig. 1, which is the protein–protein interaction network as derived from the KEGG pathway network. The network consists of 47 nodes and 310 edges. The nodes with the highest betweenness centrality are GSK3B, CTNNB1, and GLI1. These three proteins are, respectively, a glycogen synthase kinase (GSK3B), a cadherin association protein (CTNNB1), and a zinc-finger transcription factor (GLI1). In particular, GLI1 was reported to be expressed in basal cell carcinoma (37). Because these three proteins have high betweenness centrality in the pathway network, selecting them for drug targeting would be reasonable. Removing them will have profound effects on information processing in the protein–protein interaction. However, because those nodes do not have a high degree, their removal will have little impact on the overall statistics of the network.
Table 1 lists the full set of cancer sites that we investigated. For each cancer site, it gives the SEER patient 5-y survival probability, the degree-entropy (H), the number of nodes and edges in the network, and the top three betweenness centrality nodes (identified by HGNC gene symbols).
Table 1.
Cancer survival probabilities and network statistics for each of the 14 cancer sites in the study
| Cancer site | 5-y survival probability | H | No. of nodes | No. of edges | B1 | B2 | B3 |
| Acute myeloid leukemia | 23.6% | 2.10 | 60 | 170 | FLT3 | SPI1 | JUP |
| Basal cell carcinoma | 91.4% | 1.88 | 55 | 310 | GSK3B | CTNNB1 | GLI1 |
| Bladder cancer | 78.1% | 1.67 | 42 | 46 | MAP2K2 | MAP2K1 | MAPK3 |
| Chronic myeloid leukemia | 55.2% | 2.16 | 73 | 185 | GRB2 | MDM2 | GAB2 |
| Colorectal cancer | 63.6% | 1.80 | 62 | 104 | KRAS | RALGDS | CTNNB1 |
| Endometrial cancer | 68.6% | 1.84 | 52 | 87 | GRB2 | ADARB2 | PDPK1 |
| Glioma | 33.4% | 2.26 | 65 | 189 | EGFR | IGF1R | PDGFRB |
| Melanoma | 91.2% | 1.68 | 71 | 281 | NRAS | MAP2K1 | MAPK3 |
| Nonsmall-cell lung cancer | 18.0% | 2.36 | 54 | 124 | KRAS | RASSF1 | CCND1 |
| Pancreatic cancer | 5.5% | 2.05 | 70 | 137 | KRAS | RALBP1 | JAK1 |
| Prostate cancer | 99.4% | 2.40 | 89 | 295 | GRB2 | GSK3B | AKT1 |
| Renal cell carcinoma | 69.5% | 1.77 | 70 | 109 | GAB1 | RFC1 | MAPK1 |
| Small cell lung cancer | 6.2% | 2.21 | 84 | 219 | NFKBIA | PTK2 | CCND1 |
| Thyroid cancer | 97.2% | 1.48 | 29 | 49 | HRAS | NRAS | KRAS |
The 5-y survival probabilities are from the SEER database. H stands for degree-entropy; the other network statistics are the number of nodes and the number of edges. The columns B1, B2, and B3 give the HGNC gene symbols for the top three betweenness centrality nodes.
Our main finding is the correlation between cancer patient survival probability and entropy; specifically, those networks that are found to have the highest degree-entropy are associated with a lower probability of 5-y survival. With all 14 cancer sites included, the linear correlation is relatively low, with R2 = 0.3. However, prostate cancer is a highly differentiated cancer, very localized, and very slow growing. Prostate cancer has minimal vasculature and is morphologically distinct. For all these reasons, this cancer tends to not behave like most other cancers, and in most studies it is considered as an outlier. With prostate cancer excluded then the linear correlation is improved, with R2 = 0.7. The plot of 5-y survival probability versus degree-entropy, excluding prostate cancer, is shown in Fig. 2, and includes a conservative 10% error bar estimate for 5-y survival probability and 0.1 error bar estimate for degree-entropy. Our rationale for the error bars on entropy is the fact that not all of the details of a network may be known so the entropy may be inaccurate, leading to a systematic error in the estimate. That being said, the remarkably high correlation indicates that the pathway networks are more or less complete. This means that it would be hard to get such a high correlation with random networks or highly incomplete networks.
Fig. 2.

Scatter plot showing the correlation between cancer 5-y survival probability and degree-entropy. Datapoints are shown for 13 cancer sites, including all of the cancer sites with KEGG pathways, except prostate cancer. The x axis is the 5-y survival probability for the cancer site, from the SEER database. The y axis is the degree-entropy (H) for the cancer site, calculated from the KEGG pathway. The line is a linear regression fit, with R2 = 0.7. The error bars are set at fixed estimates of the error, with the x axis error bars fixed at ±10% and the y axis error bars fixed at ±0.1.
To confirm that the correlation was not an artifact we computed the entropy of a population of 1,000 Erdös–Rényi similar-sized random networks (14) and 1,000 similar-sized Barabási scale-free networks (14) for each of the cancer networks. We found statistically no similarity. The P values for the population of similar-sized networks for each cancer for scale-free, random, and real-world networks was <0.0001 in all-way combinations.
Betweenness centrality can help to identify new targets for drugs. The top three betweenness centrality nodes for each cancer pathway are shown in Table 1. The two most frequently occurring nodes in this set are KRAS (four occurrences) and GRB2 (three occurrences). KRAS is a Ras family oncogene and GRB2 is the gene for a growth factor receptor-bound protein.
Because the cancer site pathways in KEGG are human curated, with boundaries defined by the curators (i.e., the decisions about which proteins are included in the pathway and which are excluded are made by the curators), there is a possibility that the extent to which a particular site of cancer has been studied may be biasing the topology of the cancer pathways, and hence confounding any conclusions based on the entropy of the pathways. To test this possibility, a set of PubMed (http://www.ncbi.nlm.nih.gov/pubmed/) literature searches corresponding to each the cancer site in this study were performed (Table S1) and the total numbers of citations was compared with the degree-entropy values (Fig. S2). No correlation between the citation totals and the degree-entropy was observed (R2 = 0.0), which supports the statement that the extent to which a particular type of cancer has been studied is not biasing the results.
A further refinement of the methods used here would be to supplement the KEGG pathway information with more detailed protein interaction information from other data sources, for example BioGrid. The more detailed protein interaction data could be combined with the KEGG data to generate interaction networks where the specific connections between molecules are included in more cases. For example, instead of representing the Wnt and Frizzled pathways with most nodes connecting to most other nodes, the specific binary molecular interactions could be used. Unfortunately the protein–protein interaction network in BioGrid is still not complete for any specific organism. The most thoroughly studied organism is the yeast Saccharomyces cerevisiae, and for that species the interaction network is only about 15% complete (38).
We have demonstrated a correlation between network pathway degree-entropy and 5-y survival probability for a set of cancer sites. This demonstration supports our initial conjecture that there are fundamental molecular pathway indicators, or network metrics, that point to cancer survival. However, because molecular network degree-entropy is a gross statistic, details of what the molecular indicators are require further analysis. For example, we would like a network metric that shows significant change when one node is removed, and further to correlate that metric with survival probabilities for patients who underwent cancer chemotherapy. Nonetheless, the observed correlation between degree-entropy and 5-y survival probability provides some explanation for the observed refractoriness of cancers relative to conventional chemotherapy.
Supplementary Material
Acknowledgments
We thank Philip Winter for technical assistance; Rainer Sachs for reading and commenting on the manuscript; and Lloyd Demetrius for discussions on network entropy that helped to initiate this work. This study was supported in part by the Natural Sciences and Engineering Research Council of Canada (J.A.T.); the Allard Foundation (J.A.T.); Alberta Advanced Education and Technology (J.A.T.); the Canadian Breast Cancer Foundation (J.A.T.); the Alberta Cancer Foundation (J.A.T.); and National Cancer Institute Grant U54CA149233 (to E.R. and L.H.).
Footnotes
The authors declare no conflict of interest.
*This Direct Submission article had a prearranged editor.
This article contains supporting information online at www.pnas.org/lookup/suppl/doi:10.1073/pnas.1201416109/-/DCSupplemental.
References
- 1.MacDonald P. Chemotherapeutic Drugs. In: Scheinemann K, Boyce AE, editors. Emergencies in Pediatric Oncology. New York: Springer; 2012. pp. 105–120. [Google Scholar]
- 2.Kandalaft LE, Motz GT, Busch J, Coukos G. Angiogenesis and the tumor vasculature as antitumor immune modulators: The role of vascular endothelial growth factor and endothelin. Curr Top Microbiol Immunol. 2011;344:129–148. doi: 10.1007/82_2010_95. [DOI] [PubMed] [Google Scholar]
- 3.Marshall E. Cancer research and the $90 billion metaphor. Science. 2011;331:1540–1541. doi: 10.1126/science.331.6024.1540-a. [DOI] [PubMed] [Google Scholar]
- 4.Brenner H. Long-term survival rates of cancer patients achieved by the end of the 20th century: A period analysis. Lancet. 2002;360:1131–1135. doi: 10.1016/S0140-6736(02)11199-8. [DOI] [PubMed] [Google Scholar]
- 5.Ellison LF, Gibbons L. Survival from cancer—Up-to-date predictions using period analysis. Health Rep. 2006;17:19–30. [PubMed] [Google Scholar]
- 6.Jemal A, et al. Cancer statistics, 2009. CA Cancer J Clin. 2009;59:225–249. doi: 10.3322/caac.20006. [DOI] [PubMed] [Google Scholar]
- 7.Hanahan D, Weinberg RA. The hallmarks of cancer. Cell. 2000;100:57–70. doi: 10.1016/s0092-8674(00)81683-9. [DOI] [PubMed] [Google Scholar]
- 8.Sonnenschein C, Soto AM. Theories of carcinogenesis: An emerging perspective. Semin Cancer Biol. 2008;18:372–377. doi: 10.1016/j.semcancer.2008.03.012. [DOI] [PMC free article] [PubMed] [Google Scholar]
- 9.Edelman EJ, Guinney J, Chi JT, Febbo PG, Mukherjee S. Modeling cancer progression via pathway dependencies. PLOS Comput Biol. 2008;4:e28. doi: 10.1371/journal.pcbi.0040028. [DOI] [PMC free article] [PubMed] [Google Scholar]
- 10.Nacher JC, Schwartz JM. A global view of drug-therapy interactions. BMC Pharmacol. 2008;8:5. doi: 10.1186/1471-2210-8-5. [DOI] [PMC free article] [PubMed] [Google Scholar]
- 11.Yildirim MA, Goh KI, Cusick ME, Barabási AL, Vidal M. Drug-target network. Nat Biotechnol. 2007;25:1119–1126. doi: 10.1038/nbt1338. [DOI] [PubMed] [Google Scholar]
- 12.Dreze M, et al. High-quality binary interactome mapping. Methods Enzymol. 2010;470:281–315. doi: 10.1016/S0076-6879(10)70012-4. [DOI] [PubMed] [Google Scholar]
- 13.Moelling K, Schad K, Bosse M, Zimmermann S, Schweneker M. Regulation of Raf-Akt Cross-talk. J Biol Chem. 2002;277:31099–31106. doi: 10.1074/jbc.M111974200. [DOI] [PubMed] [Google Scholar]
- 14.Newman MEJ. Networks: An Introduction. Oxford, UK: Oxford Univ Press; 2010. [Google Scholar]
- 15.Newman MEJ, Barabási AL, Watts DJ. The Structure and Dynamics of Networks. Princeton, NJ: Princeton Univ Press; 2006. [Google Scholar]
- 16.Mason O, Verwoerd M. Graph theory and networks in biology. IET Syst Biol. 2007;1:89–119. doi: 10.1049/iet-syb:20060038. [DOI] [PubMed] [Google Scholar]
- 17.Keller EF. Revisiting “scale-free” networks. Bioessays. 2005;27:1060–1068. doi: 10.1002/bies.20294. [DOI] [PubMed] [Google Scholar]
- 18.Stokić D, Hanel R, Thurner S. Inflation of the edge of chaos in a simple model of gene interaction networks. Phys Rev E Stat Nonlin Soft Matter Phys. 2008;77:061917. doi: 10.1103/PhysRevE.77.061917. [DOI] [PubMed] [Google Scholar]
- 19.Jeong H, Tombor B, Albert R, Oltvai ZN, Barabási AL. The large-scale organization of metabolic networks. Nature. 2000;407:651–654. doi: 10.1038/35036627. [DOI] [PubMed] [Google Scholar]
- 20.Albert R, Jeong H, Barabási AL. Error and attack tolerance of complex networks. Nature. 2000;406:378–382. doi: 10.1038/35019019. [DOI] [PubMed] [Google Scholar]
- 21.Kanehisa M, Goto S. KEGG: Kyoto encyclopedia of genes and genomes. Nucleic Acids Res. 2000;28:27–30. doi: 10.1093/nar/28.1.27. [DOI] [PMC free article] [PubMed] [Google Scholar]
- 22.Kanehisa M, Goto S, Kawashima S, Okuno Y, Hattori M. The KEGG resource for deciphering the genome. Nucleic Acids Res. 2004;32(Database issue):D277–D280. doi: 10.1093/nar/gkh063. [DOI] [PMC free article] [PubMed] [Google Scholar]
- 23.Kanehisa M, et al. From genomics to chemical genomics: New developments in KEGG. Nucleic Acids Res. 2006;34(Database issue):D354–D357. doi: 10.1093/nar/gkj102. [DOI] [PMC free article] [PubMed] [Google Scholar]
- 24.Kanehisa M, Goto S, Furumichi M, Tanabe M, Hirakawa M. KEGG for representation and analysis of molecular networks involving diseases and drugs. Nucleic Acids Res. 2010;38(Database issue):D355–D360. doi: 10.1093/nar/gkp896. [DOI] [PMC free article] [PubMed] [Google Scholar]
- 25.Schaefer CF. Pathway databases. Ann N Y Acad Sci. 2004;1020:77–91. doi: 10.1196/annals.1310.009. [DOI] [PubMed] [Google Scholar]
- 26.Daya-Grosjean L, Couvé-Privat S. Sonic hedgehog signaling in basal cell carcinomas. Cancer Lett. 2005;225:181–192. doi: 10.1016/j.canlet.2004.10.003. [DOI] [PubMed] [Google Scholar]
- 27.Saldanha G, Ghura V, Potter L, Fletcher A. Nuclear beta-catenin in basal cell carcinoma correlates with increased proliferation. Br J Dermatol. 2004;151:157–164. doi: 10.1111/j.1365-2133.2004.06048.x. [DOI] [PubMed] [Google Scholar]
- 28.Herzberg AJ, et al. DNA ploidy of basal cell carcinoma determined by image cytometry of fresh smears. J Cutan Pathol. 1993;20:216–222. doi: 10.1111/j.1600-0560.1993.tb00646.x. [DOI] [PubMed] [Google Scholar]
- 29.Dhillon AS, Hagan S, Rath O, Kolch W. MAP kinase signalling pathways in cancer. Oncogene. 2007;26:3279–3290. doi: 10.1038/sj.onc.1210421. [DOI] [PubMed] [Google Scholar]
- 30.Zhang JD, Wiemann S. KEGGgraph: A graph approach to KEGG PATHWAY in R and bioconductor. Bioinformatics. 2009;25:1470–1471. doi: 10.1093/bioinformatics/btp167. [DOI] [PMC free article] [PubMed] [Google Scholar]
- 31.De Las Rivas J, Fontanillo C. Protein-protein interactions essentials: Key concepts to building and analyzing interactome networks. PLOS Comput Biol. 2010;6:e1000807. doi: 10.1371/journal.pcbi.1000807. [DOI] [PMC free article] [PubMed] [Google Scholar]
- 32.Albert R, Barabási AL. Statistical mechanics of complex networks. Rev Mod Phys. 2002;74:47–97. [Google Scholar]
- 33.Dorogovtsev SN, Mendes JFF. Evolution of Networks: From Biological Nets to the Internet and WWW. Oxford, UK: Oxford Univ Press; 2004. [Google Scholar]
- 34.Junker BH, Schreiber F. Analysis of Biological Networks. New York: Wiley Interscience; 2008. [Google Scholar]
- 35.Wang B, Tang H, Guo C, Xiu Z. Entropy optimization of scale-free networks’ robustness to random failures. Physica A. 2006;363:591–596. [Google Scholar]
- 36.Hornberg JJ, Bruggeman FJ, Westerhoff HV, Lankelma J. Cancer: A systems biology disease. Biosystems. 2006;83:81–90. doi: 10.1016/j.biosystems.2005.05.014. [DOI] [PubMed] [Google Scholar]
- 37.Ghali L, Wong ST, Green J, Tidman N, Quinn AG. Gli1 protein is expressed in basal cell carcinomas, outer root sheath keratinocytes and a subpopulation of mesenchymal cells in normal human skin. J Invest Dermatol. 1999;113:595–599. doi: 10.1046/j.1523-1747.1999.00729.x. [DOI] [PubMed] [Google Scholar]
- 38.Yu H, et al. High-quality binary protein interaction map of the yeast interactome network. Science. 2008;322:104–110. doi: 10.1126/science.1158684. [DOI] [PMC free article] [PubMed] [Google Scholar]
Associated Data
This section collects any data citations, data availability statements, or supplementary materials included in this article.