

Abstract
The expansion of Bantu languages represents one of the most momentous events in the history of Africa. While it is well accepted that Bantu languages spread from their homeland (Cameroon/Nigeria) approximately 5000 years ago (ya), there is no consensus about the timing and geographical routes underlying this expansion. Two main models of Bantu expansion have been suggested: The ‘early-split’ model claims that the most recent ancestor of Eastern languages expanded north of the rainforest towards the Great Lakes region approximately 4000 ya, while the ‘late-split’ model proposes that Eastern languages diversified from Western languages south of the rainforest approximately 2000 ya. Furthermore, it is unclear whether the language dispersal was coupled with the movement of people, raising the question of language shift versus demic diffusion. We use a novel approach taking into account both the spatial and temporal predictions of the two models and formally test these predictions with linguistic and genetic data. Our results show evidence for a demic diffusion in the genetic data, which is confirmed by the correlations between genetic and linguistic distances. While there is little support for the early-split model, the late-split model shows a relatively good fit to the data. Our analyses demonstrate that subsequent contact among languages/populations strongly affected the signal of the initial migration via isolation by distance.
Keywords: human migration, mtDNA, Y chromosome, autosome, lexical data, Bantu
1. Introduction
Bantu represents the largest African language family in terms of number of languages (approx. 500), occupied territory (approx. 9 million km2) and number of speakers (approx. 240 million). Bantu languages are generally thought to have originated approximately 5000 years ago (ya) in the Cameroonian Grassfields area neighbouring Nigeria, and started to spread, possibly together with agricultural technologies [1], through Sub-Saharan Africa as far as Kenya in the east and the Cape in the south [2]. The evolution of the Bantu languages has been suggested as fitting a branching-tree model, but this model does not entirely explain the variation observed in the linguistic data [3]. In addition, the modality of spread of Bantu-speaking peoples across Sub-Saharan Africa has been under debate in various disciplines during the last few decades. Contrasting models for the migration of Bantu-speaking groups have been proposed, sometimes even from studies using the same lexicostatistical dataset (cf. [4,5]). The major debate concerns the spatial and temporal dispersal of Bantu languages in Sub-Saharan Africa. One hypothesis states that Bantu languages split at an early stage (approx. 4000 ya) north of the rainforest, from which the Western and Eastern Bantu languages are derived as two primary branches [4,6–9]. A contrasting hypothesis argues that there was a major migration to the south of the rainforest, with a later split of the Eastern Bantu languages from the Western group only approximately 2000 ya [5,10–12]. We here call the former the ‘early-split’ and the latter the ‘late-split’ model (figure 1). For a detailed overview of the historical linguistic and molecular anthropological insights into the Bantu expansions, see [13].
Figure 1.

The two main models of Bantu migrations. The current area occupied by Bantu languages is shaded in grey, and the extent of the rainforest is indicated by the darker shading. (a) Early-split and (b) late-split.
The expansion of Bantu-speaking peoples is not only debated with regard to the underlying events and the route(s) taken, but also whether the spread of the languages took place as the result of ‘demic diffusion’ via an actual movement of people [1], or whether it was rather a cultural diffusion involving the movement of languages via ‘language shift’ [14] without concomitant gene flow. Genetic studies have highlighted the strong demographic impact of the Bantu migration on the gene pool of Sub-Saharan African populations for mtDNA [15,16], the Y chromosome [17,18] and autosomes [19,20]. However, a recent study by Sikora et al. [21] of approximately 2800 autosomal single nucleotide polymorphisms suggested that the spread of Bantu languages to southeastern Africa (i.e. Mozambique) involved language shift rather than a movement of people, thus revitalizing the debate concerning demic diffusion versus language shift.
In this study, genetic markers and linguistic data are used together for the first time to shed light on the dispersal of Bantu languages and peoples in Sub-Saharan Africa. The study addresses two major questions. (i) We examine whether the expansion of Bantu languages was a cultural dispersal (i.e. language shift) or a joint movement of languages and people (i.e. demic diffusion) by using data from mitochondrial DNA (mtDNA), Y-chromosomal and autosomal markers. The demic diffusion model predicts that the genetic distances among populations speaking Bantu languages should be lower than those between Bantu-speaking populations and populations speaking other languages, whereas the cultural dispersal model predicts no consistent differences in the genetic distances among Bantu-speaking populations versus between Bantu-speaking populations and those speaking other languages. (ii) We test the two most commonly cited models for the Bantu expansion: the early-split versus the late-split model. For this purpose, we use an alternative method to previous linguistic studies that reconstructed models of expansion only from trees (or networks) of languages based on a quantitative comparison of Bantu lexical cognates [4,5]. Our method uses the migration distances between populations predicted by the early-split and late-split models, and correlates these distances with both linguistic and genetic distances. A third model of expansion (isolation by distance, IBD) is included as an alternative explanation to test whether recent migration or language contact may have played a role in the expansion of the Bantu languages.
2. Material and methods
(a). Genetic data and analyses
We compiled genetic datasets from published data for African populations with a sample size of at least 10 chromosomes. The mtDNA dataset consisted of 5018 sequences of the first hypervariable segment, the Y chromosome dataset contained the 2445 individuals analysed by de Filippo et al. [18], while for the autosomes we used the set of 848 short tandem repeat (STR) loci published by Tishkoff et al. [19], from which we excluded STRs and individuals with a high amount of missing data. For further details, see the electronic supplementary material. The Pygmy populations, who are known to have adopted the languages of their neighbours (e.g. Bantu [22,23]), were considered as a separate group and excluded from the Bantu-speaking groups when testing the models of Bantu migrations. Table 1 shows the number of populations for the major linguistic and ethnic groups covered for each genetic marker (listed individually in the electronic supplementary material, tables S1–S3). We calculated pairwise population genetic distances appropriate for each type of genetic marker—ΦST for mtDNA (mt-ΦST), RST for autosomes (A-RST), and the Y chromosome (Y-RST) and FST for the Y chromosome (Y-FST; see electronic supplementary material for details)—as well as population-specific measures of diversity (haplotype diversity and expected heterozygosity for haploid and diploid markers, respectively), by means of in-house R scripts. Although these measures of genetic diversity are corrected for the sample size, the standard deviation associated with them is inversely related to the sample size. Therefore, values of genetic diversity were also calculated as the average of 1000 bootstraps of 10 chromosomes to take into account sample size heterogeneity.
Table 1.
Number of populations for each ethnolinguistic group and genetic marker considered.
| groups | genetic marker |
||
|---|---|---|---|
| autosomes | mtDNA | Y chromosome | |
| Bantu | 33 | 48 | 48 |
| Niger-Congo | 17 | 17 | 12 |
| Afro-Asiatic | 28 | 7 | 2 |
| Nilo-Saharan | 28 | 5 | 2 |
| Khoisan | 4 | 7 | 2 |
| Pygmy | 5 | 12 | 4 |
(b). Linguistic data and analyses
The linguistic dataset used in this study consists of lists of 92 basic words for 412 Bantu languages (figure 2a; electronic supplementary material, table S4), taken largely from Bastin et al. [9]. We calculated linguistic distances among languages as patristic distances from the trees generated with Bayesian phylogenetic methods in order to take into account heterogeneity of replacement rates across words and rate changes of the same word over time [25]. Specifically, BayesPhylogenies v. 1.1 [26] was used to generate a total of 7200 trees, considering a two-state character covarion model, which has the highest likelihood (electronic supplementary material, figure S1). Patristic distances were calculated for each tree and for the consensus tree reflecting the median of the branch-length distributions by means of the Python library DendroPy [27].
Figure 2.

Sampling locations of the 412 Bantu languages considered in this study (a). The letters correspond to Guthrie's major zones [24]. (b) The small maps show the location of the languages that can be associated to populations for which mtDNA, Y-chromosomal and autosomal data are available.
The closest related language/dialect was chosen as corresponding to the genetic data for those populations whose language was not present in the linguistic dataset, resulting in both linguistic and genetic data for 36 populations for mtDNA, 34 populations for the Y chromosome and 21 populations for the autosomes (figure 2b; electronic supplementary material, table S5). See the electronic supplementary material for more details and explanations.
(c). Model-based geographical distances
In order to calculate the model-based geographical distances between Bantu-speaking populations, we grouped the Bantu languages and populations according to the Bantu classification proposed by Vansina [28], with some modifications. Languages were assigned to 13 different groups (electronic supplementary material, figure S2): Bantoid, Boan-Lebonya, Buneya and North-West representing the ‘North’ meta-group; East-Central, East-Coastal, East-Great Lakes, East-Kilimanjaro, East-South and East-Southeast representing the ‘East’ meta-group; West-Coastal, West-Congo Basin and West-Southwest representing the ‘West’ meta-group. The ‘East’ and the ‘West’ meta-groups are more closely related to each other than to the ‘North’ meta-group [7,11,28]. Based on this classification the geographical distances were calculated as predicted from both early-split and late-split models (see electronic supplementary material, figure S3). Geographical distances based on the IBD model were calculated as great-circle distances between two populations/languages.
(d). Data analysis
Mantel tests (Z) based on Spearman rank correlations were carried out between matrices of linguistic distances and matrices of geographical distances, in order to generate a distribution of correlation coefficients between the linguistic trees and the models of Bantu migrations. Differences between distributions were tested by a two-tailed Mann–Whitney U (MWU) test. Mantel tests with 10 000 permutations were carried out between matrices of linguistic distances (in this case based on the consensus tree; see electronic supplementary material), geographical distances generated according to the early-split, late-split and IBD models, and genetic distances. Spearman rank correlations (ρ) were calculated for the filtered distances (using only the informative pairwise comparisons, as described in the electronic supplementary material), given that these were not matrix-like anymore. In addition, to check for the effect that one model might have on the correlation observed between another model and the lexical distances, partial Mantel tests (Zp) based on Spearman rank correlations with 10 000 permutations were carried out. Unless stated differently, all p-values were corrected for multiple test hypotheses [29].
3. Results
(a). Demic diffusion versus language shift
After a demic diffusion, the genetic differences among populations speaking the same or related language(s) are expected to be lower than those among individuals or populations speaking different or only distantly related language(s). Conversely, with cultural dispersal and language shift, the genetic differences among populations speaking the dispersing language(s) are not expected to be lower than genetic differences between such populations and geographically proximate populations speaking different languages. With this expectation, we tested whether the expansion of Bantu languages was accompanied by an actual movement of people. Figure 3 shows the distributions of genetic distances among Bantu populations alone, and among Bantu versus any of the other major African linguistic phyla and Pygmies. The distributions of genetic distances among all Bantu populations are significantly lower than those between Bantu and any of the other major linguistic phyla for all genetic markers (all MWU tests with one tail p < 10−9), consistent with a demic diffusion. Different patterns were observed when this approach was applied to the other linguistic phyla for all markers, with some exceptions (see electronic supplementary material, figures S4–S6).
Figure 3.

Box plots of the distributions of genetic distances between Bantu (dark grey) and any of the other major linguistic and ethnic groups (light grey). B, Bantu; NC, Niger-Congo non-Bantu; AA, Afro-Asiatic; NS, Nilo-Saharan; KS, Khoisan; PY, Pygmies. (a) mtDNA, (b) Y chromosome and (c) autosomes.
(b). Patterns of genetic diversity as distance from the Bantu homeland
When population diversity levels were calculated without taking into account heterogeneity in population size, no significant trends for all genetic markers were observed as a function of distance from the Bantu homeland. In contrast, after correcting for sample size effects, mtDNA and Y-chromosomal haplotype diversity decreased significantly with increasing distance from the Bantu homeland, while expected heterozygosity based on autosomal loci did not show any significant pattern (figure 4). These reductions of genetic diversity as a function of geographical distance from the homeland further supports the demic diffusion of Bantu-speaking people.
Figure 4.

Genetic diversities as a function of geographical distances from the Bantu homeland according to the IBD model. Open squares in grey represent uncorrected values, in black corrected values with 1000 bootstraps. The lines are fitted with a linear model for the IBD (thicker lines), early-split (dashed lines) and late-split (thinner lines). In each plot the correlation coefficient ρ is reported with the p in parenthesis for the best-fitting migration model: IBD. (a) mtDNA, (b) Y chromosome and (c) autosomes.
(c). Languages and models of migrations
Three different matrices of great circle geographical distances among languages were calculated to represent the three models of the Bantu migration investigated here, namely the early-split, late-split and the simple IBD model. Figure 5 shows an example of geographical distances between an Eastern and a Western Bantu language calculated according to the three models. Overall there was a high correlation among the models (mean Z = 0.70, all p < 10−5; see electronic supplementary material, table S6) because the early-split and late-split models do not have different predictions for 43 per cent of the pairwise comparisons (see electronic supplementary material, figure S3c). Although it is difficult to avoid collinearity among models, with ‘informative’ distances, which show large differences between the early-split and late-split models (such as those shown in figure 5), the correlation between these two models was significantly reduced (ρ = 0.31, p < 0.001; electronic supplementary material, table S6).
Figure 5.
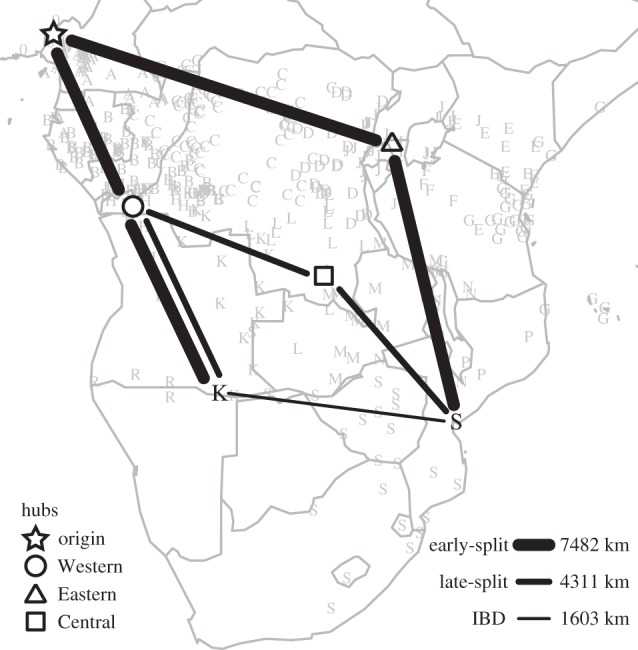
An example of distances between a Western ‘K’ and an Eastern ‘S’ language calculated according to the three models. Four waypoints (or hubs) were used for the calculation of distances according to the early-split and late-split models. See electronic supplementary material and figure S3 for further details.
To test which model, if any, best fits the linguistic differences observed among 412 Bantu languages, we performed correlations between 7200 matrices of linguistic distances and three matrices of geographical distances as predicted by the three models. The results (table 2; electronic supplementary material, figure S7) indicate that whereas all models are significantly correlated with the linguistic distances, the IBD model consistently shows the highest correlation and the early-split model consistently shows the lowest correlation, which is strikingly reduced when only informative comparisons are considered. Moreover, there was also a significant partial correlation of both the early-split and late-split models with the linguistic distances when keeping the IBD model constant (Zp = 0.15 and 0.13, both with one tail corrected p < 0.002).
Table 2.
Correlations between the distribution of linguistic distances and models of Bantu migration using all (Mantel test Z) and only ‘informative’ (Spearman correlation ρ) pairwise comparisons. All pairwise comparisons of correlation distributions (electronic supplementary material, figure S6) are significantly different (all MWU tests with p < 10−16).
| correlation | models of migration |
||
|---|---|---|---|
| IBD | late-split | early-split | |
| Z (90% CI) | 0.602 (0.550–0.658) | 0.510 (0.446–0.618) | 0.492 (0.425–0.569) |
| ρ (90% CI) | 0.603 (0.499–0.656) | 0.436 (0.371–0.521) | 0.303 (0.186–0.394) |
(d). Genes, languages and models of Bantu migration
Mantel tests were also carried out between the geographical distances predicted by the three models of Bantu expansion and genetic distances. The results (figure 6) indicate that mt-ΦST and A-RST distances best correlate with the IBD model, while Y-RST and Y-FST distances best correlate with the late-split model. The early-split model exhibits the lowest correlation for all genetic markers—similar to the pattern observed for the linguistic data—and no significant correlation for Y-chromosomal distances.
Figure 6.
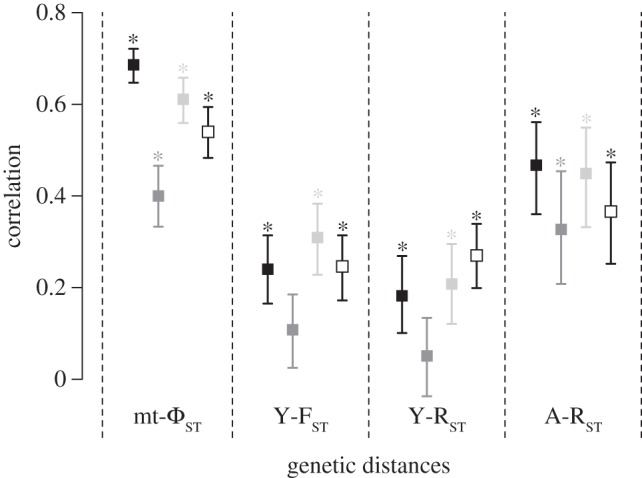
Correlations (Mantel tests Z) of genetic distances with the geographical distances predicted by the migration models (IBD in black, early-split in grey, late-split in light grey) and with the linguistic distances (in white). The bars of each correlation coefficient represent the 95% CIs generated with 1000 bootstraps. On top of the bar, the asterisk indicates p-values less than 0.05 after correction for multiple tests.
All three genetic markers show significant correlations with the linguistic distances (figure 6), with the highest correlation for mt-ΦST (Z = 0.54), intermediate for A-RST (Z = 0.37), and lowest for both Y-FST and Y-RST (Z = 0.27 and 0.25, respectively). These correlations of ‘genes’ with languages as well as with geographical distances further support the hypothesis of a demic diffusion of Bantu-speaking people.
Table 3 reports all partial Mantel tests that were carried out between linguistic and genetic distances by keeping constant as a control a matrix of the geographical distances predicted by a particular model of Bantu migration. Both mtDNA and the Y-chromosomal distances are significantly correlated with linguistic distances, in contrast to the autosomal distances, which are not correlated at all with linguistic distances, irrespective of the model of migration.
Table 3.
Partial Mantel test between lexical and genetic distances by keeping constant one model of Bantu migrations.
| models of migration (constant matrix) |
|||
|---|---|---|---|
| genetic distance | IBD | late-split | early-split |
| mt-ΦST | 0.113 | 0.240** | 0.418** |
| Y-FST | 0.144 | 0.209 | 0.222** |
| Y-RST | 0.207* | 0.196* | 0.272** |
| A-RST | 0.003 | 0.041 | 0.183 |
*p < 0.01 without correction for multiple tests.
**p < 0.01 with correction for multiple tests.
4. Discussion
(a). Demic diffusion of Bantu-speaking peoples
In this study, we consider for the first time both haploid and diploid markers to test whether the dispersal of Bantu languages in Sub-Saharan Africa was coupled with the movement of people (demic diffusion) or whether it was the result of language shift. Our comparison of the genetic distances among Bantu populations with those of Bantu versus all other linguistic and ethnic groups (figure 3) indicates that even geographically distant Bantu-speaking populations are closely related to each other, as expected with demic diffusion, and argues against a major role for language shift in the Bantu expansion.
The other African ethnolinguistic groups, on the other hand, do not show a similar degree of genetic proximity between populations regardless of the geographical distance separating them (see electronic supplementary material, figures S4–S6). This probably reflects complex demographic histories represented by various events of demic diffusion, language shift and/or language/population contact with other groups. Given that these represent much older phylogenetic units than the relatively young Bantu language family, there has been more time for such demographic events to obscure signals of relationship in these phyla than in the Bantu family.
In addition, the positive correlations ascertained between linguistic and genetic (as well as geographical) distances support the view that the Bantu expansion was a combined movement of languages and genes through Sub-Saharan Africa. Such associations among genetic, linguistic and geographical distances were also found at a finer geographical scale among Austronesian-speaking populations in the eastern Indonesian island of Sumba [30] and in Northern Island Melanesia [31]. Our results thus confirm the general view of anthropological genetics that the Bantu expansion took place via a demic diffusion [1,15,18–20], although they contrast with the results of Sikora et al. [21]. However, this discrepancy could be explained by the fact that Sikora et al. used a very different dataset (only one Eastern and two Southeastern Bantu populations) than we do here.
Further support for a demic diffusion is found in the significant reduction of genetic diversity that is proportional to the distance from the Bantu homeland (figure 4). These reductions of diversity levels were stronger for mtDNA than for the Y chromosome, suggesting a different history of men and women during the Bantu migrations. The lack of reduction in autosomal diversity probably reflects the severe lack of Bantu-speaking populations in this dataset, especially in south-central Africa (cf. figure 2b). Interestingly, the stronger reduction in mtDNA diversity contradicts the idea that the patrilocal Bantu-speaking peoples would have incorporated local women during their migrations (cf. [13]). However, given that mtDNA and the Y chromosome are basically single loci with different mutation rates it is difficult to disentangle the effects of stochasticity from demographic events. In addition, the sparse sampling of Bantu populations in general, and the mismatch between the availability of mtDNA versus Y-chromosomal data in particular (figure 2), precludes any definitive conclusions about the nature of the Bantu migrations. More research is thus needed to disentangle the complex history of the Bantu expansion.
(b). Model of expansion and contact among Bantu
The spatial and temporal dynamics of the Bantu expansion have also been debated. Based on phylogenetic trees constructed from lexical data, different theories have been suggested for the dispersal of Bantu languages through Sub-Saharan Africa (cf. [4,5]). These theories can be summarized via two core models that we called here the early-split and late-split models (figure 1). Contrary to previous studies, we also include in our analyses a simple IBD model, which is expected to hold if there is ongoing contact between populations that is mediated by the geographical distance between them. Our results clearly indicate that the IBD model best explains the observed pattern of linguistic differences, while the early-split model shows the worst fit (table 2 and electronic supplementary material, figure S7). However, both the late-split and early-split models correlate with linguistic distances even after controlling for the effect of IBD. Nevertheless, in all of our analyses the early-split model consistently receives the least support, as also found by Alves et al. [32]. Furthermore, there is much variation in the linguistic and genetic distances that is not explained when including the early-split distances in the analyses (table 3), and the early-split model shows no significant correlation with the Y-chromosomal data. However, these results should be viewed with caution given that there is controversy on the validity of partial Mantel tests [33,34].
This apparent difference among genetic markers does not reflect differences in the populations sampled for each type of marker. Indeed, when using only the same languages as the populations considered for the Y chromosome, the correlation between linguistic distances and migration models (electronic supplementary material, table S7) showed the same pattern as for the entire linguistic dataset (table 2). In addition, when using only the 21 populations for which both mtDNA and Y-chromosomal data are available, the highest correlations were again with the IBD and late-split model, respectively (see electronic supplementary material, table S8).
Interestingly, there were no significant correlations between mt-ΦST and either Y- FST (Z = 0.13, p = 0.15) or Y-RST (Z = 0.01, p = 0.42). This could indicate that Bantu-speaking women have a different history than Bantu-speaking men, as also suggested by the different correlations between the genetic markers and the migration models, and in accordance with a previous study [35] that found a higher effective population size and migration rate of females than males in Bantu-speaking populations.
The finding that the linguistic and genetic data best fit the IBD model might indicate that the diffusion of the Bantu languages was a gradual process of dialectal diversification, with changes taking place at a small scale and spreading locally through contact. However, this scenario of a slow and gradual process of diversification over short distances does not fit well with the evidence for a demic migration apparent in the reduction of diversity values for the genetic markers, nor with the low genetic distance values among geographically distant Bantu groups. An alternative explanation could be that the signal of the initial migration(s) might have been attenuated by later contact among peoples and languages, as suggested by previous genetic studies of mtDNA [35,36], Y-chromosomal [18] and autosomal [32] markers. This hypothesis finds some support in our data, since the linguistic distances between Eastern and Western languages belonging to adjacent Guthrie's zones (such as K versus M) are significantly smaller compared with those of non-adjacent zones (such as H-R versus G-P, K versus G-P and H-R versus M; all MWUs with one tail p < 10−14; data not shown).
Since lexical data might be very susceptible to contact pressure, while structural features are considered to be more stable (cf. summary in [37]) [38], we applied our method to eight structural features reported for 66 Bantu languages [38]. However, we do not find any correlation between the structural linguistic distances and the geographical distances predicted by any model of migration. This probably reflects the paucity of structural data available for the Bantu languages together with the absence of variation in such data [38]. Therefore, more informative structural data, comparable with those collected by Reesink et al. [39], would be needed to investigate the complex expansion history of the Bantu languages.
5. Conclusions
Our analyses primarily indicate that the dispersal of Bantu languages was coupled with the movement of people (i.e. demic diffusion), as demonstrated by the lower genetic distances among Bantu populations when compared with those between Bantu and all the other major ethnolinguistic groups, as well as by the reduction of mtDNA and Y-chromosomal diversity proportional to the distance from the Bantu homeland. Furthermore, we found strong correlations between genetic and linguistic (as well as geographical) distances as additional evidence of a demic diffusion. With regard to the geographical routes underlying the Bantu expansion, our analyses indicate that the early-split model, which postulates an initial split into Eastern and Western Bantu languages approximately 4000 ya, finds little support in the lexical and genetic data. In contrast, the late-split model of the Bantu expansion, which proposes a relatively recent development of the Eastern Bantu languages out of Western Bantu, fits the data better. However, as evidenced by the strong correlation of the IBD model with both the lexical and the genetic data, it is clear that subsequent contact between Bantu languages [2,3,7,40] and populations [18] has strongly affected the signal of the initial migration. Furthermore, the low coverage of Bantu-speaking populations—especially from eastern, central and southern Africa—makes the conclusions tenuous; it would therefore be highly desirable to include genetic data from more Bantu-speaking populations to obtain more firmly supported insights into the demographic processes at play in this historical event.
Acknowledgements
We thank Roger Mundry, Michael Dannemann, Hernan A. Burbano and Sean Myles for statistical/programming advice and comments on the manuscript, and Yvonne Bastin, Michael Mann, Chiara Barbieri and Nina Kottenhagen for sharing linguistic and genetic data. We are also grateful to two anonymous reviewers, whose comments helped improve the manuscript. This work was funded by the Max Planck Society (C.d.F., M.S. and B.P.) and the Belgian Science Policy (K.B.).
References
- 1.Diamond J., Bellwood P. 2003. Farmers and their languages: the first expansions. Science 300, 597–603 10.1126/science.1078208 (doi:10.1126/science.1078208) [DOI] [PubMed] [Google Scholar]
- 2.Nurse D., Philippson G. 2003. The Bantu languages. Routledge Language Family Series 4 London, UK: Routledge [Google Scholar]
- 3.Holden C. J., Gray R. D. 2006. Rapid radiation, borrowing and dialect continua in the Bantu languages. In Phylogenetic methods and the prehistory of languages (eds Forster P., Renfrew C.), pp. 19–31 Cambridge, MA: MacDonald Institute for Archaeological Research [Google Scholar]
- 4.Holden C. J. 2002. Bantu language trees reflect the spread of farming across Sub-Saharan Africa: a maximum-parsimony analysis. Proc. R. Soc. Lond. B 269, 793–799 10.1098/rspb.2002.1955 (doi:10.1098/rspb.2002.1955) [DOI] [PMC free article] [PubMed] [Google Scholar]
- 5.Rexová K., Bastin Y., Frynta D. 2006. Cladistic analysis of Bantu languages: a new tree based on combined lexical and grammatical data. Naturwissenschaften 93, 189–194 10.1007/s00114-006-0088-z (doi:10.1007/s00114-006-0088-z) [DOI] [PubMed] [Google Scholar]
- 6.Coupez A., Evrard E., Vansina J. 1975. Classification d'un échantillon de langues bantoues d'après la lexicostatistique. Africana Linguistica 6, 131–158 [Google Scholar]
- 7.Möhlig W. J. 1981. Stratification in the history of the Bantu languages. Sprach. Gesch. Afr. 3, 251–317 [Google Scholar]
- 8.Newman J. L. 1995. The peopling of Africa: a geographic interpretation. New Haven, CT: Yale University Press [Google Scholar]
- 9.Bastin Y., Coupez A., Mann M. 1999. Continuity and divergence in the Bantu languages from a lexicostatistic study. Tervuren, Belgium: Annales, Sciences humaines, Royal Museum for Central Africa [Google Scholar]
- 10.Henrici A. 1973. Numerical classification of Bantu languages. Afr. Lang. Stud. 14, 82–104 [Google Scholar]
- 11.Heine B., Hoff H., Vossen R. 1977. Neuere Ergebnisse zur Territorialgeschichte der Bantu. In Zur Sprachgeschichte und Ethnohistorie in Afrika (eds Möhlig W. J., Rottland F., Heine B.), pp. 52–72 Berlin, Germany: Dietrich Reimer [Google Scholar]
- 12.Ehret C. 2001. Bantu expansions: re-envisioning a central problem of early African history. Int. J. Afr. Hist. Stud. 34, 5–27 10.2307/3097285 (doi:10.2307/3097285) [DOI] [Google Scholar]
- 13.Pakendorf B., Bostoen K., de Filippo C. 2011. Molecular perspectives on the Bantu expansion: a synthesis. Lang. Dynam. Change 1, 50–88 10.1163/221058211X570349 (doi:10.1163/221058211X570349) [DOI] [Google Scholar]
- 14.Nichols J. 1997. Modelling ancient population structures and movement in linguistics. Annu. Rev. Anthropol. 26, 359–384 10.1146/annurev.anthro.26.1.359 (doi:10.1146/annurev.anthro.26.1.359) [DOI] [Google Scholar]
- 15.Salas A., Richards M., De la Fe T., Lareu M.-V., Sobrino B., Sánchez-Diz P., Macaulay V., Carracedo A. 2002. The making of the African mtDNA landscape. Am. J. Hum. Genet. 71, 1082–1111 10.1086/344348 (doi:10.1086/344348) [DOI] [PMC free article] [PubMed] [Google Scholar]
- 16.Gignoux C. R., Henn B. M., Mountain J. L. 2011. Rapid, global demographic expansions after the origins of agriculture . Proc. Natl Acad. Sci. USA 108, 6044–6049 10.1073/pnas.0914274108 (doi:10.1073/pnas.0914274108) [DOI] [PMC free article] [PubMed] [Google Scholar]
- 17.Wood E. T., et al. 2005. Contrasting patterns of Y chromosome and mtDNA variation in Africa: Evidence for sex-biased demographic processes. Eur. J. Hum. Genet. 13, 867–876 10.1038/sj.ejhg.5201408 (doi:10.1038/sj.ejhg.5201408) [DOI] [PubMed] [Google Scholar]
- 18.de Filippo C., et al. 2011. Y- chromosomal variation in Sub-Saharan Africa: Insights into the history of Niger-Congo groups. Mol. Biol. Evol. 28, 1255–1269 10.1093/molbev/msq312 (doi:10.1093/molbev/msq312) [DOI] [PMC free article] [PubMed] [Google Scholar]
- 19.Tishkoff S. A., et al. 2009. The genetic structure and history of Africans and African Americans. Science 324, 1035–1044 10.1126/science.1172257 (doi:10.1126/science.1172257) [DOI] [PMC free article] [PubMed] [Google Scholar]
- 20.Henn B. M., et al. 2011. Hunter–gatherer genomic diversity suggests a southern African origin for modern humans. Proc. Natl Acad. Sci. USA 108, 5154–5162 10.1073/pnas.1017511108 (doi:10.1073/pnas.1017511108) [DOI] [PMC free article] [PubMed] [Google Scholar]
- 21.Sikora M., Laayouni H., Calafell F., Comas D., Bertranpetit J. 2011. A genomic analysis identifies a novel component in the genetic structure of Sub-Saharan African populations. Eur. J. Hum. Genet. 19, 84–88 10.1038/ejhg.2010.141 (doi:10.1038/ejhg.2010.141) [DOI] [PMC free article] [PubMed] [Google Scholar]
- 22.Klieman K. A. 2003. ‘The Pygmies were our compass’: Bantu and Batwa in the history of west central Africa, early times to c. 1900 CE. Portsmouth, NH: Heinemann [Google Scholar]
- 23.Blench R. 1999. Are the African Pygmies an ethnographic fiction? In Central African hunter–gatherers in a multidisciplinary perspective (eds Biesbrouck K., Elders S., Rossel G.), pp. 41–60 Leiden, The Netherlands: CNWS [Google Scholar]
- 24.Guthrie M. 1948. The classification of the Bantu languages. London, UK: Oxford University Press for the International African Institute [Google Scholar]
- 25.Pagel M., Atkinson Q. D., Meade A. 2007. Frequency of word-use predicts rates of lexical evolution throughout Indo-European history. Nature 449, 717–720 10.1038/nature06176 (doi:10.1038/nature06176) [DOI] [PubMed] [Google Scholar]
- 26.Pagel M., Meade A. 2004. A phylogenetic mixture model for detecting pattern-heterogeneity in gene sequence or character-state data. Syst. Biol. 53, 571–581 10.1080/10635150490468675 (10.1080/10635150490468675) [DOI] [PubMed] [Google Scholar]
- 27.Sukumaran J., Holder M. T. 2010. Dendropy: a python library for phylogenetic computing. Bioinformatics 26, 1569–1571 10.1093/bioinformatics/btq228 (doi:10.1093/bioinformatics/btq228) [DOI] [PubMed] [Google Scholar]
- 28.Vansina J. 1995. New linguistic evidence and the Bantu expansion. J. Afr. Hist. 36, 173–195 10.1017/S0021853700034101 (doi:10.1017/S0021853700034101) [DOI] [Google Scholar]
- 29.Benjamini Y., Hochberg Y. 1995. Controlling the false discovery rate: a practical and powerful approach to multiple testing. J. R. Stat. Soc. Ser. B Stat. Methodol. 57, 289–300 [Google Scholar]
- 30.Lansing J. S., et al. 2007. Coevolution of languages and genes on the island of Sumba, eastern Indonesia. Proc. Natl Acad. Sci. USA 104, 16 022–16 026 10.1073/pnas.0704451104 (doi:10.1073/pnas.0704451104) [DOI] [PMC free article] [PubMed] [Google Scholar]
- 31.Hunley K., Dunn M., Lindström E., Reesink G., Terrill A., Healy M. E., Koki G., Friedlaender F. R., Friedlaender J. S. 2008. Genetic and linguistic coevolution in Northern Island Melanesia. PLoS Genet. 4, e1000239. 10.1371/journal.pgen.1000239 (doi:10.1371/journal.pgen.1000239) [DOI] [PMC free article] [PubMed] [Google Scholar]
- 32.Alves I., Coelho M., Gignoux C., Damasceno A., Prista A., Rocha J. 2011. Genetic homogeneity across Bantu-speaking groups from Mozambique and Angola challenges early split scenarios between east and west Bantu populations. Hum. Biol. 83, 13–38 10.3378/027.083.0102 (doi:10.3378/027.083.0102). [DOI] [PubMed] [Google Scholar]
- 33.Raufaste N., Rousset F. 2001. Are partial Mantel tests adequate? Evolution 55, 1703–1705 [DOI] [PubMed] [Google Scholar]
- 34.Castellano S., Balletto E. 2002. Is the partial Mantel test inadequate? Evolution 56, 1871–1703 [DOI] [PubMed] [Google Scholar]
- 35.Coelho M., Sequeira F., Luiselli D., Beleza S., Rocha J. 2009. On the edge of Bantu expansions: mtDNA, Y chromosome and lactase persistence genetic variation in southwestern Angola. BMC Evol. Biol. 9, 80. 10.1186/1471-2148-9-80 (doi:10.1186/1471-2148-9-80) [DOI] [PMC free article] [PubMed] [Google Scholar]
- 36.Castrí L., Tofanelli S., Garagnani P., Bini C., Fosella X., Pelotti S., Paoli G., Pettener D., Luiselli D. 2009. MtDNA variability in two Bantu-speaking populations (Shona and Hutu) from eastern Africa: implications for peopling and migration patterns in Sub-Saharan Africa. Am. J. Phys. Anthropol. 140, 302–311 10.1002/ajpa.21070 (doi:10.1002/ajpa.21070) [DOI] [PubMed] [Google Scholar]
- 37.Matras Y. 2009. Language contact. Cambridge, UK: Cambridge University Press [Google Scholar]
- 38.Dunn M., Greenhill S. J., Levinson S. C., Gray R. D. 2011. Evolved structure of language shows lineage-specific trends in word-order universals. Nature 473, 79–82 10.1038/nature09923 (doi:10.1038/nature09923) [DOI] [PubMed] [Google Scholar]
- 39.Reesink G., Singer R., Dunn M. 2009. Explaining the linguistic diversity of Sahul using population models. PLoS Biol. 7, e1000241. 10.1371/journal.pbio.1000241 (doi:10.1371/journal.pbio.1000241) [DOI] [PMC free article] [PubMed] [Google Scholar]
- 40.Bostoen K., Grégoire C. 2007. La question bantoue: bilan et perspectives. Mémoires de la Socíeté de Linguistique de Paris. Nouvelle Série. 15, 73–91 [Google Scholar]