

Abstract
An RNA kissing loop from the Moloney murine leukemia virus (MMLV) exhibits unusual mechanical stability despite having only two intermolecular base pairs. Mutations at this junction have been shown to destabilize genome dimerization, with concomitant reductions in viral packaging efficiency and infectivity. Optical tweezers experiments have shown that it requires as much force to break the MMLV kissing-loop complex as is required to unfold an 11-bp RNA hairpin [Li PTX, Bustamante C, Tinoco I (2006) Proc Natl Acad Sci USA 103:15847–15852]. Using nonequilibrium all-atom molecular dynamics simulations, we have developed a detailed model for the kinetic intermediates of the force-induced dissociation of the MMLV dimerization initiation site kissing loop. Two hundred and eight dissociation events were simulated (approximately 16 μs total simulation time) under conditions of constant applied external force, which we use to construct a Markov state model for kissing-loop dissociation. We find that the complex undergoes a conformational rearrangement, which allows for equal distribution of the applied force among all of the intermolecular hydrogen bonds, which is intrinsically more stable than the sequential unzipping of an ordinary hairpin. Stacking interactions with adjacent, unpaired loop adenines further stabilize the complex by increasing the repair rate of partially broken H-bonds. These stacking interactions are prominently featured in the transition state, which requires additional coordinates orthogonal to the end-to-end extension to be uniquely identified. We propose that these stabilizing features explain the unusual stability of other retroviral kissing-loop complexes such as the HIV dimerization site.
Keywords: force microscopy, Markov models, RNA folding
RNA kissing loops are common structural motifs where two RNA hairpins form intermolecular base pairs between their apical loops (Fig. 1). These molecular rivets are crucial for retroviral genome dimerization due to their high mechanical stability and slow off-rates; mutations that destabilize loop-loop interactions have been shown to result in drastically decreased viral packaging efficiency and lower infectivity rates in vivo (1–4). These crucial intergenome kissing interactions are required before the downstream virion maturation and genome packaging steps can proceed (4). The requirement for a dimeric genome results in greatly increased recombination rates, elevated radiation resistance, and it may prevent wasteful incorporation of host mRNA into viral capsids (5). Destabilization of retroviral kissing loops therefore poses an attractive strategy for future therapeutics; however, we must first understand the physical origin of their extraordinary stability before we can selectively disrupt it.
Fig. 1.

Structure of the H3 2-bp MMLV kissing-loop complex. The sequence and secondary structure of the homodimeric kissing-loop complex is shown at left, with the two intermolecular GC kissing base pairs indicated by the dashed red lines. At right, a view of the experimentally determined NMR structure (PDB ID code 1F5U). The GC bases that form the intermolecular kissing contacts are colored green and blue, respectively; the flanking, unpaired adenine residues are shown in red.
Kissing-loop interactions were first hypothesized to explain unusually stable yeast tRNA dimers (6). The existence of anticodon-anticodon dimers was later confirmed by X-ray crystallography (7). Interestingly, these nonphysiological tRNA complexes were found to be six orders of magnitude more stable than the corresponding trinucleotide duplexes (8). Similarly, the HIV dimerization initiation site (DIS) kissing loop has been shown to be more stable than a canonical duplex of the same sequence under physiological salt conditions (9). Recent single-molecule pulling experiments have shown that even a 2-bp kissing-loop complex from the Moloney murine leukemia virus (MMLV) requires approximately 15 pN of force to dissociate (10), which is comparable to the force required to unfold a tetraloop complete with 11-bp stem. The MMLV kissing loop therefore serves as a convenient, minimal model system for studying retroviral kissing-loop stability.
In this work, we investigate the source of the MMLV kissing loop’s enhanced mechanical stability using a series of nonequilibrium all-atom molecular dynamics simulations with explicit representations of the solvent and salt molecules. To mimic an optical tweezers pulling experiment, a constant external force is applied to induce dissociation within tractable simulation timescales. A total of 208 dissociation trajectories, totaling approximately 16 μs of simulation time, were analyzed to create a detailed kinetic model of the dissociation process. Once calibrated to the simulations, the stochastic model could capture trends that occurred at longer timescales than the input simulation trajectories. We find that a characteristic conformational change allows the MMLV kissing loop to distribute the applied load evenly among all intermolecular hydrogen bonds. In addition, we observe that flanking, unpaired adenine residues enable the efficient repair of partially broken base pairs and are prominently featured at the transition state. These effects collectively decrease the overall dissociation rate by several orders of magnitude as compared to the unzipping of a canonical double helix under the same applied force. These stabilization mechanisms help explain the idiosyncratic sequence-stability relationships common to kissing loop systems in general, such as the curious preference for unpaired, adjacent loop purines.
Results
The 2-bp MMLV kissing loop takes several seconds to dissociate under the experimental conditions of 13.5–30 pN applied force (10). To simulate dissociation events within computationally tractable timescales, we required larger pulling forces than used in the optical tweezers experiments. Consequently, it was necessary to identify a force regime high enough to obtain adequate statistics but low enough to remain relevant to the mechanism at low force. An initial qualitative assessment was obtained using a small number of dissociative simulations over a wide range of external applied forces (100–400 pN). This assessment allowed us to map the kinetic intermediates of the dominant dissociation pathways. Multiple independent simulations over a smaller range of forces (100–250 pN) were then acquired to obtain quantitative transition rates. The results are used to construct a discrete-state, continuous time stochastic model.
Exploratory Simulations.
Initial exploratory simulations revealed that at all simulated forces < 300 pN, a fast conformational rearrangement occurs within the first approximately 100 ps in which the nucleotides at the loop-loop interface undergo an approximately 90° pivoting motion (Fig. 2). The two kissing G-C base pairs are initially perpendicular to the axis of applied force in the NMR structure, forming a coaxially stacked helical junction (Fig. 1). After the rearrangement, a bridging conformation is formed with the G-C base pair hydrogen bonds arranged parallel to the axis of applied force. Interestingly, the unpaired adenine residues (A9 and A9′) also rotate during the conformational rearrangement and remain stacked on both sides of the kissing G-C base pairs (Fig. 2), forming a stack sandwich. This rearrangement is both continuous and force-independent over the force range simulated—indicating a negligibly small activation barrier under the range of forces examined.
Fig. 2.

A universal conformational rearrangement from the coaxially stacked NMR structure (Upper) to bridging form (Lower) is observed within the first approximately 100 ps of all pulling trajectories ≤ 280 pN. Arrows indicate the external applied force, which are applied to only one strand of each double-helical stem. The pivoting of the two intermolecular GC base pairs positions all of the intermolecular hydrogen bonds to be parallel to the axis of applied force, a mechanically stabilizing feature. The unpaired, flanking adenine residues (red) remain stacked in the rearranged bridging form.
Constructing a Discrete-State Stochastic Model for Kissing-Loop Dissociation.
Although the waiting times between conformations transitions were stochastic and force-dependent, the order of events was always the same. This ordered, sequential nature allowed us to construct a discrete-state, continuous-time kinetic model for the events leading up to dissociation. States were identified using simple geometric criteria for intermolecular base pair formation and base stacking (Materials and Methods). Because of the short range of these interactions, they are well-described by memoryless, binary state variables. Only four distinct intermediates were populated from 150–250 pN (Fig. 6A). The unstacking and H-bond-breaking events were essentially instantaneous (< 2 ps) compared to the interevent waiting times (10–100 ns), so each transition is well-described by two-state kinetics.
Fig. 6.

Discrete-state stochastic model for the dissociation of MMLV 2-bp kissing-loop complexes: (A) Stack sandwich complex with both flanking adenine in a stacked conformation. (B) Open-faced complexes with flanking adenines initially unstacked. Intact base pairs are represented by dotted black lines, with the C10-G11′ base pair at top and the G11-C10′ base pair at bottom. Intact stacking interactions with flanking purines are indicated by a solid red line, with A9 at top and A9′ at bottom. The gray arrows indicate which of the two strands of each hairpin stem bears the applied force. Transitions k3a and k-3a are only observed at 100 pN.
This analysis results in a kinetic stepping stone model (Fig. 6) in which transitions are only possible between immediately adjacent states, although recrossing is allowed and there are multiple possible paths from start to finish. If transition probabilities are assumed to only depend on the current state (i.e., memoryless), then the resulting Markov process is characterized by a transition rate matrix Q, as follows:
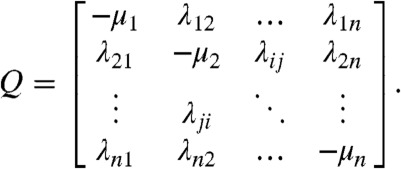 |
[1] |
Here, each off-diagonal element λij is the rate constant for transitions between states i and j; nonallowed transitions have a rate of 0. The diagonal elements μi are the overall transition rate out of state i and are negative by convention (11). The rate matrix therefore contains both the state connectivity (Fig. 6) and the individual transition rates (Table 2), which collectively describe the time evolution of the system. The stochastic nature of individual trajectories is recapitulated by generating a distribution of probable paths connecting the fully intact and fully dissociated states through standard numerical techniques (12). The waiting times for each transition are drawn from random exponential distributions with mean rates specified by Qij. At branchpoints where multiple transitions are possible, only the transition with the smallest randomly generated waiting time is assumed to have actually occurred. This process is repeated iteratively until each realization started at the fully intact state has reached the fully dissociated state.
Table 2.
Microscopic transition rates for the MMLV 2-bp kissing loop as a function of applied force between the states identified in Fig. 6 A and B
| Force | k1a | k - 1a | k1b | k1c | k - 1c | k2 | k-2 | k3a | k-3a | k3b* |
| 250 pN, stacked | 1.0 ± 0.1 × 10⁹ | 8.5 ± 1.1 × 10⁹ | 5.9 ± 0.4 × 10⁸ | — | — | 1.71 ± 0.05 × 10⁸ | 3.92 ± 0.2 × 10⁸ | — | — | 1.7 ± 0.2 × 10⁸ |
| 200 pN, stacked | 1.7 ± 0.3 × 10⁸ | 4.6 ± 0.1 × 10⁹ | 1.9 ± 0.1 × 10⁸ | — | — | 1.00 ± 0.02 × 10⁸† | 1.06 ± 0.02 × 10⁹† | — | — | 1.8 ± 0.1 × 10⁸* |
| 150 pN, stacked | 1.6 ± 0.6 × 10⁸ | 7.5 ± 3.0 × 10⁹ | 3.9 ± 0.4 × 10⁷ | — | — | 2.75 ± 0.08 × 10⁸† | 1.80 ± 0.04 × 10⁹† | — | — | 1.9 ± 0.1 × 10⁸* |
| 100 pN, stacked | 4.2 ± 0.3 × 10⁷ | 1.6 ± 0.1 × 10⁹ | 2.1 ± 0.2 × 10⁷ | — | — | 1.33 ± 0.08 × 10⁸† | 2.16 ± 0.07 × 10⁹† | 3.2 ± 0.1 × 10⁸ | 3.7 ± 0.3 × 10⁹ | 1.8 ± 0.1 × 10⁸* |
| 250 pN, open faced | — | — | — | 4.5 ± 0.2 × 10⁷* | 2.8 ± 0.6 × 10¹⁰ | 1.3 ± 0.1 × 10⁸ | 1.8 ± 0.3 × 10¹⁰ | — | — | 1.2 ± 0.3 × 10¹⁰* |
| 200 pN, open faced | — | — | — | 5.8 ± 0.1 × 10⁷* | 2.4 ± 0.5 × 10¹⁰ | 1.5 ± 0.1 × 10⁸ | 1.3 ± 0.1 × 10¹⁰ | — | — | 6.3 ± 0.1 × 10⁹* |
| 150 pN, open faced | — | — | — | 1.3 ± 0.3 × 10⁷* | 2.6 ± 1.0 × 10¹⁰ | 6.4 ± 0.3 × 10⁷ | 8.3 ± 1.0 × 10⁹ | — | — | 5.2 ± 1.0 × 10⁹* |
Rates with standard deviations were extracted using the maximum likelihood method, assuming each transition is a memoryless single-exponential process. The flanking bases A9 and A9′ are either initially stacked or unstacked (open faced) as indicated.
*Poorly sampled transitions estimated via the recurrence in Table 3 in conjunction with the well-characterized competing transitions k2 and k-2.
†Highly sampled rates extracted by nonlinear least squares fitting.
As we were able to observe only on the order of tens of events with the mapping simulations, the individual waiting times are dominated by stochastic noise. To maximize the signal-to-noise ratio, we switched to a smaller system with truncated helical stems (Fig. 3A). The truncated stems were restrained to remain double stranded despite the large applied force, effectively mimicking a much longer helix. These constraints circumvented the need to isolate the separate force-dependent effects on stem fraying versus kissing-loop dissociation. Twenty dissociation trajectories each at 250, 200, and 150 pN were analyzed to quantify the rates of transition between states (Fig. 4). To facilitate extrapolation to the low-force limit, an additional 20 simulations at 100 pN were acquired for 400 ns each. Although not all trajectories had completely dissociated by 400 ns, there were still sufficient microscopic transitions to characterize the 100-pN rate matrix.
Fig. 3.

Structures of the simplified 2-bp kissing complexes used for quantitative rate calculations. For computational efficiency, the original 7-bp stem of the MMLV kissing-loop complex is replaced with a minimal 2-bp stem. Arrows indicate the external applied force, which are applied to only one strand of each double-helical stem. Stiff distance restraints (orange dashes) are utilized to prevent the stems from fraying—effectively mimicking an infinitely long helix. (Upper) The wild-type complex with intact flanking stacks (in red). (Lower) The open-faced complex with both flanking adenines irreversibly unstacked (red).
Fig. 4.

Survival curves for the dissociation of the 2-bp MMLV kissing complex. Three forces (150, 200, 250 pN) and two starting conformations (stack sandwich and open faced) were simulated with 20 replicates each. Each point indicates the time at which an individual simulation experienced complete dissociation. The stack sandwich conformation has both flanking adenines stacked with the intermolecular CG base pairs, whereas the flanking adenines are irreversibly unstacked in the open-faced starting conformation.
In a true ensemble experiment, we could calculate each entry of our Markovian rate matrix Qij simply by measuring the number of transitions observed between two states i and j divided by the total observation time. However, the simple arrival counting estimate becomes unreliable when dealing with small numbers of events due to increased distortion of the underlying transition rate by random shot noise. However, if we impose a reasonable model for the effects of noise, we can still estimate the most likely rate constant that produced a given set of transitions using fewer observations than required for the arrival counting estimate (see discussion of noise in SI Text). Small sample-size noise is a well-studied problem in the field of population biology (12), so we combined a stochastic version of the pure-death population model (Eq. 4) with maximum likelihood estimation (Eq. 5) as described in Materials and Methods. The resulting rate estimates are robust in that they are not highly skewed by the chance occurrence of a very early or very late event. This analysis can be applied both to the whole dissociation process assuming overall two-state kinetics (Fig. 4 and Table 1), as well as for each transition between Markovian substates (Table 2) in the detailed dissociation model. As we observe frequent back-and-forth shuffling between adjacent states, we also record the recurrence, which we define as the average number of times a particular transition is observed per trajectory (Table 3).
Table 1.
Overall dissociation rates for the MMLV 2-bp kissing loop as a function of applied force
| Simulation | koff(s-1) fit | τ-(ns) fit | koff(s-1) model | τ-(ns) model |
| 250 pN, stacks intact | 2.8 ± 0.3 × 10⁷ | 36 ± 3 | 2.3 ± 0.1 × 10⁷ | 44 ± 2 |
| 200 pN, stacks intact | 9.9 ± 0.9 × 10⁶ | 101 ± 10 | 8.3 ± 0.4 × 10⁶ | 120 ± 5 |
| 150 pN, stacks intact | 5.2 ± 0.4 × 10⁶ | 194 ± 15 | 4.4 ± 0.1 × 10⁶ | 225 ± 6 |
| 100 pN, stacks intact | < 2.1 × 10⁶ | > 470 | 5.3 ± 0.5 × 10⁵* | 1900 ± 70* |
| 250 pN, open faced | 6.4 ± 0.5 × 10⁷ | 16 ± 2 | 3.8 ± 0.3 × 10⁷ | 26 ± 2 |
| 200 pN, open faced | 5.2 ± 0.4 × 10⁷ | 19 ± 2 | 3.4 ± 0.3 × 10⁷ | 29 ± 2 |
| 150 pN, open faced | 3.0 ± 0.3 × 10⁷ | 33 ± 3 | 2.0 ± 0.2 × 10⁷ | 49 ± 3 |
Rates with standard deviations were extracted from observed dissociation events using the maximum likelihood method, assuming single-exponential kinetics. The flanking aromatic loop bases A9 and A9′ are either initially stacked or unstacked (open faced) as indicated.
*Processes extrapolated using a numerical Markov model.
Table 3.
Average number of times a transition is revisited in a single dissociation trajectory between the states identified in Fig. 6 A and B
| Simulation | k1a/-1a | k1b | k1c/-1c | k2/-2 | k3a/-3a | k3b |
| 250 pN, stacked | 0.55 | 1.0 | — | 2.9 | — | 1.0 |
| 200 pN, stacked | 0.35 | 1.0 | — | 6.0 | — | 1.0 |
| 150 pN, stacked | 0.18 | 1.0 | — | 9.2 | — | 1.0 |
| 100 pN, stacked* | 2.8 | 1.0 | — | 12.3 | 3.7 | 1.0 |
| 250 pN, open faced | — | — | 0.35 | 1.5 | — | 1.0 |
| 200 pN, open faced | — | — | 0.4 | 2.0 | — | 1.0 |
| 150 pN, open faced | — | — | 0.2 | 1.6 | — | 1.0 |
The flanking bases A9 and A9′ are either initially stacked or unstacked (open faced) as indicated.
*Processes extrapolated using a numerical Markov model.
Microscopic Dissociation Model for the 2-bp MMLV Kissing Loop.
The pivoting rearrangement of the kissing G-C base pairs to form a bridging complex is force-independent and occurs within the first approximately 100 ps, with both adjacent adenines also rotating to form a stack sandwich. As this transition is both continuous and force-independent, we did not further quantify the rate of this transition. The topmost stack (A9) is then lost in one of two ways; either it transiently unstacks (Fig. 6A, k1a) only to restack shortly thereafter (Fig. 6A, k-1a), or it unstacks in an irreversible manner (Fig. 6A, k1b). Multiple rounds of reversible unstacking and restacking are possible (Fig. 5), but eventually all trajectories pass through the irreversible unstacking transition (Fig. 6A, k1b). The distinction between the two modes of unstacking is that the reversible transition merely involves a small rotation of the chi glycosidic torsion, whereas the irreversible transition involves a concerted rearrangement of sugar and backbone torsions, making restacking entropically unlikely. Once unstacked, the adjacent C10-G11′ base pair is destabilized and breaks (Fig. 6A, k2). This event is also reversible, and is in fact highly likely to break and reform many times (Fig. 5 and Fig. 6A, k-2). The reason A9 unstacks before A9′ and C10-G11′ breaks before G11-C10′ is that the external force is applied to only one strand of each double-helical stem to match the optical tweezers experiment (Fig. 2). It is this asymmetric application of force that creates a preferred order for the two otherwise equivalent base pairs to break. After multiple cycles of breaking and repair of the C10-G11′ base pair, ultimately the G11-C10′ base pair will break (Fig. 6A, k3). This final step is completely irreversible under the conditions of large applied force, and leads to the fully dissociated state.
Fig. 5.

Microstate versus time pathway of two representative dissociation trajectories at 150 pN. State names (abscissa) indicate number of intact base pairs and flanking stacks. The open-faced trajectory (2bp-0s), in which both flanking adenines are unstacked, decays quickly as it is unable to effectively repair broken base pairs. In the stack sandwich conformation (2bp-2s), A9′ must first unstack before any base pairs can be broken. Once unstacking occurs, single base pair breaks are still highly likely to be repaired, leading to many back-and-forth transitions between the 2bp-1s and 1bp-1s states. The 1bp-1s state is stabilized by the presence of the remaining flanking stack (A9).
Of the six total microscopic rate constants shown in Table 2, only three show a clear force-dependence; the initial unstacking of A9 (k1a/1b), the repair rate of the C10-G11′ base pair (k-2), and the breaking of the final base pair (k3). For the initial unstacking event, the rate is inversely proportional to the amount of applied force: At the highest force examined (250 pN), k1b is four times faster than the force-invariant transition k2, whereas at the lowest force examined (150 pN), it is four times slower. Similarly, the breaking of the last base pair (k3) is six times faster than k2 at 250 pN and equal to k2 at 150 pN. Neither of these steps, however, constitutes the rate-limiting step in the low force limit. At all forces examined, the majority of each trajectory is spent breaking and reforming the C10-G11′ base pair, corresponding to transitions k2 and k-2. The average recurrence is inversely proportional to the applied force, and ranges from about 3× at 250 pN to about 8× at 150 pN. As force is lowered, the increased recurrence is entirely due to an increase in the base pair repair rate k-2, as the base pair breaking rate k2 displays no discernible force-dependence. Lower pulling forces therefore do not result in a lowered frequency of bond-breaking attempts; instead it is the increased probability of successfully repairing a broken bond that stabilizes the kissing loop at low forces. The high recurrence of these break-repair cycles defines the rate limiting process for kissing-loop dissociation (Fig. 5).
Stabilizing role of the unpaired, flanking adenines.
As stacking interactions with flanking, unpaired adenine bases are involved in several of the transitions along the dissociation pathway, the question arises exactly how much these stacks contribute to the overall mechanical stability. To answer this question, a separate set of open-faced complexes that lacked the flanking stacks was simulated for comparison. These simulations were started with the two kissing GC base pairs in the bridging conformation, but with both adjacent adenines in an irreversibly unstacked conformation (Fig. 3B). A constant force was applied until dissociation occurred, to examine the intermediates populated (Fig. 6B) and the transition rates between them (Table 3).
The open-faced simulations always dissociated significantly faster than their stacked counterparts at the same force, ranging from two times faster at 250 pN to six times faster at 150 pN (Table 1). There are several systematic differences in the individual transition rates that contribute to this overall trend (Fig. 5). The absence of a stacked A9 means that the C10-G11′ base pair is immediately free to dissociate, whereas in the wild-type stacked simulations there is an initial waiting period for irreversible unstacking to occur before either base pair can break. The dissociation rate of the C10-G11′ base pair (Fig. 6B, k2) is identical to those observed in the stacked simulations (Fig. 6A, k2). However, the lack of a stabilizing stack with A9′ results in an increase in the breaking rate of the G11-C10′ base pair (Fig. 6B, k3) by an order of magnitude. This unstacking also results in greatly diminished recurrence rates for the breaking/reforming of the C10-G11′ base pair (Table 3). At 150 pN, this back-and-forth process only occurs approximately 1.6 times on average for the open-faced complex versus approximately nine times in the case of the fully stacked complex. Finally, in the absence of stacking with A9′, it is occasionally possible for G11-C10′ to break before C10-G11′ (Fig. 6B, k1c). This step is an off-pathway event as G11-C10′ reforms and dissociation ultimately occurs in the same order as observed in the stacked simulations. The unpaired, flanking adenine residues therefore increases the mechanical stability of the kissing complex in multiple ways.
Extrapolation to dissociation rates at lower forces.
To extrapolate our findings to lower forces, we also ran a set of simulations at 100 pN. Under these conditions, it was impractical to simulate until every trajectory achieved complete dissociation; after 400 ns, only 11 of the 20 simulations had experienced complete dissociation. By itself, this calculation would only provide a lower-bound estimate of the true overall dissociation time (Table 1). However, examination of the 11 dissociated trajectories revealed that all of the microscopic transitions were sampled, some as many as 130 times, which allowed us to extract the individual transition rate constants (Table 2). The corresponding Markov model was then numerically simulated to predict an overall lifetime of approximately 1.9 μs at 100 pN.
Two distinct features were observed in the 100 pN dissociation trajectories that were not present at higher forces. The first is that the breaking of the final base pair (G11-C10′) becomes highly reversible because of the stabilizing intermolecular stack seen at the transition state (Fig. 8), resulting in a significant chance for even a complex with zero intact base pairs to reform (Fig. 6, k3a/-3a). This observation provides yet another mechanism by which the flanking stacked adenines are able to enhance the mechanical stability of the kissing complex at lower forces. The other phenomenon of note was the presence of out-of-order transitions. At higher forces, the order of events in Fig. 6 was always strictly obeyed, a consequence of the asymmetric application of force to just one strand of each duplex stem. However, at 100 pN we observed a mirror image dissociation pathway, in which A9′ unstacks first, and G11-C10′ breaks before C10-G11′. Although rare (occurring in only one trajectory), we can hypothesize that at zero force, the normal and mirror image pathways may become equally likely.
Fig. 8.

The observed transition state at 100 pN applied force. This state occurs within step k3 of the kinetic scheme in Fig. 6A, and is found to have nearly a 50-50 chance of dissociating or reforming a doubly base-paired complex when simulated 100 times with different starting velocities.
The accuracy of the stochastic model can be assessed by back-calculating the off-rate for the overall dissociation process and comparing it to the directly observed rates from the molecular dynamics simulations (Table 1). It can be seen that the model preserves all of the trends in the directly observed lifetimes, albeit with a systematic overestimation of approximately 20%. The major source of error lies in the poorly sampled transitions k1a and k1c, which control how frequently trajectories visit an off-pathway intermediate. As both transitions have a recurrence of less than 1 (Table 3) the corresponding rates (Table 2) suffer from a relative uncertainty of 10 to 50%. In contrast, the breaking and reforming the C10-G11′ base pair (k2 and k-2), with a recurrence ranging from three to nine, is extremely well-characterized with a relative uncertainty of only 0.5 to 3%. Uncertainty in the reverse transitions k-1a and k-1c do not significantly affect the overall lifetime because they are not in competition with other transitions. The accuracy of the model increases at lower forces where the majority of the trajectory is spent sampling the transitions with the smallest uncertainty (Fig. 5).
Comparison with experimentally measured off-rates.
Ideally, one would simulate dissociation at the same forces used in the optical tweezers experiments. Unfortunately, it is currently intractable to run all-atom, explicit solvent simulations in the millisecond to second timescale. However, by measuring the off-rates over a range of forces, the scaling of the logarithm of the off-rates as a function of applied force can be directly compared between experiment and simulation. Li et al. found that the MMLV kissing loop is strikingly insensitive to the amount of applied force, resulting in slope of just 0.16 when ln(koff) is plotted against applied force from 13 to 30 pN (10); this slope is an order of magnitude less sensitive than for the force-unfolding of an RNA hairpin. The molecular simulations also predict a very small force-dependence of the off-rate, although with an average slope of 0.027 (from 150–250 pN) it is significantly smaller than that the experimentally measured slope (Fig. 7). At the lowest force examined (100 pN), there is a slight but discernible increase in slope to 0.042.
Fig. 7.

Force-scaling of ln(koff) for the MMLV 2-bp kissing complex. Experimentally observed off-rates are shown in red triangles, with the high-force prediction via Bell’s relation shown as red dashes. The simulation-derived off-rates are shown as blue diamonds.
The simplest model for the force-scaling of bond breakage is Bell’s relation, which assumes that the application of force affects only the height, but not the location of the transition state—effectively tilting the free energy landscape (13). If we assume that a linear Bell-like scaling should hold from 10 to 340 pN (Fig. 7, dotted line), then the experiment only quantitatively agrees with the simulation at the lowest forces examined (100–150 pN). The apparent Bell-like scaling from 100–250 pN is a result of an increasing tendency for the C10-G11′ base pair to break and reform (k2, k-2) at lower forces. This highly recurrent step is controlled by relative rates of the two competing transitions, k-2 and k3b, of which only k-2 appears to obey Bell-like scaling whereas k3b remains constant. The rate-limiting process for MMLV rupture is therefore reversible and not dictated by the height of the single largest barrier, thus violating two key assumptions shared by classical single-bond breakage models.
A more nuanced approach would be to scale the individual microscopic transitions using either Bell’s relation or the generalized force-scaling expressions of Dudko et al. (14). However, closer examination of the transition rates (Table 2) reveals that only k1b appears to obey a Bell-like scaling. The remaining transitions may adhere to a more generalized scaling relationship, but it would require substantially more data as a function of force to extract the curvature parameters. Some particularly problematic transitions do not vary monotonically with increasing force, and therefore would not be compatible even with the most general barrier models (for example, k2 is actually slower at 200 pN than either 250 or 150 pN).
Our findings also indicate additional possible sources of curvature in approaching the low force regime. Prior work has shown that curvature is to be expected when different barriers become rate-limiting at different force regimes (15), or when very large forces induce a shift in the transition state location (16). We find at 100 pN that a previously unobserved intermediate appears (Fig. 6A, k3a, k-3a), which allows for a reversible breaking and repair of the G11-C10′ base pair, whereas as at higher forces only irreversible breaking was observed. The off-rate at 100 pN is consequently slower than would be predicted using Bell’s relation with the 150–250 pN data alone. Additionally, we find the transition state at 150 pN (Fig. 8, discussed below) is force-dependent, as simulations of the same state at 100 pN or 200 pN result in approximately 90% of the trajectories reaching the fully base paired or fully dissociated states, respectively. Finally, we expect that as the force approaches zero, the mirror-image dissociation pathway discussed above should become more likely. Therefore, although we cannot directly probe the gap between the force regimes used in experiment and simulation, our findings strongly indicate that Bell’s relation should not hold from 10 to 300 pN.
Verification of the proposed transition state conformation.
The linear extension at the transition-state ( ) for the force-dissociation of the MMLV kissing loop has been previously determined to be 0.7 nm from analysis of optical tweezers experiments (10). The structural origin of this distance is unclear, as it is too large to reflect an interstitial solvent molecule (17) or an in-place breakage of the intermolecular hydrogen bonds. It was hypothesized that the small
  results from the simultaneous breaking of both kissing base pairs (10), which is difficult to reconcile with the coaxially stacked conformation observed in NMR structure (Fig. 1). We can address this dilemma by determining the geometry of the MMLV complex at the transition-state of our dissociation trajectories.
Once the transition to the bridging form occurs, the H-bonds remain parallel to the applied force for the remainder of the trajectory. The linear extension along the pulling axis can no longer distinguish between fully intact and partially broken complexes, making it a degenerate reaction coordinate. A similar phenomenon was previously identified in analytical models of RNA hairpin unfolding (18), where additional reaction coordinates were required to uniquely identify the transition-state. Instead of relying on linear extension alone, we can identify the transition-state as occurring at the most rate-limiting, force-dependent process in our model. The majority of each trajectory is spent breaking and reforming the C10-G11′ base pair, with the magnitude of the applied force determining the relative probability of C10-G11′ reformation versus irreversible G11-C10′ breakage. The highly recurrent state with C10-G11′ broken and G11-C10′ intact must therefore lie just before the transition-state. Using these criteria, we identified several putative transition states from the dissociation trajectories. The transition-state has, by definition, equal probabilities for complete dissociation or reforming a doubly base-paired complex; i.e., it exists within transition k3. This fact was confirmed by running 100 short (5 ns) simulations of each putative transition-state with different, random initial velocities and 150 pN constant applied force. The conformation shown in Fig. 8 satisfied this criterion with 56/100 trajectories dissociating and 44/100 trajectories forming a doubly base-paired complex; it therefore has a transmission coefficient (19) of 0.56. The observed transition-state exhibits a wide separation of C10 and G11′ as this base pair breaks early in the dissociation process; in contrast G11 and C10′ are significantly closer as it is a very late event. The separation of the C10 and G11′ is approximately 1.1 nm whereas the G11 and C10′ are separated by only 0.6 nm (Fig. 8, dotted lines). The asymmetric separations of the two base pairs simply reflects the preferred breaking order at high forces based on the asymmetric application of force to one strand in each duplex. Significantly, A9′ remains stacked with G11 from the opposing loop; this key intermolecular stacking interaction enables repair of the G11-C10′ base pair at low forces. This stabilization is also reflected in the breaking rate k3 which is an order of magnitude faster in the absence of the flanking A9′ stack (Table 2).
In the optical tweezers experiments, the two hairpins are tethered together with a 30 nucleotide linker; however, the use of a linker is predicted by Berkovitch et al. to result in a force-induced entropic barrier (20) which would complicate reconstruction of the true transition-state. We cannot rule out this possibility, as we did not include a linker in our simulations. Conversely, we find that our predicted transition-state is not uniquely identified by the linear extension alone, which means that agreement with the 0.7 nm result is insufficient to validate our proposed transition-state. Instead of relying on model-specific interpretations of the transition-state, we can directly assess how the proposed transition-state geometry explains the observed scaling of koff with increasing force [i.e., d ln(koff)/dF]. The MMLV complex is characterized by an unusually shallow scaling of lnkoff as force is increased, an order of magnitude less than observed in the unzipping of RNA hairpins (10), or canonical DNA duplexes (21). It is on this basis that Li et al. predict that the intermolecular bonds must be parallel to the applied force at the transition-state, as opposed to the perpendicular conformation seen in the crystal structure (22).
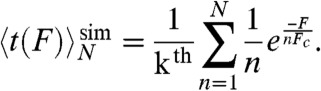
It is instructive to compare the observed force-scaling behavior to simple models of multiple-bond ruptures (13). In the sequential breaking model, the average lifetime of N bonds under load F can be described in terms of the average single-bond lifetime at the same force  , as follows:
| [2] |
The resulting slope d ln(koff)/dF does not depend on N, and in fact is identical to the scaling of a single bond in isolation. Therefore, so long as the force F is above the critical force Fc for a single-bond, the sequential unzipping scenario would result in low mechanical stability and high force-dependence no matter how many bonds are involved. This model describes well the mechanical unzippering of long double-stranded helices, where reformation is negligible due to the large separation between broken base pairs. It has been shown that the entire 48.5 kb λ-DNA will unzip at a rate of 20 to 40 bp per second at a critical force of about 12 pN (21). Similarly, the unzippering of the 22-bp P5ab RNA exhibits a d ln(koff)/dF of about three (23), which is approximately 20 times greater than the value of 0.16 measured for the MMLV kissing loop.
In a parallel bond-breaking scenario, the force is evenly distributed among all intact bonds, resulting in greatly enhanced lifetimes even if the total number of bonds involved is modest. The total parallel bond lifetime is, as follows:
 |
[3] |
Here, kth is the thermal opening rate of a single-bond, n is the number of intact bonds, N is the total number of bonds, and Fc is the critical force of a single-bond. This formula assumes that the dissociation of individual bonds follows Bell’s relation (13), that dissociated bonds do no reassociate, and that the net force experienced by each of the intact bonds is F/n. It can be seen that each bond-breaking event results in an equal redistribution of load to the remaining bonds, and so long as there are n > 1 bonds remaining each will dissociate significantly slower than a single-bond in isolation. This load redistribution results in a much smaller slope d ln(koff)/dF for parallel bond-breaking when compared to sequential bond-breaking for any number of bonds N > 1, even if Bell’s relation is only approximately correct. This behavior can be observed in the open-faced simulations (Table 2), where bond reformation is infrequent and there are no flanking stacks to complicate the mechanism. At all forces examined, breaking the first base pair (k2) while the second base pair remains intact is uniformly two orders of magnitude slower than breaking the second base pair by itself (k3b). This difference in lifetimes is clearly indicative of parallel load-sharing between the two base pairs.
Although the parallel bond model by itself does not account for the additional stabilizing effects of base pair reformation and flanking stacks, it would be difficult explain the extremely shallow scaling of d ln(koff)/dF without invoking redistribution of force among multiple bonds. We observe a spontaneous pivoting of the loop-loop interface in every single trajectory at or below 280 pN of applied force, resulting in both intermolecular G-C base pairs (and their six constituent hydrogen bonds) aligned parallel to the axis of applied force. Therefore, both base pairs will be simultaneously broken at the transition-state at any force in this range—just as hypothesized by Li et al.
Discussion
It has been observed in multiple contexts that kissing loops are more thermodynamically stable than their equivalent duplex sequences (8, 9). The 2-bp MMLV kissing complex comprises the smallest and most striking example of the motif, as the equivalent 2-bp duplex would be too unstable to exist in isolation (24). The MMLV complex requires as much force to dissociate as a hairpin with an 11-bp stem, indicating unusually slow off-rates and high mechanical stability. In this work, we utilized all-atom molecular dynamics simulations to simulate hundreds of dissociation events under constant applied force to examine how the unique architecture of the MMLV kissing loop results in enhanced mechanical stability.
The first finding of note was the fast, barrierless transition from the coaxially stacked conformation found in the NMR structure to the axially elongated bridging conformation. This highly reproducible transition occurs within a few hundred picoseconds at all forces below 280 pN, and results in all intermolecular hydrogen bonds being parallel to the axis of applied force—precisely as hypothesized by Li et al. from analysis of optical tweezers experiments (10). This reorientation of the base pair hydrogen bonds allows the applied load to be redistributed equally among all six hydrogen bonds, similar to how a strong rope is comprised of multiple weak fibers (25). This reorientation is only possible because of the inherent flexibility provided by a kissing-loop junction with unpaired residues in the loop. In contrast, when a stem loop is force-unfolded, the bonds are broken one at a time in an unzipping mechanism (10), as no stabilizing conformational rearrangement is possible. Consequently, for unzipping the off-rate scales linearly with the number of bonds, whereas it scales nonlinearly in case of parallel load sharing (15). Even in the absence of further stabilization from stacking interactions, we find that a 2-bp kissing complex dissociates about 25 times slower than a single base-pair complex at all forces examined. The conformational rearrangement itself is therefore a key determinant of the MMLV kissing loop’s enhanced stability as compared to canonical duplexes.
The second major finding of this work is that the stacking interactions between the kissing base pairs and flanking adenines are able to dramatically decrease the overall dissociation rate of the kissing complex. Mutations in the flanking purines in the 6-bp HIV DIS kissing loop have been shown to reduce the thermodynamic stability of the complex both in vitro and in vivo (26). It has been further speculated that these flanking purines may access alternate conformations not observed in the crystal structure (27), however no mechanism has been proposed to explain how they increase the complex’s stability. We find that the presence of a flanking stacked adenine increases the lifetime of the adjacent base pair by over an order of magnitude in the MMLV kissing loop. Strikingly, a base pair with an intact flanking stack (Table 2, k3) is as stable as if it were adjacent to another intact base pair (Table 2, k1a). This enhanced stability results from an increased repair rate for partially broken bonds, which are more likely to reform in the presence of stabilizing stacking interactions. The enhanced repair rate can be explained by the exclusion of solvent by the flanking stack from the base-pair junction, effectively preventing the exchange of a base-base hydrogen bond with a base-solvent hydrogen bond. As the rate of base-pair repair is inversely proportional to the magnitude of the applied force, dozens of back-and-forth transitions are often observed at low forces before complete dissociation occurs. The adjacent, unpaired purines therefore kinetically stabilize the MMLV complex by promoting self-healing from dissociation-promoting fluctuations. This nearest neighbor stabilization is reminiscent of the well-studied effects of dangling purines on the thermodynamics of RNA secondary structure formation (28).
The third major finding is an atomistic interpretation of extension at the transition state ( ) for the force-induced dissociation of the MMLV kissing loop. X‡ has been previously determined to be 0.7 nm from analysis of optical tweezers experiments (10), although there has not been a structural explanation for this result. We find that the transition state has both base pairs fully dissociated with one flanking adenine unstacked and the other forming an intermolecular stacking interaction (Fig. 8). Therefore, a complete description of the transition state requires additional reaction coordinates in addition to the linear extension. The two dissociated base pairs are separated by different amounts corresponding to the order in which they are broken; the C10-G11′ base pair breaks early and is separated by approximately 1.1 nm whereas the late-breaking G11-C10′ base pair is separated by only 0.6 nm. This experimentally derived X‡ falls squarely between these two values, and is consistent with the hypothesis that both kissing base pairs are simultaneously broken at the transition state and aligned with the axis of applied force. Furthermore, we find that the transition state exhibits an intermolecular stacking interaction of A9′ with G11, which explains how the lone G11-C10′ base pair can repair itself at low forces.
Although it is currently intractable to directly simulate dissociation events at the low forces (2–30 pN) utilized in the optical tweezers experiments, we can extrapolate the trends we have observed at higher forces (100–300 pN) to the low-force regime. The coaxial to bridging conformational rearrangement should still occur at very small forces due to its low activation barrier; this step alone allows the combined stability of multiple base pairs to become multiplicative rather than merely additive as in the unzipping of a canonical duplex. The stabilizing effect of the flanking stacks should continue to increase nonlinearly as the magnitude of the force is reduced. The rate of unstacking of A9 (k1b) should continue to decrease in response to reduced force, whereas the repair rate of the C10-G11′ base pair (k-2) concomitantly increases; this increase in repair rate will result in ever-increasing numbers of C10-G11′ break-repair cycles. Below 100 pN, the exact same phenomena should apply to the reversible breaking and repair of G11-C10′ due to the presence of a stack with A9′. As the magnitude of applied force is further reduced, the symmetrical nature of the kissing-loop complex should also result in parallel dissociation pathways that can initiate from either end of the loop-loop interface. This prediction could be experimentally tested via substitution of either flanking adenine with a pyrimidine base. We predict that mutation of the loop adenine distal to the applied force would have greater destabilizing effect at high forces.
In light of what we have learned about the stabilizing features of a minimal, 2-bp kissing loop, we can speculate how our findings might relate to the stability requirements of larger kissing loops. The ability to evenly distribute load among multiple bonds would seem to favor as large a loop-loop interface as possible. However, a sufficiently large loop-loop interface would eventually favor formation of a coaxial A-form helix, which would then dissociate via the less stable sequential unzipping mechanism. It has been previously shown using a series of loop-size mutations of the CopA/CopT kissing loop that the optimum loop size is five to seven nucleotides, with a rapid loss of affinity for loop sizes >7 (29). The need to maintain adequate loop flexibility to achieve a parallel bond arrangement may explain the requirement for unpaired, flanking bases in other highly stable kissing loops. Conflicting reports of the conformation of the flanking bases of the HIV DIS kissing loop might actually reflect the true conformational heterogeneity inherent to kissing complexes (27). This prediction could be tested using a stacking-sensitive fluorescent probe such as 2-amino-purine incorporated into the kissing-loop flanking sequence. HIV DIS (9), Avian leukosis virus, and Rous sarcoma virus (30) all prefer purines at these unpaired loop positions; this curious preference may be explained by the ability of purines to decrease the off-rate of adjacent base pairs without sacrificing flexibility of the loop-loop interface. It is notable that the tRNA anticodon-anticodon dimer with three intermolecular base pair utilizes a seven nucleotide loop with unpaired, flanking purines required for maximum binding affinity (31). We further speculate that the inherent flexibility of loops may allow kissing complexes to form at angles other than 180°—an attribute that may explain why some destabilizing mutations unexpectedly affect on-rates more than off-rates (32). This prediction could be tested using constructs connected by shortened linkers that encourage the formation of bent kissing complexes.
Materials and Methods
Details of the Molecular Dynamics Simulations.
All molecular dynamics simulations were performed using version 4.0.5 of the GROMACS molecular dynamics package (33). RNA was modeled using the AMBER-99 force field (34) ported to GROMACS by Sorin and Pande (35). The rigid three-site TIP3P model (36) was used to simulate water molecules. Ions were modeled using the parameters of Åqvist (37) according to the approach proposed by Chen and Pappu (38) to eliminate spurious ion-pairing artifacts. All simulations maintained a constant pressure of 1 bar and temperature of 298 K using the weak coupling algorithms of Berendsen and coworkers (39) with coupling constants of 1 and 0.2 ps, respectively. The equations of motion were integrated using a 2-fs time step and the leapfrog algorithm (40). The two bond lengths and one bond angle in each water molecule were constrained to values prescribed by the TIP3P model using the SETTLE algorithm of Miyamoto and Kollman (41). Snapshots were saved for analysis once every 2 ps. Periodic boundary conditions were employed to mimic the macroscopic setting for electrolytes. Long-range electrostatic interactions between periodic images were treated using the particle mesh Ewald approach (42), with a grid size of 0.12 nm, fourth-order cubic interpolation and a tolerance of 10-5. Neighbor lists were updated every 10 time steps. A cutoff of 10 Å was used for van der Waals interactions, real space Coulomb interactions, and for updating neighbor lists.
Initial coordinates for the 2-bp H3 MMLV kissing loop were obtained from the NMR structure of Kim and Tinoco (22), Protein Data Bank (PDB) ID code 1F5U (Fig. 1). The full-length MMLV kissing-loop complex (two hairpins, each with 4 nt loops and 7 bp stems) was placed in a rectangular box of dimensions 60 × 60 × 120 Å. Both hairpins share the same nucleotide sequence, 5′-GGUGGGAGACGUCCCACC-3′, and carry a net charge of -17 because the 3′ end is capped with a hydroxyl group. The kissing loop was rotated such that the helical axis was aligned with the longest box dimension—a strategy that is permissible as the application of external force effectively prevents free rotation of the RNA complex. The full-length system (42,363 atoms) contained 13,839 TIP3P waters, 62 Cl- anions, and 62 + 34 K+ cations to maintain net electroneutrality as well as mimic the experimental conditions of 250 mM excess KCl. It should be noted that the experiments are performed in the absence of Mg2+—a significant simplifying factor as current force-fields are unable to adequately describe divalent ions. The external pulling force was applied along the long box axis to the O5′ atom of G1 and the O3′ atom of C18′. Exploratory simulations were run at 100, 200, 300, and 400 pN of constant applied force (two independent trajectories at each force). Simulations were terminated when dissociation occurred for the each of the simulations, ranging from < 500 ps at 400 pN to 46 ns at 200 pN. The 100-pN simulations were terminated after no dissociation had occurred within 70 ns. Detailed, state-mapping simulations were run at 240, 260, 280, 300, 320, and 340 pN (10 replicates each) until dissociation occurred or 40 ns, whichever came first.
To acquire sufficient statistics to accurately quantify the rates of transitions between substates, a smaller, truncated stem version of the H3 MMLV 2-bp kissing loop was also created, where the double-stranded stems are only 2-bp long. This truncated system utilized a rectangular box of dimensions 50 × 50 × 90 Å, containing 7,023 TIP3P waters, 16 Cl- anions, and 16 + 14 K+ cations (mimicking 250 mM excess KCl salt), a total of 21,633 atoms. In these simulations, the initial bridging conformation has both intermolecular base pairs parallel to the axis of applied force (Fig. 3A). The external pulling force was applied along the long box axis to the O5′ atom of G1 and the O3′ atom of C8′. Fraying of the shortened stems was prevented via the application of harmonic restraining potentials to enforce Watson–Crick base pairing; each of the 10 hydrogen bonds was restrained to its equilibrium distance with a force constant of 10,000 kJ mol-1 nm-2. Simulations utilized a constant pulling force of 250, 200, 150, or 100 pN. Simulations at 250–150 pN were run until all 20 independent replicates had dissociated, taking as long as 415 ns at 150 pN (Fig. 4), whereas simulations at 100 pN were discontinued after 400 ns. The use of 20 replicates was a trade off between increased statistical significance and decreased computational feasibility that was arrived at via fitting of simulated noisy data (SI Text).
To test the hypothesis that the sandwich of adjacent adenine stacks helped stabilize the kissing interaction, a control set of open-faced versions of the truncated 2-bp complexes were also simulated. These simulations were identical in all aspects to the truncated stem simulations described above, except that both adjacent adenines (A9, A9′) start off irreversibly unstacked (Fig. 3B). Twenty replicate pulling trajectories were simulated at 250, 200, and 150 pN (Fig. 4).
Five transition-state candidates were chosen from snapshots taken exactly midway along the k3 transition at the lowest force examined (150 pN). As the duration of the transition is less than 5 ps, there was typically only one snapshot per trajectory that satisfied this criterion. 100 short, 5 ns simulations were seeded from these snapshots: all atomic positions, including those of the solvent and ions, were preserved, whereas velocities were randomly assigned to recapitulate a Boltzmann distribution at 298 K. The conformation shown in Fig. 8 is the one that came closest to exhibiting a 50/50 ratio between dissociating and reforming a doubly base-paired complex, with a transmission coefficient of 0.56.
Criterion for Detecting Transitions Between States.
To determine the rates of base pair breaking/reforming and stacking/unstacking of the adjacent adenine, it was necessary to define binary, geometric criteria for base pair and stacking integrity. It should be noted that the interevent waiting times were typically on the order of nanoseconds to tens of nanoseconds, whereas the duration of base pair breaking and unstacking transitions themselves were usually less than 2 ps; therefore, the results are insensitive to the exact choice of reference atoms and cutoff distance. The state of the two C-G base pairs were determined by the distance of the central hydrogen bond, that is the guanine N1 atom to the cytosine N3 atom, using a cutoff of 4 Å. For the stacking state of the flanking A9 base we used the distance between the C4 atom of A9 base and the C2 atom of the G11′ as A9 is located midway along the adjacent C10-G11′ base pair in the bridging conformation (Fig. 2). Distances ≤ 6 Å were considered an intact stack and greater distances considered unstacked; identical criterion was used to determine the stacking state of A9′ along the adjacent G11-C10′ base pair.
Calculation of Transition Rates Using the Pure-Death Stochastic Model.
We extracted rate constants from each ordered set of dissociation times using a stochastic version of the pure-death population model (12), as follows:
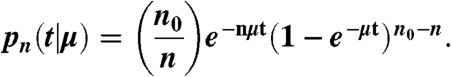 |
[4] |
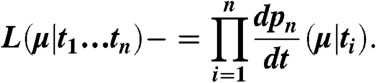
Eq. 4 is the probability of n survivors remaining after elapsed time t, given than the initial population is n0 and the time-independent death rate is μ. This model accounts for the noise inherent in small sample sizes by treating each dissociation event as the outcome of a separate Bernoulli trial; different statistical weights are assigned depending on the relative order of occurrence compared to all other recorded events. To extract μ for a particular transition, we create an ordered list of all the observed waiting times for that transition sorted from shortest to longest. Forward and backward transitions were analyzed separately, because we assume there is no memory between these events. We then use maximum likelihood estimation (MLE) to extract the most probable value of μ that produced the entire set of observed waiting times (43). The likelihood function of Eq. 4 is therefore,
 |
[5] |
The time derivative of Eq. 4 generates a probability density function (PDF) of waiting times given an event rate μ. We then swap the domain and range, such that each waiting time ti generates a probability density of likely values of μ. The final likelihood function is simply a product of all the individual PDFs generated for each waiting time ti. In all cases we obtain Gaussian-like distributions; the reported rate constants (Tables 1 and 2) are simply the location of the peak, and the reported standard deviations σ are the full-width-half-maximum divided by 2.35. This analysis requires the a priori assumption that the process is well-modeled by a single exponential decay. This assumption is shown to be accurate in the case of transitions that become highly recurrent at low forces. For example, at 150 pN, there are approximately 180 observed transitions for k2 and k-2 (Table 2), resulting in extremely large coefficients in the combinatorial prefactor of Eq. 4 which complicates evaluation of the MLE. However, in such cases (denoted by a dagger, †, in Table 2), there is ample data to directly fit the survival curve to a single-exponential using standard nonlinear least squares fitting. Rates obtained in this fashion are reported to three significant figures instead of two to reflect the significantly reduced uncertainty. For infrequently sampled transitions, rate estimates benefit by including auxiliary information such as censored events due to incomplete transitions as well as transition probability ratios from the recurrence values. These procedures are described in the SI Text.
Supplementary Material
Acknowledgments.
The authors thank Pan Li for many fruitful discussions that motivated this work. A.A.C. is supported by National Institutes of Health-National Institute of General Medical Sciences postdoctoral fellowship F32GM091774. A.E.G. is supported by National Science Foundation MCB-1050966. This work was also supported through a collaborative Interdisciplinary Pilot Research Program grant from the RNA Institute at the University at Albany.
Footnotes
The authors declare no conflict of interest.
This article is a PNAS Direct Submission.
See Author Summary on page 9236 (volume 109, number 24).
This article contains supporting information online at www.pnas.org/lookup/suppl/doi:10.1073/pnas.1119552109/-/DCSupplemental.
References
- 1.Laughrea M, et al. Mutations in the kissing-loop hairpin of human immunodeficiency virus type 1 reduce viral infectivity as well as genomic RNA packaging and dimerization. J Virol. 1997;71:3397–406. doi: 10.1128/jvi.71.5.3397-3406.1997. [DOI] [PMC free article] [PubMed] [Google Scholar]
- 2.Mougel M, Zhang Y, Barklis E. Cis-active structural motifs involved in specific encapsidation of Moloney murine leukemia virus RNA. J Virol. 1996;70:5043–50. doi: 10.1128/jvi.70.8.5043-5050.1996. [DOI] [PMC free article] [PubMed] [Google Scholar]
- 3.Fisher J, Goff SP. Mutational analysis of stem-loops in the RNA packaging signal of the Moloney murine leukemia virus. Virology. 1998;244:133–45. doi: 10.1006/viro.1998.9090. [DOI] [PubMed] [Google Scholar]
- 4.Paillart JC, Shehu-Xhilaga M, Marquet R, Mak J. Dimerization of retroviral RNA genomes: An inseparable pair. Nat Rev Microbiol. 2004;2:461–72. doi: 10.1038/nrmicro903. [DOI] [PubMed] [Google Scholar]
- 5.Johnson SF, Telesnitsky A. Retroviral RNA dimerization and packaging: The what, how, when, where, and why. PLoS Pathog. 2010;6:e1001007. doi: 10.1371/journal.ppat.1001007. [DOI] [PMC free article] [PubMed] [Google Scholar]
- 6.Eisinger J. Complex formation between transfer RNAs with complementary anticodons. Biochem Biophys Res Commun. 1971;43:854–61. doi: 10.1016/0006-291x(71)90695-4. [DOI] [PubMed] [Google Scholar]
- 7.Westhof E, Dumas P, Moras D. Crystallographic refinement of yeast aspartic acid transfer RNA. J Mol Biol. 1985;184:119–45. doi: 10.1016/0022-2836(85)90048-8. [DOI] [PubMed] [Google Scholar]
- 8.Moras D, et al. Anticodon-anticodon interaction induces conformational changes in tRNA: Yeast tRNA Asp, a model for tRNA-mRNA recognition. Proc Natl Acad Sci USA. 1986;83:932–6. doi: 10.1073/pnas.83.4.932. [DOI] [PMC free article] [PubMed] [Google Scholar]
- 9.Weixlbaumer A, Werner A, Flamm C, Westhof E, Schroeder R. Determination of thermodynamic parameters for HIV DIS type loop-loop kissing complexes. Nucleic Acids Res. 2004;32:5126–33. doi: 10.1093/nar/gkh841. [DOI] [PMC free article] [PubMed] [Google Scholar]
- 10.Li PTX, Bustamante C, Tinoco I. Unusual mechanical stability of a minimal RNA kissing complex. Proc Natl Acad Sci USA. 2006;103:15847–52. doi: 10.1073/pnas.0607202103. [DOI] [PMC free article] [PubMed] [Google Scholar]
- 11.Nelson BL. Stochastic Modeling Analysis and Simulation. New York: McGraw-Hill; 1995. [Google Scholar]
- 12.Renshaw E. Modelling Biological Populations in Space and Time. Cambridge, UK: Cambridge Univ Press; 1991. pp. 28–36. [Google Scholar]
- 13.Bell GI. Models for the specific adhesion of cells to cells. Science. 1978;200:618–27. doi: 10.1126/science.347575. [DOI] [PubMed] [Google Scholar]
- 14.Dudko OK, Hummer G, Szabo A. Theory, analysis, and interpretation of single-molecule force spectroscopy experiments. Proc Natl Acad Sci USA. 2008;105:15755–60. doi: 10.1073/pnas.0806085105. [DOI] [PMC free article] [PubMed] [Google Scholar]
- 15.Evans E. Probing the relation between force-lifetime-and chemistry in single molecular bonds. Annu Rev Biophys Biomol Struct. 2001;30:105–28. doi: 10.1146/annurev.biophys.30.1.105. [DOI] [PubMed] [Google Scholar]
- 16.Dudko O, Hummer G, Szabo A. Intrinsic rates and activation free energies from single-molecule pulling experiments. Phys Rev Lett. 2006;96:108101. doi: 10.1103/PhysRevLett.96.108101. [DOI] [PubMed] [Google Scholar]
- 17.Li J, Fernandez JM, Berne BJ. Water’s role in the force-induced unfolding of ubiquitin. Proc Natl Acad Sci USA. 2010;107:19284–9. doi: 10.1073/pnas.1013159107. [DOI] [PMC free article] [PubMed] [Google Scholar]
- 18.Morrison G, Hyeon C, Hinczewski M, Thirumalai D. Compaction and tensile forces determine the accuracy of folding landscape parameters from single molecule pulling experiments. Phys Rev Lett. 2011;106:138102. doi: 10.1103/PhysRevLett.106.138102. [DOI] [PMC free article] [PubMed] [Google Scholar]
- 19.Du R, Pande VS, Grosberg AY, Tanaka T, Shakhnovich ES. On the transition coordinate for protein folding. J Chem Phys. 1998;108:334–50. [Google Scholar]
- 20.Berkovich R, Garcia-Manyes S, Klafter J, Urbakh M, Fernández JM. Hopping around an entropic barrier created by force. Biochem Biophys Res Commun. 2010;403:133–7. doi: 10.1016/j.bbrc.2010.10.133. [DOI] [PMC free article] [PubMed] [Google Scholar]
- 21.Essevaz-Roulet B, Bockelmann U, Heslot F. Mechanical separation of the complementary strands of DNA. Proc Natl Acad Sci USA. 1997;94:11935–40. doi: 10.1073/pnas.94.22.11935. [DOI] [PMC free article] [PubMed] [Google Scholar]
- 22.Kim C-H, Tinoco I., Jr A retroviral RNA kissing complex containing only two GC base pairs. Proc Natl Acad Sci USA. 2000;97:9396–401. doi: 10.1073/pnas.170283697. [DOI] [PMC free article] [PubMed] [Google Scholar]
- 23.Wen J-D, et al. Force unfolding kinetics of RNA using optical tweezers. I. Effects of experimental variables on measured results. Biophys J. 2007;92:2996–3009. doi: 10.1529/biophysj.106.094052. [DOI] [PMC free article] [PubMed] [Google Scholar]
- 24.Freier SM, et al. Improved free-energy parameters for predictions of RNA duplex stability. Proc Natl Acad Sci USA. 1986;83:9373–7. doi: 10.1073/pnas.83.24.9373. [DOI] [PMC free article] [PubMed] [Google Scholar]
- 25.Birnbaum Z, Saunders S. A statistical model for life-length of materials. J Am Stat Assoc. 1958;53:151–60. [Google Scholar]
- 26.Lorenz C, Piganeau N, Schroeder R. Stabilities of HIV-1 DIS type RNA loop-loop interactions in vitro and in vivo. Nucleic Acids Res. 2006;34:334–42. doi: 10.1093/nar/gkj435. [DOI] [PMC free article] [PubMed] [Google Scholar]
- 27.Ennifar E, Dumas P. Polymorphism of bulged-out residues in HIV-1 RNA DIS kissing complex and structure comparison with solution studies. J Mol Biol. 2006;356:771–82. doi: 10.1016/j.jmb.2005.12.022. [DOI] [PubMed] [Google Scholar]
- 28.Sugimoto N, Kierzek R, Turner DH. Sequence dependence for the energetics of dangling ends and terminal base pairs in ribonucleic acid. Biochemistry. 1987;26:4554–8. doi: 10.1021/bi00388a058. [DOI] [PubMed] [Google Scholar]
- 29.Gregorian RS, Jr, Crothers DM. Determinants of RNA hairpin loop-loop complex stability. J Mol Biol. 1995;248:968–84. doi: 10.1006/jmbi.1995.0275. [DOI] [PubMed] [Google Scholar]
- 30.Polge E, Darlix JL, Paoletti J, Fossé P. Characterization of loose and tight dimer forms of avian leukosis virus RNA. J Mol Biol. 2000;300:41–56. doi: 10.1006/jmbi.2000.3832. [DOI] [PubMed] [Google Scholar]
- 31.Romby P, Giege R, Houssier C, Grosjean H. Anticodon-anticodon interactions in solution studies of the self-association of yeast or Escherichia coli tRNAAsp and of their interactions with Escherichia coli tRNAVal. J Mol Biol. 1985;184:107–18. doi: 10.1016/0022-2836(85)90047-6. [DOI] [PubMed] [Google Scholar]
- 32.Paillart JCC, Westhof E, Ehresmann C, Ehresmann B, Marquet R. Non-canonical interactions in a kissing-loop complex: The dimerization initiation site of HIV-1 genomic RNA. J Mol Biol. 1997;270:36–49. doi: 10.1006/jmbi.1997.1096. [DOI] [PubMed] [Google Scholar]
- 33.Hess B, Kutzner C, Spoel D, van der Lindahl E. GROMACS 4: Algorithms for highly efficient, load-balanced, and scalable molecular simulation. J Chem Theory Comput. 2008;4:435–47. doi: 10.1021/ct700301q. [DOI] [PubMed] [Google Scholar]
- 34.Wang J, Cieplak P, Kollman PA. How well does a restrained electrostatic potential (RESP) model perform in calculating conformational energies of organic and biological molecules? J Comput Chem. 2000;21:1049–74. [Google Scholar]
- 35.Sorin EJ, Pande VS. Exploring the helix-coil transition via all-atom equilibrium ensemble simulations. Biophys J. 2005;88:2472–93. doi: 10.1529/biophysj.104.051938. [DOI] [PMC free article] [PubMed] [Google Scholar]
- 36.Jorgensen WL, Chandrasekhar J, Madura JD, Impey RW, Klein ML. Comparison of simple potential functions for simulating liquid water. J Chem Phys. 1983;79:926–35. [Google Scholar]
- 37.Åqvist J. Ion-water interaction potentials derived from free energy perturbation simulations. J Phys Chem. 1990;94:8021–4. [Google Scholar]
- 38.Chen AA, Pappu RV. Parameters of monovalent ions in the AMBER-99 forcefield: Assessment of inaccuracies and proposed improvements. J Phys Chem B. 2007;111:11884–7. doi: 10.1021/jp0765392. [DOI] [PubMed] [Google Scholar]
- 39.Berendsen HJC, Postma JPM, van Gunsteren WF, DiNola A, Haak JR. Molecular dynamics with coupling to an external bath. J Chem Phys. 1984;81:3684–90. [Google Scholar]
- 40.Hockney RW, Goel SP, Eastwood JW. Quiet high-resolution computer models of a plasma. J Comp Physiol. 1974;14:148–58. [Google Scholar]
- 41.Miyamoto S, Kollman PA. Settle: An analytical version of the SHAKE and RATTLE algorithm for rigid water models. J Comput Chem. 1992;13:952–62. [Google Scholar]
- 42.Darden T, York D, Pedersen L. Particle mesh Ewald: An N⋅log(N) method for Ewald sums in large systems. J Chem Phys. 1993;98:10089–92. [Google Scholar]
- 43.Fisher RA. On the mathematical foundations of theoretical statistics. Philos Trans R Soc A. 1922;222:309–68. [Google Scholar]
