Abstract
The newly discovered Ca2+-activated Cl− channel (CaCC), Anoctamin 1 (Ano1 or TMEM16A), has been implicated in vital physiological functions including epithelial fluid secretion, gut motility, and smooth muscle tone. Overexpression of Ano1 in HEK cells or Xenopus oocytes is sufficient to generate Ca2+-activated Cl− currents, but the details of channel composition and the regulatory factors that control channel biology are incompletely understood. We used a highly sensitive quantitative SILAC proteomics approach to obtain insights into stoichiometric protein networks associated with the Ano1 channel. These studies provide a comprehensive footprint of putative Ano1 regulatory networks. We find that Ano1 associates with the signaling/scaffolding proteins ezrin, radixin, moesin, and RhoA, which link the plasma membrane to the cytoskeleton with very high stoichiometry. Ano1, ezrin, and moesin/radixin colocalize apically in salivary gland epithelial cells, and overexpression of moesin and Ano1 in HEK cells alters the subcellular localization of both proteins. Moreover, interfering RNA for moesin modifies Ano1 current without affecting its surface expression level. Another network associated with Ano1 includes the SNARE and SM proteins VAMP3, syntaxins 2 and -4, and syntaxin-binding proteins munc18b and munc18c, which are integral to translocation of vesicles to the plasma membrane. A number of other regulatory proteins, including GTPases, Ca2+-binding proteins, kinases, and lipid-interacting proteins are enriched in the Ano1 complex. These data provide stoichiometrically prioritized information about mechanisms regulating Ano1 function and trafficking to polarized domains of the plasma membrane.
Keywords: calcium, interactome, cross-linker, apical targeting
Ca2+-activated Cl− channels (CaCCs) play critical roles in epithelial secretion, sensory transduction and adaptation, regulation of smooth muscle contraction, control of neuronal and cardiac excitability, and nociception (1, 2). In 2008, after many years of controversy about the molecular identity of CaCCs, Ano1 and Ano2 (also called Tmem16A and Tmem16B) of the Anoctamin superfamily were identified as essential subunits of CaCCs (3–5). However, the regulatory networks that control Ano1 function remain largely unexplored.
The physiological significance of Ano1 cannot be understated. Ano1 is widely expressed in epithelia including salivary gland, pancreas, gut, mammary gland, and airway. Disruption of the Ano1 gene in mice eliminates Ca2+-dependent Cl− secretion in several epithelial tissues including salivary gland (3, 5–9). Ano1 also performs important functions in nonepithelial tissues including pacemaker activity in the gut and regulation of vascular and airway smooth muscle tone. Ano1 has also attracted the interest of cancer biologists because the gene is amplified in oral, head, and neck squamous cell carcinomas, and its expression level may correlate with cell proliferation (see recent reviews, refs. 10–18).
To identify potential accessory subunits and/or regulatory protein networks, we used a highly sensitive quantitative proteomic approach to identify Ano1-interacting proteins. We find that Ano1 forms a complex with two high stochiometry interactomes. One protein network is centered on the signaling/scaffolding actin-binding regulatory proteins ezrin, radixin, moesin, and RhoA. The ezrin–radixin–moesin (ERM) proteins organize the cortical cytoskeleton by linking actin to the plasma membrane and coordinate cell signaling events by scaffolding signaling molecules (19). The other major interactome is centered on the SNARE and SM proteins VAMP3, syntaxins 2 and -4, and the syntaxin-binding proteins munc18b and munc18c. This complex is involved in docking and translocation of vesicles to the plasma membrane (20). These studies provide a comprehensive footprint of putative Ano1 regulatory networks encompassing a spectrum from Ca2+ sensors to actin cytokeleton scaffolding networks and suggest mechanisms for the polarized localization of Ano1 in epithelial cells.
Results
To characterize the Ano1 interactome, we developed a method for high-level purification of Ano1 with specifically interacting proteins while minimizing nonspecific protein associations. This was accomplished using immunoaffinity chromatography of the Ano1 complex, which was stabilized with the cross-linker DSP [dithiobis(succinimidyl propionate)]. We have previously validated the robustness and specificity of this method using genetic tools (21). We constructed a HEK-293 cell line stably expressing Ano1 tagged on its C terminus with three FLAG epitopes (Ano1–FLAG3×). The cell line exhibited robust Ca2+-dependent, outwardly rectifying Cl− selective Ano1 currents (>200 pA/pF at +100 mV with 1 μM intracellular Ca2+). The cells were treated with the cell-permeant, amino-reactive, homobifunctional cross-linker DSP to stabilize low-affinity protein–protein interactions. DSP has a 12-Å spacer arm and a disulfide bond, which is cleaved with reducing agents to release cross-linked proteins (22, 23). Effective cross-linking was demonstrated by a moderate increase in the sedimentation velocity of Ano1–FLAG3× protein complexes in sucrose gradients (Fig. S1). Cross-linking was limited to closely neighboring proteins and did not result in large protein aggregates, because the sedimentation profile of total protein visualized by silver stain was not significantly altered by the DSP treatment (Fig. S1) (22, 24).
The cross-linked Ano1 protein complex was captured by incubating the cell lysate with anti-FLAG antibody-coated magnetic beads. The material that bound to the anti-FLAG beads consisted of a spectrum of bands on silver-stained gels (Fig. 1, lane 3). The prominent 130-kDa and 260-kDa bands correspond to Ano1 monomers and dimers as shown by Western blot (lane 3′). The predicted molecular mass of Ano1–FLAG3× is 113 kDa, but the glycosylated monomers and dimers migrate as diffuse bands at 130 kDa and 260 kDa (25). Many of the other bound proteins were nonspecific, because they bound to magnetic beads lacking anti-FLAG (lane 1), to beads coated with an irrelevant antibody (lane 2), or to beads coated with anti-FLAG in the presence of excess competing FLAG3× peptide (lane 4). Under these control conditions, Ano1–FLAG3× did not bind (lanes 1′, 2′, and 4′). The bound Ano1–FLAG3× complex was separated from nonspecifically bound proteins by elution from the anti-FLAG beads with excess FLAG3× peptide. The eluted material was exceptionally clean on silver-stained gels, consisting predominantly of the 130-kDa and 260-kDa Ano1 bands (lanes 6 and 6′).
Fig. 1.
Immunoaffinity purification of Ano1 supramolecular complexes from Ano1–FLAG3× cell line. (A) Silver-stained SDS/PAGE gel. (B) Immunoblot. Ano1 migrates as ∼130-kDa monomer and a ∼260-kDa dimer (25). HEK cells were cross-linked with DSP. Triton X-100 soluble lysates were incubated with anti-FLAG magnetic beads. Input: total lysate from Ano1–FLAG3× HEK cells. Lanes 1–4: Bound proteins were eluted with SDS/PAGE sample buffer. Lane 1: No antibody control, beads lacking antibody. Lane 2: Irrelevant antibody control, beads coated with SV2 antibody. Lane 3: beads coated with anti-FLAG antibody. Note the band corresponding to Ano1 at ∼130 kDa. Lane 4: Excess antigen control, beads coated with anti-FLAG antibody in the presence of 340 μM FLAG3× peptide. Lane 5: Proteins eluted from anti-FLAG coated beads (as in lane 3) with wash buffer A. Lane 6: Proteins eluted from anti-FLAG coated beads (as in lane 3) with 340 μM FLAG3× peptide.
To analyze Ano1 interacting proteins quantitatively, we coupled the immunoaffinity purification just described with stable isotope labeling with amino acids in culture (SILAC) (Fig. 2). Untransfected HEK cells were grown in medium containing arginine and lysine with “light” 12C and 14N, (R0K0), whereas the Ano1–FLAG3× stable cells were grown in medium containing “heavy” 13C- and 15N-labeled arginine and lysine (R10K8) for more than six passages to ensure equilibrium labeling of the proteome (97.5% R10K8 saturation). The cross-linked Ano1 complex purified by immunoaffinity chromatography (Fig. S2B) was analyzed by nano-LC MS/MS. A total of 509 proteins were identified at a 1% false discovery rate. Of these, there was sufficient signal to quantify SILAC enrichment for 392 (Fig. 2). The list was refined to 209 by curation against a database of polypeptides that nonselectively bind to anti-FLAG beads from untransfected DSP cross-linked cell extracts (26–28). A total of 93 of these proteins were enriched more than twofold and 73 were enriched more than fivefold in the Ano1-expressing cells (Fig. 2 and Dataset S1). A twofold SILAC enrichment is a stringent cutoff criterion to reliably detect differences between two samples (26, 28, 29).
Fig. 2.
Summary of SILAC experiment. Untransfected HEK cells were incubated in isotopically “light” (R0K0) DMEM. HEK cells stably transfected with Ano1–FLAG3× were incubated in isotopically “heavy” (R10K8) medium. Cells were substoichiometrically cross-linked using DSP. Lysates were immunoprecipitated using magnetic beads decorated with FLAG antibody. Ano1 supramolecular complexes were eluted with FLAG3× peptide. Samples were combined at a 1:1 ratio and analyzed by nano-LS MS/MS. Peptides enriched more than twofold with the R10K8 amino acids were considered as potential Ano1 interactors. The list of proteins was refined by curation against a list of peptides that nonspecifically bind to the immunomagnetic beads. The Venn diagram shows the number of peptides identified in the experiment. A total of 509 proteins were identified, 93 of which were enriched more than twofold in R10K8 and did not bind nonspecifically to immunomagnetic beads.
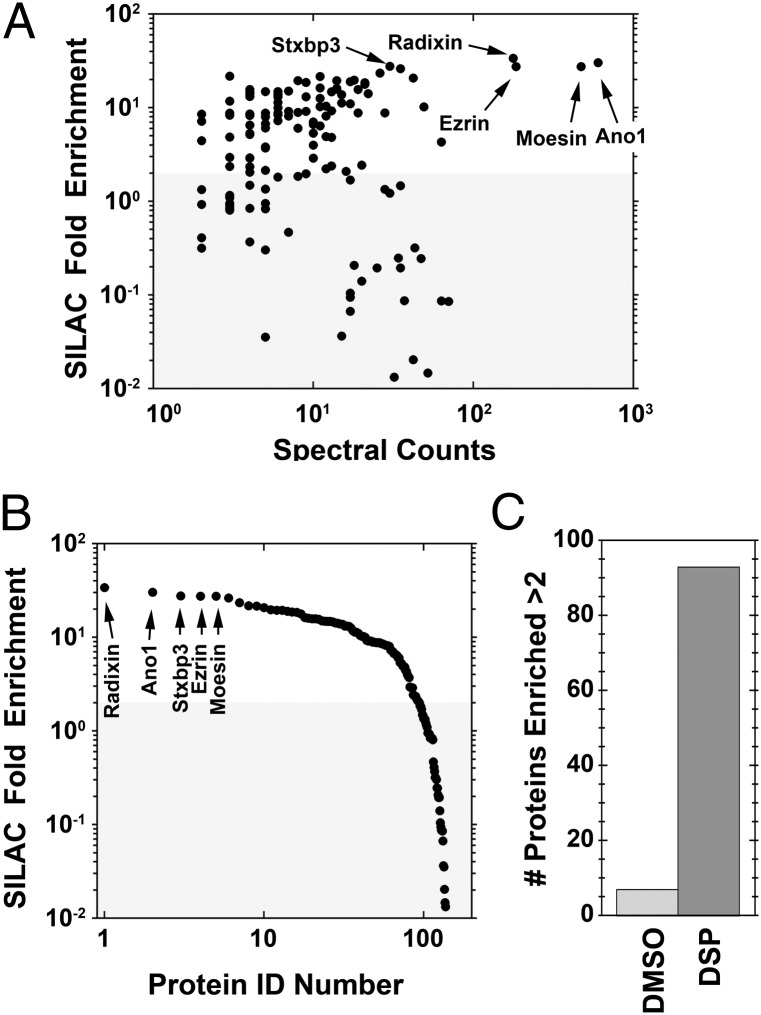
In contrast, in the absence of cross-linking, only six proteins copurifying with Ano1–FLAG3× were enriched more than twofold (Fig. 3C and Dataset S2). Most of these proteins are not present in the proteome of DSP-treated cells and some are located in subcellular compartments where Ano1–FLAG3× is unlikely to reside, such as the inner mitochondrial membrane. These data emphasize the importance of cross-linking for stabilizing weak and transient interactions. The finding that many of the cross-linked interacting proteins are found in plasma-membrane–associated compartments supports the contention that the cross-linking procedure only cross-links proteins that are physiologically relevant. Fig. 3 A and B quantifies the SILAC enrichment in cross-linked cells. Two additional non-SILAC nano-liquid chromatography (LC) MS/MS experiments independently confirmed the presence of most of the proteins identified in the SILAC run (Dataset S1). The five proteins that were most highly enriched were radixin, Ano1, syntaxin binding protein 3 (munc18c), ezrin, and moesin (∼30-fold enrichment). Examples of spectra of several high-ranking proteins in the SILAC enrichment are shown in Fig. S3.
Fig. 3.
Fold-enrichment and spectral counts of peptides identified in SILAC experiment. (A) Fold enrichment of heavy:light of the top 209 proteins vs. the spectral counts. (B) Data in A replotted as fold enrichment vs. protein rank. The top five enriched proteins are labeled. (C) Number of proteins enriched more than twofold from cells treated with vehicle (DMSO) or DSP.
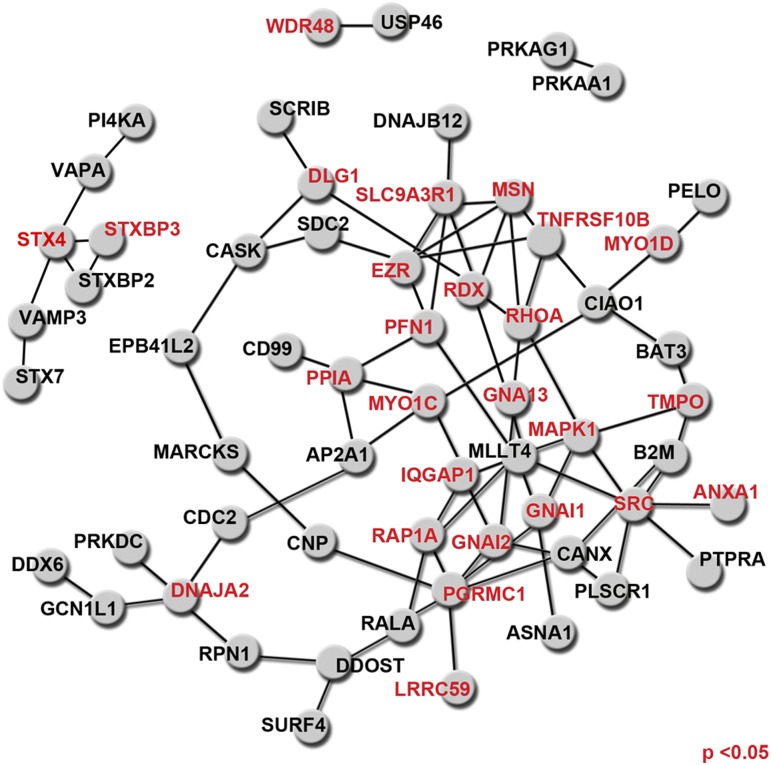
The experimentally verified functions of the 93 proteins were evaluated with Ingenuity pathways analysis (Fig. S4). The functions with the smallest P values were: organization of cytoplasm and cytoskeleton, followed by other functions that encompassed cell motility, protein trafficking, secretion, and signaling. To better understand the Ano1 interactome, the 93 proteins were subjected to analysis using DAPPLE (30). DAPPLE looks for significant physical connectivity among proteins according to protein–protein interactions from MINT, BIND, IntAct, PPrel, ECrel, Reactome, and other databases. The dataset contains 428,430 reported interactions, 169,810 of which are deemed high-confidence nonself interactions across 12,793 proteins. This analysis revealed 80 interactions between the 93 proteins with an average direct connectivity per protein of 2.7 (Fig. 4). Two major networks were represented in the 93-protein Ano1 interactome. One network is involved in vesicle trafficking and centers on the SNARE proteins syntaxin 4, syntaxin 7, VAMP3, and munc18. The other pathway is centered on the ezrin–radixin–moesin signaling/scaffolding complex and rhoA, which is involved in linking cell surface proteins to the cytoskeleton. Thus, the SILAC enrichment experiment, the accumulated peptide counts in three independent mass spectrometry experiments, and two independent in silico analyses support the association of two important signaling networks with Ano1.
Fig. 4.
DAPPLE analysis of interactions among the proteins in the Ano1 interactome. Proteins from Dataset S1 were submitted for analysis using parameters: iterations = 10,000, common interactor binding degree cutoff = 6, iteration = on. Red labels are nodes that achieved a P value <0.05, indicating the probability that the connections at these nodes were observed by chance.
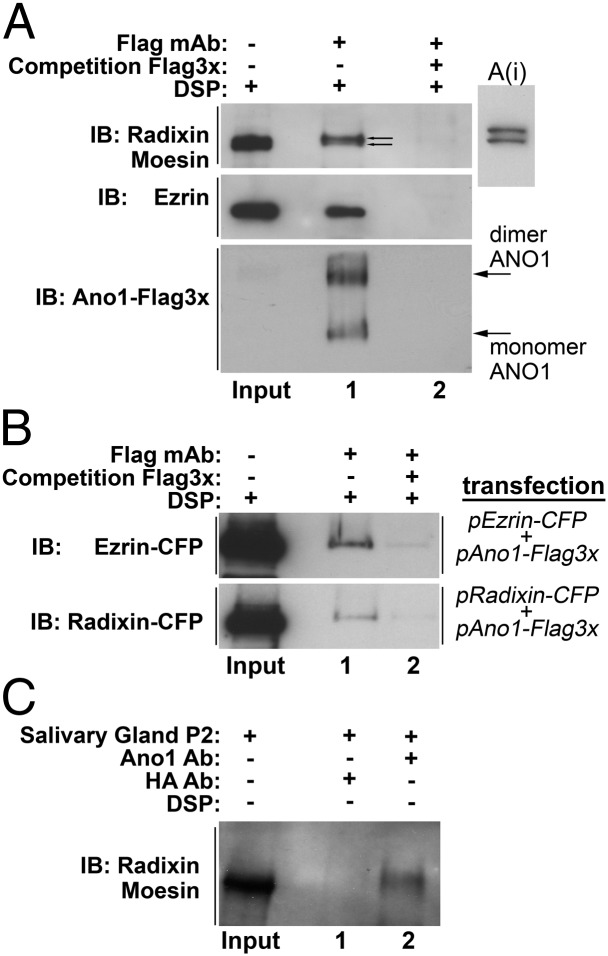
To verify the significance of the interactions identified by our proteomic analysis, we selected the ERM proteins for further analysis. We first examined the ability to coimmunoprecipitate ezrin, radixin, and moesin with Ano1. All three endogenous ERM proteins were robustly detected in the affinity-purified Ano1–FLAG3× complex (Fig. 5A). Radixin (68.5 kDa) and moesin (67.8 kDa) were not well separated in routine gels, but they were clearly separated when the gels were run for longer times (Figs. 5A(i) and see Fig. 8A). We independently confirmed these associations by coimmunoprecipitation of CFP-tagged ezrin or radixin coexpressed with Ano1–FLAG3× (Fig. 5B).
Fig. 5.
Coimmunoprecipitation of ezrin, radixin, and moesin with Ano1. (A) Ano1–FLAG3× stable cell line was cross-linked and Ano1 complexes were purified by immunoaffinity chromatography (lane 1). Control sample (lane 2) was applied to the anti-FLAG affinity column in the presence of excess FLAG3× peptide. Eluted proteins were run on Western blot and probed with antibodies against moesin (67.8 kDa) and radixin (67.8 kDa), ezrin, or FLAG (Ano1). Insert A(i) shows a better separation of radixin and moesin than in Fig. 8A. (B) HEK cells transiently coexpressing Ano1–FLAG3× and radixin–CFP or moesin–cyan fluorescent protein were cross-linked and Ano1 complexes purified and probed as in A. (C) Moesin/radixin were immunoprecipiated from salivary gland P2 Triton X-100 soluble fraction (Fig. S5) with a polyclonal antibody against Ano1 (lane 2) or an irrelevant antibody against hemaglutinin (control, lane 1).
Fig. 8.
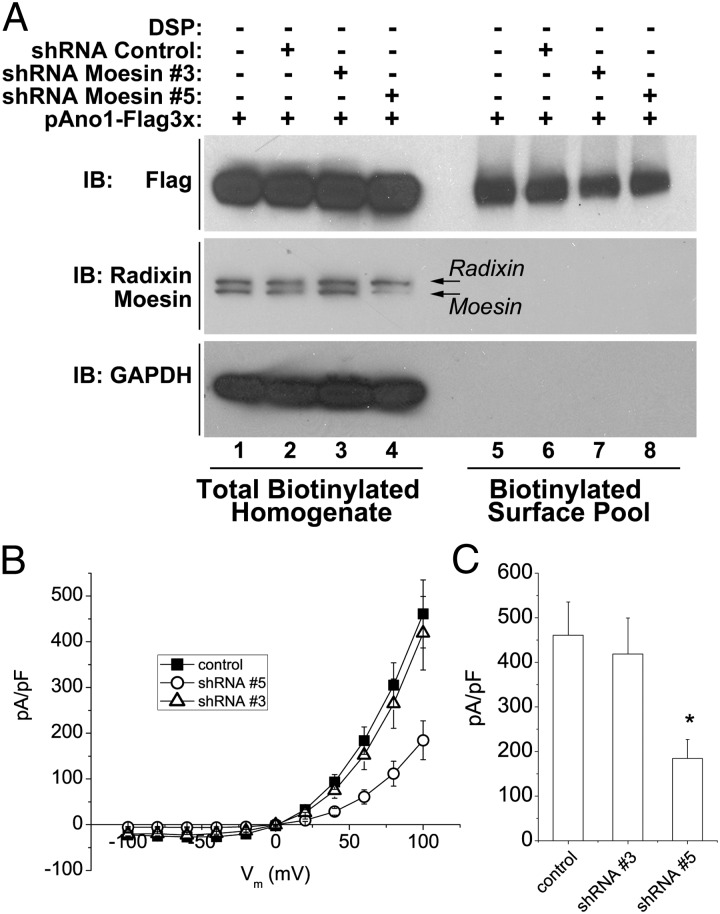
Effect of knockdown of moesin on Ano1 currents. (A) Western blot of total cell extracts (lanes 1–4) and surface biotinylated proteins (lanes 5–8). Cells were transfected with Ano1–FLAG3× and with empty shRNA vector or two different shRNA constructs (nos. 3 and 5). Cells transfected with shRNA vectors were selected with puromycin. (Upper) Ano1 expression detected with Ano1 antibody. (Lower) Radixin and moesin expression. Control shRNA: cells were transfected with the empty shRNA vector and selected with puromycin as with the other shRNA constructs. shRNA 5 almost completely eliminated moesin expression. (B) IV curves of whole-cell patch clamped Ano1 currents in a cell line stably expressing Ano1 tagged with EGFP on the C terminus treated with control vector, shRNA 3 or shRNA 5. Intracellular (pipet) Ca2+ concentration was 600 nM. (C) Average current densities at +100 mV. *P < 0.05.
We then asked whether native Ano1 and ERM proteins associate endogenously in adult mouse salivary gland in the absence of cross-linking. Subcellular fractionation of salivary gland homogenates demonstrated that a large proportion of Ano1 cosedimented with ERM proteins and actin in a fraction (P2) that was Triton X-100 insoluble. This finding supports the conclusion that Ano1 and ERM proteins exist in a stable macromolecular complex in salivary gland cells (Fig. S5). To determine whether Ano1 and ERM proteins are molecularly associated, we tested whether Ano1 and ERM proteins could be coimmunoprecipitated from the detergent-soluble P2 fraction using a polyclonal antibody to mAno1. The Ano1 antibody coimmunoprecipitated moesin/radixin in the absence of cross-linker, showing that these proteins interact in native salivary gland (Fig. 5C).
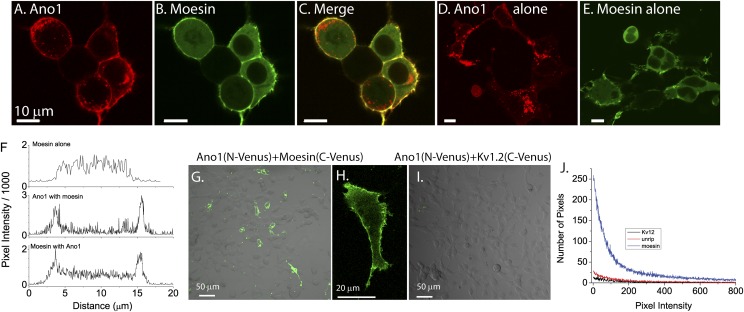
Additional approaches were taken to explore the association of Ano1 and moesin. HEK-293 cells transfected with Ano1–mCherry and moesin–EGFP were analyzed by confocal microscopy. Ano1 and moesin are both intensely localized at the plasma membrane (Fig. 6 A–C). The plasma membrane localization of both Ano1 and moesin were augmented when the two were expressed together compared with either expressed alone (Fig. 6 D–F). Bimolecular fluorescence complementation was then used to establish whether morphological colocalization of Ano1 with moesin represented molecular binding. Ano1 tagged with the N-terminal half of the fluorescent protein Venus (Ano1–N–Venus) was coexpressed with moesin tagged with the C-terminal half of Venus (moesin–C–Venus). Coexpression of the two proteins produced intense plasma membrane fluorescence (Fig. 6 G and H), showing that Ano1 and moesin interact. No fluorescence was seen when Ano1–N–Venus was expressed alone or with either of two irrelevant proteins, the transmembrane Kv1.2 channel or the SMN complex protein unrip, tagged with C–Venus (Fig. 6 I and J and Fig. S6B).
Fig. 6.
Colocalization of moesin and Ano1 in HEK cells. (A–C) HEK cells were transfected with Ano1–mCherry (red, A) and moesin–EGFP (green, B). (C) A and B superimposed. (D and E) Cells transfected with Ano1–mCherry alone (D) or moesin–EGFP alone (E). (F) Profiles of transcellular fluorescence in cells expressing only moesin–EGFP or moesin–EGFP plus Ano1–mCherry. Profiles were obtained by drawing a line across the cell avoiding the nucleus where moesin is excluded. Profiles are representative of >10 cells selected at random. (G–J) Bimolecular fluorescence complementation (BiFC). (G) Cells were cotransfected with Ano1 tagged with Venus(1–155) and Moesin tagged with Venus(156–239). (H) High power showing membrane localization of the BiFC fluorescence. (I) Control for BiFC. Cells were transfected with Ano1–Venus(1–155) and Kv1.2–Venus(156–239).(J) Quantification of BiFC. Histograms of pixel intensity for fields transfected with Ano1–Venus(1–155) plus moesin–Venus(156–239), the potassium channel Kv1.2–Venus(156–239), or the survival of motor neurons (SMN) complex subunit unrip–Venus(156–239).
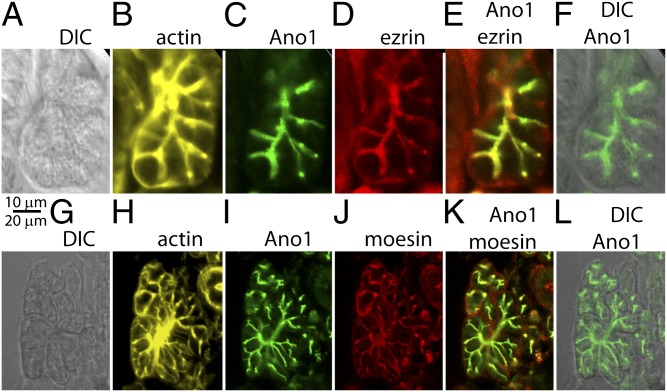
To determine whether colocalization of moesin and Ano1 also occurs in native tissue, we examined the distribution of Ano1 and moesin/radixin by immunostaining mouse salivary gland. Salivary gland was chosen because we have shown that Ano1 is responsible for Ca2+-mediated Cl− secretion in this tissue, and because this tissue is a model system for studying Ca2+-activated Cl− channels (8, 31). Ano1 was highly concentrated at the apical membrane of acinar cells and intercalated excretory ducts and colocalized with moesin/radixin, ezrin, and actin (Fig. 7). Some staining for moesin/radixin and ezrin was sometimes observed on the basolateral membranes, but this staining was also present in cells in which primary antibody was omitted (Fig. S6A). This background staining is probably due to the polymeric IgA receptor, which is widely expressed in salivary gland and is very difficult to eliminate when using mouse monoclonal secondary antibodies. Therefore, we conclude that Ano1 colocalizes with moesin/radixin and ezrin at the apical membrane of salivary acinar and duct cells.
Fig. 7.
Localization of Ano1, ezrin, moesin, and actin in salivary gland. Coloring is as follows: moesin and ezrin are red, Ano1 is green, and actin (stained with Alexa 647 phalloidin) is yellow. (A–F). Colocalization of Ano1, ezrin, and actin. (G–L). Colocalization of Ano1, moesin, and actin. (A and G) DIC images. (B and H) Actin. (C and I) Ano1. (D) Ezrin. (E) Ano1 and ezrin overlay. (J) Moesin. (K) Ano1 and moesin overlay. (F and L) Ano1 and DIC overlay.
To investigate the functional interaction between Ano1 and moesin, HEK cells were treated with shRNA directed against moesin. Four different shRNA plasmids were tested. Hairpin 5 was most effective in knocking down moesin expression, whereas hairpin 3 was ineffective (Fig. 8A). Control cells were treated identically but with empty vector. On average, the amplitude of the Ano1 currents was reduced by >50% after treatment with shRNA 5, but not by treatment with shRNA 3 compared with control cells (Fig. 8B). The decrease in Ano1 current amplitude is not due to decreased levels of Ano1 at the cell surface, as determined by biotinylation of the Ano1 cell surface pool (Fig. 8A).
Discussion
We have developed a procedure to affinity purify Ano1 with its interacting proteins. Three independent proteomic analyses identified protein networks associated with Ano1 at high stoichiometry: the actin-binding regulatory ERM proteins and a SNARE protein complex. In addition, Ano1 interacts with both large and small GTPases, calcium binding proteins, kinases, and lipid-modifying enzymes (Dataset S1). Because HEK cells do not naturally express Ano1, it is possible that we have missed some interacting proteins that might be present in cell types that natively express Ano1. However, because the currents that we record in transfected HEK cells are virtually identical to those that we have recorded in native cells, such as salivary gland acinar cells (8), Xenopus oocytes (32), and inner medullary collecting duct (IMCD) cells (33), it seems unlikely that essential binding partners are missing. However, our investigation was limited to nominally “basal” intracellular Ca2+ conditions. Future experiments will be directed at examining the interactome when Ca2+ is elevated before cross-linking as well as in cells that endogenously express Ano1. The converse question is whether cross-linking could produce false positives that are not actually involved in regulating Ano1. We previously validated the experimental approach used here genetically and have shown that it minimizes false positive interactors between a membrane protein and a cytosolic adapter (34) and in multicomponent DSP interactomes (21). DSP is a homobifunctional reagent with a spacer arm of 12 Å that interacts only with N-terminal α-amino and ε-amino groups of lysine. Thus, only amino groups within this distance will be cross-linked. We used DSP in substoichiometric and precisely defined conditions that avoid the generation of large protein aggregates (21, 22, 24, 34). In the case of Ano1, evidence for restricted cross-linking is shown by the small effect of DSP on the sedimentation profile of total proteins in sucrose gradients. Importantly, the Ano1 interactome identified in DSP cross-linked HEK cells has led to the identification of associations between Ano1 and ERM proteins in salivary gland in the absence of cross-linker. The isotopic enrichment of the top 10 proteins in the SILAC experiment (Dataset S1) is >20, compared with 30 for Ano1 itself, suggesting that the top-ranking proteins are likely interacting at high stoichiometry with Ano1.
One notable observation is that there are no known ion channels or Ano-like membrane proteins in addition to Ano1 in the curated interactome. Even among the unfiltered list of the highest 200 SILAC enriched proteins, there were no known ion channels and only three ion transporters. Although it is widely thought that Ano1 is a pore-forming channel subunit, the molecular identification of Cl channels has been fraught with problems (1). Because unambiguous proof that Ano1 forms the pore has not yet been achieved (for example, by incorporation into bilayers) and HEK cells endogenously express several Ano orthologs, it is reassuring that our proteomic data provide no evidence for an additional potential pore-forming subunit that associates with Ano1.
The mechanism of regulation of Ano1 by Ca2+ remains unresolved (35, 36). Some data support the idea that Ca2+ binds directly to the Ano1 protein, but other data implicate a role for CaM (review in ref. 18). It is notable that CaM was not found in the Ano1 interactome. The interactome does include a member of the S100 Ca-binding protein superfamily, S100–A10. However, this member of the family does not appear to bind Ca2+. Other proteins that are regulated by Ca2+ or may bind Ca include annexin A1 (ANXA1), calnexin (CANX), calmodulin-activated serine kinase (CASK), coiled-coil and C2-domain interacting protein (CC2D1A), phospholipid scramblase (PLSCR1), and extended synaptotagmin (FAM62A). Annexin A1 is intriguing because various annexins have been shown to regulate native Ca2+-activated Cl− channels. For example, annexin IV inhibits calmodulin-sensitive Cl− channels (37, 38) as well as Ca2+-activated Cl− channels (39). In endothelial cells the annexin II–S100A10 complex might be involved in regulation of the swelling-activated Cl− channel (40) and cystic fibrosis transmembrane conductance regulator (41).
The physiological significance of the ERM proteins is highlighted by the colocalization of moesin and Ano1 in native and transfected cells and by the inhibitory effect of moesin knockdown on Ano1 current amplitude. An interesting observation is that the surface localization of moesin is increased when the two proteins are coexpressed. This suggests the possibility that Ano1 may play a role in organization of the actin cytoskeleton. The actin cytoskeleton and its associated regulatory proteins could be implicated in Ano1 function by modulating Ano1 channel gating, directing the trafficking Ano1 to the apical membrane, or assembling Ano1 into signaling networks. It has been reported that both depolymerization of the actin cytoskeleton with cytochalasin-D and stabilization of the actin network with phalloidin suppresses Ano1 currents (42). A number of ion channels have been shown to interact with the actin cytoskeleton (43). It is particularly interesting that another epithelial Cl− channel, CFTR, interacts with some of the same proteins that Ano1 interacts with, notably ezrin and NHERF1. The actin cytoskeleton modulates CFTR by multiple mechanisms including trafficking, gating, and assembly into signaling complexes. CFTR, like Ano1, also interacts with SNARES (syntaxins 1A, -3, -6, -7, -8, -16, and VAMP8) (44), which play a role in CFTR trafficking.
In summary, these data provide a rich store of leads about potential regulatory mechanisms impinging on the Ca2+-activated Cl− channel Ano1. Experiments to elucidate the roles that the SNARE complex and ERM proteins play in Ano1 physiology and cell biology are likely to yield exciting new information.
Materials and Methods
Methods are described in detail in SI Materials and Methods.
Proteomic Analysis.
A stable cell line was generated by transfecting HEK cells with a neomycin-selectable plasmid encoding Ano1 tagged with a concatamer of three FLAG epitopes [(DYKDDDDK)3]. SILAC was performed by growing cells in DMEM media containing either isotopically light arginine and lysine (“R0K0”) or isotopically heavy arginine and lysine (“R10K8”). The incorporation of labeled amino acids was 97.5%. To stabilize low-affinity interactions, intact cells were cross-linked with DSP as previously described (22, 24, 34). Cells were lysed and the clarified supernatant was applied to 30 μL Dynal magnetic beads coated with anti-FLAG antibody. Specifically bound proteins were eluted by 2-h incubation with 340 μM 3× FLAG peptide. Samples were analyzed by SDS/PAGE followed by immunoblot or silver staining. Mass spectrometry analysis was performed by MS Bioworks. Samples for proteomic analysis were separated on a 4–12% (wt/vol) Bis-Tris Novex minigel, digested with trypsin, and analyzed by nano-LC MS/MS with a Waters NanoAcquity HPLC system interfaced to a ThermoFisher LTQ Orbitrap Velos.
Microscopy.
HEK cells were plated on coverslips in 35-mm dishes and transiently transfected using Fugene 6 with 1 μg of DNA. Live cells were examined by confocal microscopy or were fixed for 20 min in 4% paraformaldehyde and permeabilized with paraformaldehyde before blocking and staining with antibodies. Primary antibodies were used against the following antigens: Ano1 (amino acids 878–960, SDIX Custom Genomic Antibody), antimoesin (Abcam; A50007), and antiezrin. The cells were then washed and incubated with a mixture of Dylight-488 or Dylight-568 conjugated (1:1,000) secondary antibodies for 1 hr at 4 °C (Jackson Immunochemicals). Sometimes Alexa-647–phalloidin was included to stain actin. Coverslips were mounted on glass slides using ProLong Gold (Invitrogen). Salivary gland was obtained from wild-type mice immediately after euthanasia induced by inhalation of isoflurane. Animals were bred and maintained in accordance with National Institutes of Health’s institutional guidelines. All procedures were approved by Emory University Institutional Animal Care and Use Committee. Tissue was fixed in 4% paraformaldehyde buffered with 0.1 M phosphate buffer pH 7.4, frozen, and embedded in OCT compound for frozen sectioning. Sections were then processed as essentially as described for transfected cells.
Patch Clamp.
Whole-cell patch clamp recordings were performed as previously described (32). Intracellular pipette solution contained (in millimoles): 146 CsCl, 2 MgCl2, 5 EGTA, 10 sucrose, and 8 Hepes, pH 7.3. Ca2+ was adjusted to 600 nM free Ca2+ (32). The extracellular solution contained (in millimoles): 140 NaCl, 5 KCl, 2 CaCl2, 1 MgCl2, 15 glucose, and 10 Hepes, pH 7.4. shRNA in pLKO.1 vector for moesin was purchased from Open Biosystems (RHS4533_NM_002444). Transfected cells were selected in the presence of 1 μg/mL puromycin for 3 d.
Supplementary Material
Acknowledgments
We thank Alexa Mattheyses for help with microscopy, Claudia Fallini with bimolecular fluorescence complementation (BiFC), and Richard Jones of MS Bioworks for excellent mass spectrometry analysis and advice on sample preparation. This work was supported by National Institutes of Health (NIH) Grants GM60448 (to H.C.H.), EY014852 (to H.C.H.), NS42599 (to V.F.), and GM077569 (to V.F.); the Emory University Research Committee (H.C.H.); National Eye Institute (NEI) Training Grant 5T32EY007092-25 (to C.D.); and NIH Fellowships in Research and Science Teaching (FIRST) Program Fellowship K12 GM000608 (to A.G.). Additional support was provided by the Microscopy Core of the Emory Neuroscience National Institute of Neurological Disorders and Stroke Core Facilities Grant P30NS055077 and NEI Core Grant P30EY006360.
Footnotes
The authors declare no conflict of interest.
This article is a PNAS Direct Submission.
This article contains supporting information online at www.pnas.org/lookup/suppl/doi:10.1073/pnas.1200174109/-/DCSupplemental.
References
- 1.Duran C, Thompson CH, Xiao Q, Hartzell HC. Chloride channels: Often enigmatic, rarely predictable. Annu Rev Physiol. 2010;72:95–121. doi: 10.1146/annurev-physiol-021909-135811. [DOI] [PMC free article] [PubMed] [Google Scholar]
- 2.Hartzell C, Putzier I, Arreola J. Calcium-activated chloride channels. Annu Rev Physiol. 2005;67:719–758. doi: 10.1146/annurev.physiol.67.032003.154341. [DOI] [PubMed] [Google Scholar]
- 3.Yang YD, et al. TMEM16A confers receptor-activated calcium-dependent chloride conductance. Nature. 2008;455:1210–1215. doi: 10.1038/nature07313. [DOI] [PubMed] [Google Scholar]
- 4.Schroeder BC, Cheng T, Jan YN, Jan LY. Expression cloning of TMEM16A as a calcium-activated chloride channel subunit. Cell. 2008;134:1019–1029. doi: 10.1016/j.cell.2008.09.003. [DOI] [PMC free article] [PubMed] [Google Scholar]
- 5.Caputo A, et al. TMEM16A, a membrane protein associated with calcium-dependent chloride channel activity. Science. 2008;322:590–594. doi: 10.1126/science.1163518. [DOI] [PubMed] [Google Scholar]
- 6.Huang F, et al. Studies on expression and function of the TMEM16A calcium-activated chloride channel. Proc Natl Acad Sci USA. 2009;106:21413–21418. doi: 10.1073/pnas.0911935106. [DOI] [PMC free article] [PubMed] [Google Scholar]
- 7.Ousingsawat J, et al. Loss of TMEM16A causes a defect in epithelial Ca2+-dependent chloride transport. J Biol Chem. 2009;284:28698–28703. doi: 10.1074/jbc.M109.012120. [DOI] [PMC free article] [PubMed] [Google Scholar]
- 8.Romanenko VG, et al. Tmem16A encodes the Ca2+-activated Cl− channel in mouse submandibular salivary gland acinar cells. J Biol Chem. 2010;285:12990–13001. doi: 10.1074/jbc.M109.068544. [DOI] [PMC free article] [PubMed] [Google Scholar]
- 9.Rock JR, et al. Transmembrane protein 16A (TMEM16A) is a Ca2+-regulated Cl− secretory channel in mouse airways. J Biol Chem. 2009;284:14875–14880. doi: 10.1074/jbc.C109.000869. [DOI] [PMC free article] [PubMed] [Google Scholar]
- 10.Galietta LJ. The TMEM16 protein family: A new class of chloride channels? Biophys J. 2009;97:3047–3053. doi: 10.1016/j.bpj.2009.09.024. [DOI] [PMC free article] [PubMed] [Google Scholar]
- 11.Ferrera L, Caputo A, Galietta LJ. TMEM16A protein: A new identity for Ca(2+)-dependent Cl(−) channels. Physiology (Bethesda) 2010;25:357–363. doi: 10.1152/physiol.00030.2010. [DOI] [PubMed] [Google Scholar]
- 12.Flores CA, Cid LP, Sepúlveda FV, Niemeyer MI. TMEM16 proteins: The long awaited calcium-activated chloride channels? Braz J Med Biol Res. 2009;42:993–1001. doi: 10.1590/s0100-879x2009005000028. [DOI] [PubMed] [Google Scholar]
- 13.Hartzell HC, Yu K, Xiao Q, Chien LT, Qu Z. Anoctamin/TMEM16 family members are Ca2+-activated Cl− channels. J Physiol. 2009;587:2127–2139. doi: 10.1113/jphysiol.2008.163709. [DOI] [PMC free article] [PubMed] [Google Scholar]
- 14.Kunzelmann K, et al. Bestrophin and TMEM16-Ca(2+) activated Cl(−) channels with different functions. Cell Calcium. 2009;46:233–241. doi: 10.1016/j.ceca.2009.09.003. [DOI] [PubMed] [Google Scholar]
- 15.Braun AP. Cloning and expression of a calcium-activated chloride channel reveal a novel protein candidate. Channels (Austin) 2008;2:393–394. doi: 10.4161/chan.2.6.7648. [DOI] [PubMed] [Google Scholar]
- 16.Galindo BE, Vacquier VD. Phylogeny of the TMEM16 protein family: Some members are overexpressed in cancer. Int J Mol Med. 2005;16:919–924. [PubMed] [Google Scholar]
- 17.Kunzelmann K, et al. Role of the Ca2+-activated Cl− channels bestrophin and anoctamin in epithelial cells. Biol Chem. 2011;392:125–134. doi: 10.1515/BC.2011.010. [DOI] [PubMed] [Google Scholar]
- 18.Duran C, Hartzell HC. Physiological roles and diseases of Tmem16/Anoctamin proteins: Are they all chloride channels? Acta Pharmacol Sin. 2011;32:685–692. doi: 10.1038/aps.2011.48. [DOI] [PMC free article] [PubMed] [Google Scholar]
- 19.Neisch AL, Fehon RG. Ezrin, Radixin and Moesin: Key regulators of membrane-cortex interactions and signaling. Curr Opin Cell Biol. 2011;23:377–382. doi: 10.1016/j.ceb.2011.04.011. [DOI] [PMC free article] [PubMed] [Google Scholar]
- 20.Südhof TC, Rothman JE. Membrane fusion: Grappling with SNARE and SM proteins. Science. 2009;323:474–477. doi: 10.1126/science.1161748. [DOI] [PMC free article] [PubMed] [Google Scholar]
- 21.Gokhale A, et al. Quantitative proteomic and genetic analyses of the schizophrenia susceptibility factor dysbindin identify novel roles of the biogenesis of lysosome-related organelles complex 1. J Neurosci. 2012;32:3697–3711. doi: 10.1523/JNEUROSCI.5640-11.2012. [DOI] [PMC free article] [PubMed] [Google Scholar]
- 22.Zlatic SA, Ryder PV, Salazar G, Faundez V. Isolation of labile multi-protein complexes by in vivo controlled cellular cross-linking and immuno-magnetic affinity chromatography. J Vis Exp. 2010;(37):1855. doi: 10.3791/1855. [DOI] [PMC free article] [PubMed] [Google Scholar]
- 23.Lomant AJ, Fairbanks G. Chemical probes of extended biological structures: Synthesis and properties of the cleavable protein cross-linking reagent [35S]dithiobis(succinimidyl propionate) J Mol Biol. 1976;104:243–261. doi: 10.1016/0022-2836(76)90011-5. [DOI] [PubMed] [Google Scholar]
- 24.Salazar G, et al. Hermansky-Pudlak syndrome protein complexes associate with phosphatidylinositol 4-kinase type II alpha in neuronal and non-neuronal cells. J Biol Chem. 2009;284:1790–1802. doi: 10.1074/jbc.M805991200. [DOI] [PMC free article] [PubMed] [Google Scholar]
- 25.Sheridan JT, et al. Characterization of the oligomeric structure of the Ca(2+)-activated Cl− channel Ano1/TMEM16A. J Biol Chem. 2011;286:1381–1388. doi: 10.1074/jbc.M110.174847. [DOI] [PMC free article] [PubMed] [Google Scholar]
- 26.Ong SE, et al. Stable isotope labeling by amino acids in cell culture, SILAC, as a simple and accurate approach to expression proteomics. Mol Cell Proteomics. 2002;1:376–386. doi: 10.1074/mcp.m200025-mcp200. [DOI] [PubMed] [Google Scholar]
- 27.Mann M. Functional and quantitative proteomics using SILAC. Nat Rev Mol Cell Biol. 2006;7:952–958. doi: 10.1038/nrm2067. [DOI] [PubMed] [Google Scholar]
- 28.Trinkle-Mulcahy L, et al. Identifying specific protein interaction partners using quantitative mass spectrometry and bead proteomes. J Cell Biol. 2008;183:223–239. doi: 10.1083/jcb.200805092. [DOI] [PMC free article] [PubMed] [Google Scholar]
- 29.Ong SE, Mann M. A practical recipe for stable isotope labeling by amino acids in cell culture (SILAC) Nat Protoc. 2006;1:2650–2660. doi: 10.1038/nprot.2006.427. [DOI] [PubMed] [Google Scholar]
- 30.Rossin EJ, et al. International Inflammatory Bowel Disease Genetics Constortium Proteins encoded in genomic regions associated with immune-mediated disease physically interact and suggest underlying biology. PLoS Genet. 2011;7:e1001273. doi: 10.1371/journal.pgen.1001273. [DOI] [PMC free article] [PubMed] [Google Scholar]
- 31.Melvin JE, Yule D, Shuttleworth TJ, Begenisich T. Regulation of fluid and electrolyte secretion in salivary gland acinar cells. Annu Rev Physiol. 2005;67:445–469. doi: 10.1146/annurev.physiol.67.041703.084745. [DOI] [PubMed] [Google Scholar]
- 32.Kuruma A, Hartzell HC. Bimodal control of a Ca(2+)-activated Cl(−) channel by different Ca(2+) signals. J Gen Physiol. 2000;115:59–80. doi: 10.1085/jgp.115.1.59. [DOI] [PMC free article] [PubMed] [Google Scholar]
- 33.Qu Z, Wei RW, Hartzell HC. Characterization of Ca2+-activated Cl− currents in mouse kidney inner medullary collecting duct cells. Am J Physiol Renal Physiol. 2003;285(2):F326–F335. doi: 10.1152/ajprenal.00034.2003. [DOI] [PubMed] [Google Scholar]
- 34.Craige B, Salazar G, Faundez V. Phosphatidylinositol-4-kinase type II alpha contains an AP-3-sorting motif and a kinase domain that are both required for endosome traffic. Mol Biol Cell. 2008;19:1415–1426. doi: 10.1091/mbc.E07-12-1239. [DOI] [PMC free article] [PubMed] [Google Scholar]
- 35.Xiao Q, et al. Voltage- and calcium-dependent gating of TMEM16A/Ano1 chloride channels are physically coupled by the first intracellular loop. Proc Natl Acad Sci USA. 2011;108:8891–8896. doi: 10.1073/pnas.1102147108. [DOI] [PMC free article] [PubMed] [Google Scholar]
- 36.Yu K, Duran C, Qu Z, Cui YY, Hartzell HC. Explaining calcium-dependent gating of anoctamin-1 chloride channels requires a revised topology. Circ Res. 2012;110:990–999. doi: 10.1161/CIRCRESAHA.112.264440. [DOI] [PMC free article] [PubMed] [Google Scholar]
- 37.Chan HC, Kaetzel MA, Gotter AL, Dedman JR, Nelson DJ. Annexin IV inhibits calmodulin-dependent protein kinase II-activated chloride conductance. A novel mechanism for ion channel regulation. J Biol Chem. 1994;269:32464–32468. [PubMed] [Google Scholar]
- 38.Xie W, et al. Inositol 3,4,5,6-tetrakisphosphate inhibits the calmodulin-dependent protein kinase II-activated chloride conductance in T84 colonic epithelial cells. J Biol Chem. 1996;271:14092–14097. doi: 10.1074/jbc.271.24.14092. [DOI] [PubMed] [Google Scholar]
- 39.Kaetzel MA, et al. Annexin VI isoforms are differentially expressed in mammalian tissues. Biochim Biophys Acta. 1994;1223:368–374. doi: 10.1016/0167-4889(94)90097-3. [DOI] [PubMed] [Google Scholar]
- 40.Nilius B, et al. Annexin II modulates volume-activated chloride currents in vascular endothelial cells. J Biol Chem. 1996;271:30631–30636. doi: 10.1074/jbc.271.48.30631. [DOI] [PubMed] [Google Scholar]
- 41.Muimo R. Regulation of CFTR function by annexin A2-S100A10 complex in health and disease. Gen Physiol Biophys. 2009;28 Spec No Focus:F14–F19. [PubMed] [Google Scholar]
- 42.Tian Y, et al. Calmodulin-dependent activation of the epithelial calcium-dependent chloride channel TMEM16A. FASEB J. 2011;25:1058–1068. doi: 10.1096/fj.10-166884. [DOI] [PubMed] [Google Scholar]
- 43.Mazzochi C, Benos DJ, Smith PR. Interaction of epithelial ion channels with the actin-based cytoskeleton. Am J Physiol Renal Physiol. 2006;291:F1113–F1122. doi: 10.1152/ajprenal.00195.2006. [DOI] [PubMed] [Google Scholar]
- 44.Tang BL, Gee HY, Lee MG. The cystic fibrosis transmembrane conductance regulator’s expanding SNARE interactome. Traffic. 2011;12:364–371. doi: 10.1111/j.1600-0854.2011.01161.x. [DOI] [PubMed] [Google Scholar]
Associated Data
This section collects any data citations, data availability statements, or supplementary materials included in this article.


