

Abstract
Liver transplant tissues offer the unique opportunity to model the longitudinal protein abundance changes occurring during hepatitis C virus (HCV)-associated liver disease progression in vivo. In this study, our goal was to identify molecular signatures, and potential key regulatory proteins, representative of the processes influencing early progression to fibrosis. We performed global protein profiling analyses on 24 liver biopsy specimens obtained from 15 HCV+ liver transplant recipients at 6 and/or 12 months post-transplantation. Differentially regulated proteins associated with early progression to fibrosis were identified by analysis of the area under the receiver operating characteristic curve (AUC). Analysis of serum metabolites was performed on samples obtained from an independent cohort of 60 HCV+ liver transplant patients. Computational modeling approaches were applied to identify potential key regulatory proteins of liver fibrogenesis. Among 4,324 proteins identified, 250 exhibited significant differential regulation in patients with rapidly progressive fibrosis. Patients with rapid fibrosis progression exhibited enrichment in differentially regulated proteins associated with various immune, hepatoprotective, and fibrogenic processes. The observed increase in pro-inflammatory activity and impairment in anti-oxidant defenses suggests that patients who develop significant liver injury experience elevated oxidative stresses. This was supported by an independent study demonstrating the altered abundance of oxidative stress associated serum metabolites in patients who develop severe liver injury. Computational modeling approaches further highlight a potentially important link between HCV-associated oxidative stress and epigenetic regulatory mechanisms impacting on liver fibrogenesis. In conclusion, our proteome and metabolome analyses provide new insights into the role for increased oxidative stress in the rapid fibrosis progression observed in HCV+ liver transplant recipients. These findings may prove useful in prognostic applications for predicting early progression to fibrosis.
Keywords: liver biopsy, systems biology, protein bottleneck
Chronic HCV infection is associated with increased risk of developing progressive liver disease including hepatitis, fibrosis, cirrhosis, and hepatocellular carcinoma (HCC) (1). End-stage liver disease due to chronic infection remains the leading reason for liver transplantation, placing a major burden on healthcare services (2). Furthermore, liver-related deaths due to HCV are predicted to increase over the coming decades, as the size of the chronically infected population in the United States grows. The persistence/prevalence of HCV as a public health problem is exacerbated by the lack of a vaccine and severe side effects, high cost and limited efficacy of current treatment regimens. These factors indicate that the management of HCV would benefit from studies providing a better understanding of the biological mechanisms of HCV infection and liver disease progression. Further characterization of the host and viral factors required for replication and/or liver injury could aid in the identification of novel drug targets and biomarker candidates useful for disease staging, prediction of disease progression, and treatment.
High-throughput approaches characterizing differential mRNA expression, protein abundance, and enzyme activity on a genome-wide scale are being increasingly applied to numerous model systems of HCV, as well as clinical liver samples, in an attempt to gain new insights into the relationship between the host response to HCV infection and liver disease (3-8). One of the most important, but poorly understood, aspects of HCV infection in which these technologies are being applied are studies aimed at understanding the high variability in disease progression in patients with chronic HCV infection. In this regard, liver transplant tissues provide an excellent resource of well-characterized, sequential biopsy specimens from patients whose clinical course of recurrent HCV infection parallels the outcome of naturally occurring HCV infection, albeit on an accelerated timeline (9, 10). We previously described and recently confirmed transcriptional analyses demonstrating inherent differences in the immune response to HCV infection and early induction of genes related to hepatic stellate cell activation in liver transplant patients prior to histologic evidence of significant liver injury (8). These findings demonstrate the utility of high-throughput profiling studies using liver transplant tissue as a model to evaluate the molecular mechanisms underlying liver disease progression and identify differentially expressed “omics” patterns that may serve as useful markers of liver disease progression.
In this study we describe global proteome analyses demonstrating that patients with rapid fibrosis progression exhibit altered expression of proteins linked to immune, hepatoprotective, and fibrogenic processes. We further describe independent metabolite analyses consistent with proteome-based measurements suggesting a role for elevated oxidative stresses during the development of severe liver injury. Finally, we describe a computational modeling approach which utilized these high-throughput data to infer regulatory and functional relationship networks that provide information about the systems-level role of key host proteins of predicted importance in HCV-associated liver disease progression.
Experimental Procedures
Samples and statistical analyses
This study was approved by the Institutional Review Boards for Human Subject Review at both the University of Washington and Pacific Northwest National Laboratory in accordance with federal regulations. All percutaneous core needle biopsy and serum specimens were obtained with written informed consent from HCV-infected patients who underwent liver transplantation at the University of Washington Medical Center during 2003-2004. No donor livers were obtained from executed prisoners or other institutionalized persons. For proteome analysis, the analyzed cohort contained a total of 24 biopsy specimens obtained from 15 patients (Table S1). Statistical comparisons of clinical covariates were performed using JMP version 6.0 (SAS Institute, Cary NC) and are reported in Table 1. Independent Student's T-test was used for continuous variables and Two-Tailed Fisher's Exact Test for categorical variables. P values ≤ 0.05 were considered statistically significant. For metabolite analysis, the analyzed cohort contained serum samples from a total of 60 patients, including 6 represented in our proteome analysis (Table S2). All patients underwent transplantation due to HCV-associated cirrhosis, and all developed recurrent HCV infection. Fibrosis stage was scored by histological evaluation performed by a single pathologist using the Batts-Ludwig scoring system (11).
Table 1. Participant clinical characteristics.
| Non-Progressor (n = 8) | Progressor (n = 7) | |
|---|---|---|
| Recipient Age (yr) c | 55 (44 - 61) a | 62 (56 - 74) |
| Male [n (%)] | 8 (100) | 5 (71.43) |
| White [n (%)] | 7 (87.50) | 7 (100) |
| Past ETOH Abuse [n (%)] | 6 (75) | 3 (42.9) |
| Primary Transplant Diagnosis | ||
| HCV-HBV Coinfected [n (%)] | 2 (25) | 0 (0) |
| HCV-HCC Diagnosis [n (%)] | 1 (12.5) | 2 (28.6) |
| MELD Score at Time of Transplant | 20.1 (5.04) b | 18.2 (4.2) |
| Transplant Prior to 1/1/04 [n (%)] | 5 (62.5) | 2 (28.6) |
| Donor Age (yr) c | 28.9 (16 - 44) a | 49.1 (23 - 58) |
| Immune Suppression Drugs | ||
| On (T) Immune Suppressive [n (%)] | 7 (87.5) | 7 (100) |
| 3+ Immune Suppressive Medications [n (%)] | 3 (37.5) | 3 (42.9) |
| 1+ Treated Rejection Episodes [n (%)] | 2 (25) | 4 (57.1) |
| Fibrosis Stage ≥3 at 6mo post-OLT [n (%)] | 0 | 0 |
| Fibrosis Stage ≥3 at 12mo post-OLT [n (%)] c | 0 (0) | 7 (100) |
| Date of Most Recent Biopsy (month) | 66.4 (14.3) b | 56.3 (21.1) |
| Most Recent Fibrosis Stage ≥3 [n (%)] c | 2 (25) | 6 (85.7) |
| Clinical Cirrhosis at Most Recent Biopsy [n (%)] c | 2 (25) | 6 (85.7) |
Mean, range in parentheses for all such values
Mean, SD in parenthesis for all such values
Significantly different between Non-progressor and Progressor groups, P ≤0.05 (Student's T-test for continuous variables; 2-Tailed Fisher's Exact test for categorical variables).
Liquid chromatography-mass spectrometry (LC-MS) analysis
At the time of biopsy, all research samples were collected at the bedside, flash frozen, and stored at -80°C until use. Peptide digests were prepared as previously described (3, 5) and analyzed in triplicate utilizing a high mass accuracy LC-MS Exactive platform (Thermo Electron Corporation, San Jose, CA). Identification of the detected peptide peaks was performed utilizing the Accurate Mass and Time (AMT) Tag approach as previously described (3, 5, 12).
Proteomics data pre-processing
Data quality was assessed at the technical replicate level via Pearson correlation. Mass spectrometry runs exhibiting considerable deviation based on both correlation and peptide coverage in comparison to technical and biological replicates were removed from the dataset. A GA-filter was then applied as a minimal filter to remove peptides with inadequate data for statistical analysis (13). This yielded a total of 13,016 peptides with adequate peptide intensity reproducibility. Technical replicates were aligned via regression on the log10 intensity measurements and averaged to sample level estimates. The dataset was then normalized using a local mean centering based on a Rank Invariant Peptide (RIP) subset of 185 peptides and the resulting data are presented in Table S3.
Comparative proteome analyses
Patients were grouped into the liver disease progressor or non-progressor category based on the presence or absence of histologic evidence of severe liver injury (Batts-Ludwig fibrosis stages 3-4) at one year post-transplant (Figure 1). Identification of significantly differentially expressed proteins among patient groups was performed by computing area under the receiver operating characteristic (ROC) curve for binary comparisons, and visualized using singular value decomposition initialized multidimensional scaling (SVD-MDS) (14, 15) as described in Supplemental Methods and Materials.
Figure 1. Experimental Strategy for Proteome Analysis of HCV-Associated Liver Disease Using Liver Transplant Tissue to Model Disease Progression.
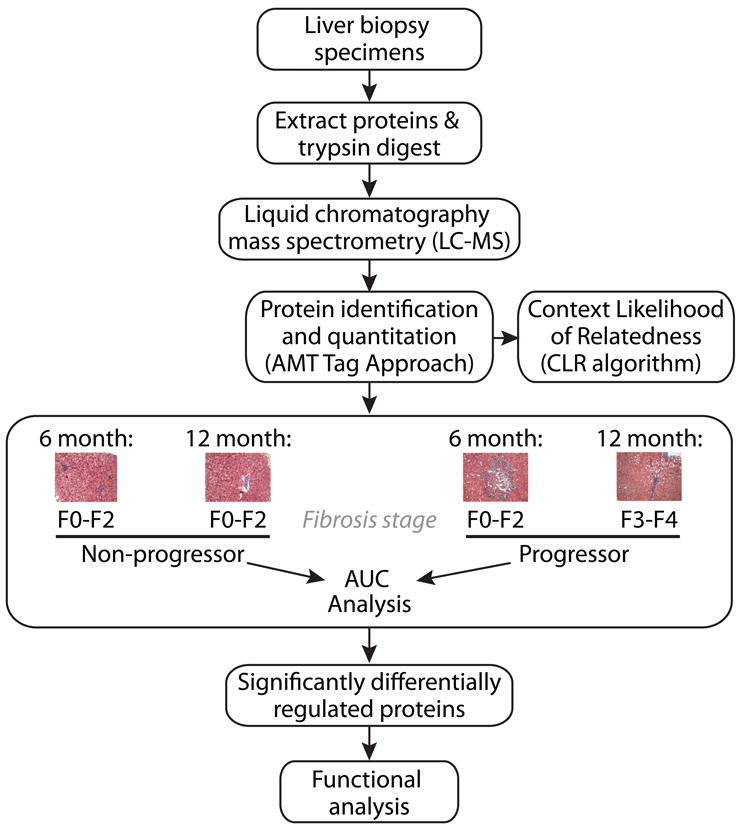
An outline of the workflow for comparative proteome analyses and associated modeling activities is shown here. Briefly, liver biopsy protein extracts were digested with trypsin and subjected to LC-MS analysis for protein identification and quantification using the AMT tag approach. These data supported computational modeling activities and comparative analyses aimed at identifying group-associated proteomic differences detected both before and after histologic evidence of liver disease progression. Patient samples were grouped into the liver disease progressor or non-progressor category based on the presence or absence of histologic evidence of severe liver injury (Batts-Ludwig fibrosis stages 3-4) at 1 year post-transplant, respectively. Significantly, no patient in our cohort exhibited histologic evidence of significant liver injury upon biopsy at 6 months post-transplant, supporting comparisons aimed at identifying prognostic protein abundance changes associated with liver disease progression. Functional enrichment analysis using IPA was performed to investigate the biological significance of the altered protein abundance pattern.
Serum collection and metabolite analysis
Samples were collected in 10 mL vacutainers (Becton Dickinson) and allowed to sit at room temperature for 15-30 minutes to allow clotting. The samples were then centrifuged at 3,000 × g for 15 minutes, the resulting supernatant aliquoted into CryoTube Vials and stored at -80°C until use. Unbiased metabolomic profiling using 100 μl of serum was carried out by Metabolon (Metabolon Inc, Durham, NC) using liquid/gas chromatography coupled to mass spectrometry (LC/GC–MS) as previously described (16-18).
Network generation and topological analysis
Co-abundance networks that relate proteins by similarity in their abundance profiles (patterns of expression across all patients) allow representation of system-level patterns in the data. A protein association network was constructed based on correlations between protein abundance such that proteins exhibiting similar abundances are connected in the network (12, 19). We then integrated information on known protein-protein interactions (http://cytoscape.wodaklab.org/wiki/Data_Sets), producing a master network of connected cellular processes. The topology (connectivity of proteins) in the network was then calculated using the igraph library in R. The connectivity of proteins or genes in biological networks can provide insight into their relative importance. Briefly, protein or gene “hubs” exhibiting a high degree of connectivity (connected to many other proteins or genes) and “bottlenecks” exhibiting a high betweenness (key connectors of sub-networks within a network) represent central points for controlling communication within a network and tend to play an essential role in growth, virulence and targeting by pathogens (12, 19-22). Bottlenecks were considered to be the top 20% of proteins as ranked by betweeness (20-22), though all observations were similar using 10% and 5% thresholds. Statistical significance was calculated using a Fisher's exact test and p values less than 0.05 were considered significant.
Functional enrichment analysis
Ingenuity Pathways Analysis software (IPA, Ingenuity Systems, Inc., Redwood City, CA; www.ingenuity.com) was used to analyze statistically significant protein abundance differences identified within the context of known biological responses and regulatory networks. For all analyses, the 4,324 total proteins identified in this study provided the background for determination of functional enrichment using Fisher's exact test, a standard method for determining statistical enrichment of molecules within biological pathways or functions in the IPA knowledge base. The right-tailed Fisher's Exact test reflects the likelihood that pathways or functions have more molecules represented within them from the total list of significant proteins than would be expected by random chance alone. IPA analysis was applied to statistically significant protein abundance changes before application of filtering criteria (397 proteins total) and after background correction and filtering for missing data (i.e. the 250 proteins total presented in Fig. 2). The enrichment of differentially regulated proteins linked to the various biological functions described was well conserved (not shown) thus, facilitating efforts to focus biological interpretation on the most uniform responses.
Figure 2. Group-associated proteomic differences occur during rapid fibrosis progression in the transplant setting.

Proteins identified as significantly different between progressor and non-progressor patients were subjected to SVD-MDS. The data were filtered to include only those proteins detected in a minimum of 8 samples, to minimize adverse effects of missing data points on the consistency of clustering. Pearson's Correlation Coefficients were used as distance metrics. (A) SVD-MDS representation in 3D. The biologic conditions are indicated as progressors (red) and non-progressors (blue), and the convex hulls are shaded accordingly and do not overlap. Kruskal Stress (“E”) was computed to indicate 24% of total information loss during dimensionality reduction. External isolation (“E.I.”) and Internal Cohesiveness (“I.C.”) were computed as reference for subsequent representations (see also Figure S2). (B) SVD-MDS representation in 2D, including time post-OLT (triangles and circles). E, EI, IC as above. A complete list of the 250 significantly different proteins and their corresponding AUC values can be found in Table S4.
Results
Global Comparative Proteome Responses in HCV-Infected Liver Transplant Tissue Distinguish Fibrosis Progressor from Non-Progressor Patients
Global comparative proteome analyses aimed at identifying molecular signatures representative of the processes influencing early progression to fibrosis were carried out as described in Figure 1. Using a label-free LC-MS strategy incorporating the AMT tag approach we identified a total of 13,016 peptides corresponding to 4,324 proteins in the entire study (Tables S3 and S4, respectively). Proteins exhibiting statistically significant differences between patient groups were first analyzed via 2D complete-linkage hierarchical clustering using Pearson's correlation coefficients (Figure S1A). Relative abundance patterns of these selected proteins tend to cluster together, separating progressors from non-progressors with few exceptions. Moreover, consecutive biopsies coming from the same patient tend to cluster together, and simultaneously progressors display a correlation in their protein abundance to a greater extent than non-progressors (Figure S1B). Using the SVD-MDS dimensionality reduction technique, we demonstrated that this protein signature can completely segregate progressor from non-progressor patients in 3D space (Figure 2A), capturing the critical information with respect to progressors and non-progressors, as well as biologic variability in these groups when compared to initial, unfiltered SVD-MDS analysis (Figure S2). Using SVD-MDS, the loss of information during the dimensionality reduction process was quantified as only 24%, indicating that the signature captures the main characteristics of the difference between progressors and non-progressors. Note that the convex hulls over the two patient groups do not intersect, and thus complete separation is achieved. In order to better visualize this data, we also computed SVD-MDS representations in two dimensions (Figure 2B, Figure S1). Again the segregation between progressors and non-progressors is evident. We then tested 250 proteins, 154 up-regulated and 96 down-regulated, that define the clusters shown in Figure 2, for confounding factors. The signature is robust against time (Figure 2B) and all the potential confounding clinical factors listed in Figure S3. The calculation of external isolation (E.I., a measure for how well individual biologic conditions separate) and internal cohesiveness (I.C., a measure for how well members of a single biological condition cluster together), and indicated in the different panels, allow quantification of this statement when compared to Figure 2A and 2B. In conclusion, the subset of statisticially significant differentially abundant proteins may indicate whether a patient will progress to severe liver disease post-transplant. Consistent with the literature, we observed a significantly greater mean donor age in patients with rapidly progressive fibrosis (Table 1).
The biological significance of the altered protein abundance pattern described above was further investigated by classifying the associated proteins within the context of biologically relevant functions using IPA. Patients with rapid fibrosis progression exhibited an enrichment of down-regulated proteins mapping to signaling or disease pathways associated with hepatoprotective activities while up-regulated proteins mapped to various immune response pathways (Table 2 and Table S6). With regard to the latter, the representation of allograft rejection signaling pathways reflects the functional redundancy of proteins associated with inflammatory conditions attributed to viral recurrence or graft rejection, processes that are difficult to discern as they are histologically indistinguishable. We note that all patients received different combinations of immune-suppressing drugs, including treatment for graft rejection that trended with rapid fibrosis progression at 1 year post-transplant (Table 1). However, we did detect differential regulation of biological processes such as pro-inflammatory innate immune activities and positive regulation of interferon gamma (IFN-γ protein expression and down-stream targets consistent with those described during the transcriptional deregulation associated specifically with HCV recurrence, rather than acute cellular rejection (23). Not surprisingly, patients with progressive liver disease further exhibited an enrichment of differentially regulated proteins mapping to the IPA toxicologic functional category of liver fibrosis, including proteins associated with hepatic stellate cell activation (p < 0.05), and demonstrate the possibility of detecting protein abundance profiles consistent with hepatic damage weeks or months prior to clinical evidence of liver injury. Pathways and functions identified by IPA were used as an unbiased guideline for further exploring the biological implications of the corresponding differentially abundant proteins that preceded detectable pathologic changes.
Table 2. Top canonical pathways represented by proteins differentially regulated in rapid progressor patients.
| Top Canonical Pathwaysa | P Value |
|---|---|
| Lower Expression in Rapid Progressors | |
| 1. Aryl Hydrocarbon Receptor Signaling | 1.80E-04 |
| 2. Glutathione Metabolism | 7.29E-04 |
| 3. Metabolism of Xenobiotics by Cytochrome P450 | 1.12E-03 |
| 4. NRF2-mediated Oxidative Stress Response | 2.25E-03 |
| 5. Xenobiotic Metabolism Signaling | 5.27E-03 |
| Higher Expression in Progressors | |
| 1. CTLA4 Signaling in Cytotoxic T Lymphocytes | 1.27E-03 |
| 2. Cytotoxic T Lymphocyte-mediated Apoptosis of Target Cells | 1.35E-03 |
| 2. Allograft Rejection Signaling | 1.35E-03 |
| 3. OX40 Signaling Pathway | 1.35E-03 |
| 5. Graft-vs-Host Disease Signaling | 2.43E-03 |
Canonical pathways represent well-established signaling or disease pathways in IPA. Ranking of pathways within each group was based on an FDR-adjusted P value determined by IPA. A summary report containing the proteins mapped to each canonical pathway is provided in Supplemental Table S3.
Differential Regulation of Immune Response & Inflammatory Proteins Precedes Fibrosis Progression
Figure 3 highlights the differentially regulated proteins associated with the significant biological pathways and functions noted above. These include immune response proteins indicative of an early and sustained up-regulation of pro-inflammatory, type 1 acute phase protein production [pre-angiotensinogen (AGT), serum amyloid A1 (SAA1)]. We further observed an increase in the abundance of proteins associated with various aspects of immune cell recruitment, adhesion and/or activation, including candidates functioning in phagocytosis, ubiquitin-mediated proteolysis and class I and II antigen presentation [leukotriene A4 hydrolase (LTA4H), CD44 antigen (CD44), bone marrow stromal cell antigen 2 (BST2), proteasome beta subunit type 4 (PSMB4), major histocompatibility class 1 antigen C (HLA-C), major histocompatibility class 2 antigen DR beta 1 (HLA-DRB1), cytochrome b-245 beta (CYBB)]. Together, the data show a pattern of increased immune and inflammatory protein abundances observed prior to histologic evidence of significant fibrosis.
Figure 3. An overview of the differentially regulated proteins mapping to significant biological pathways and functions identified by IPA.

A) Proteins are organized within the generalized groupings immune/inflammatory response (i.e. the canonical pathways with higher expression in progressors), hepatoprotection (i.e. the canonical pathways with lower expression in progressors), and fibrosing liver injury (i.e. proteins associated with the toxicologic functional category of liver fibrosis). Proteins with AUC values > 0.6 were significantly up-regulated in rapid progressors both before and after histologic evidence of significant liver injury (highlighted in yellow) while those with AUC values < 0.4 were down-regulated (highlighted in blue). B) Molecular events in HCV-associated fibrogenesis. Patients with rapidly progressive liver disease exhibit altered immune/inflammatory responses and impaired anti-oxidant defenses, resulting in elevated oxidative stresses that promote liver fibrogenesis. The gene symbols and corresponding protein description are provided here. Additional information including the corresponding Swiss-Prot database accession number and EntrezGene identifier are also available in Table S4. ADK: adenosine kinase; AGT: pre-angiotensinogen; AKR7L: aldo-keto reductase family 7-like; ALDH1A3: aldehyde dehydrogenase 1 family, member A3; AP1G1: adaptor-related protein complex 1, gamma 1 subunit; ARHGDIA: Rho GDP dissociation inhibitor (GDI) alpha; ASAH2B: N-acylsphingosine amidohydrolase 2B; ATRX: alpha thalassemia/mental retardation syndrome X-linked; BAX: BCL2-associated X protein; BCAP31: B-cell receptor-associated protein 31; BCL10: B-cell CLL/lymphoma 10; BST2: bone marrow stromal cell antigen 2; CA2: carbonic anhydrase 2; CA4: carbonic anhydrase 4; CBS: cystathionine beta synthase; CD44: CD44 antigen (Indian blood group); CDC42: cell division cycle 42 (GTP binding protein, 25kDa); CDK2: cyclin-dependent kinase 2; CHP: calcium-binding protein P22; CLCN3: chloride channel 3; CLTB: clathrin, light chain B; CMBL: carboxymethylenebutenolidase homolog; CRIP2: cysteine-rich protein 2; CTSZ: cathepsin Z; CYBB: cytochrome b-245 beta; DDB2: damage-specific DNA binding protein 2, 48kDa; DGCR8: DiGeorge syndrome critical region gene 8; DNAJA2: DnaJ (Hsp40) homolog, subfamily A, member 2; DNASE2: deoxyribonuclease II, lysosomal; ELF4: E74-like factor 4 (ets domain transcription factor); EPCAM: epithelial cell adhesion molecule; FAM3C: family with sequence similarity 3, member C; FDX1: ferredoxin 1; FKBP14: FK506 binding protein 14; FLNC: filamin C, gamma; FMO4: flavin containing monooxygenase 4; GAB3: GRB2-associated-binding protein 3; GNG10: guanine nucleotide binding protein (G protein), gamma; GSTA1: glutathione S-transferase alpha 1; GSTA2: glutathione S-transferase alpha 2; GSTA3: glutathione S-transferase alpha 3; GSTA5: glutathione S-transferase alpha 5; GSTK1: glutathione S-transferase kappa 1; GSTT1: glutathione S-transferase theta 1; GULP1: GULP, engulfment adaptor PTB domain containing 1; HLA-C: major histocompatibility class I antigen C; HLA-DPB1: major histocompatibility class 2 antigen DP beta 1; HLA-DRB1: major histocompatibility class 2 antigen DR beta 1; HMGA1 high mobility group AT-hook 1; HPX: hemopexin; HSPA7: heat shock 70kDa protein 7 (HSP70B); HSPE1: heat shock 10kDa protein 1 (chaperonin 10); IGFBP7: insulin-like growth factor-binding protein 7; ITSN1: intersectin 1; IQSEC1: IQ motif and Sec7 domain 1; KRT15: keratin 15; LGALS1: galectin 1; LGALS3: galectin 3; LTA4H: leukotriene A4 hydrolase; MECP2: methyl-CpG-binding protein 2 (Rett syndrome); MSN: moesin; MYH11: myosin, heavy chain 11, smooth muscle; NCOA2: nuclear receptor coactivator 2; NEXN: nexilin; NFX1: nuclear transcription factor, X-box binding 1; NOTCH1: notch 1; PABPN1: polyadenylate-binding protein, nuclear 1; PFKM: phosphofructokinase, muscle; PIK3C3: phosphoinositide-3-kinase, class 3; PNKD: paroxysmal nonkinesigenic dyskinesia; PPP2R2A: protein phosphatase 2, regulatory subunit B, alpha; PSMB4: proteasome beta subunit type 4; PRAP1: proline-rich acidic protein 1; RMP: RNA polymerase II, subunit 5-mediating protein; SAA1: serum amyloid A1; SAA3P: putative serum amyloid A-3 protein; SIN3B: SIN3 homolog B, transcription regulator (yeast); SOD1: superoxide dismutase 1; SOX9: SRY (sex determining region Y)-box 9; SULT1A3: aryl sulfotransferase 1A3; STUB1: STIP1 homology and U box-containing protein 1; STX18: syntaxin-18; TGIF2: TGFB-induced factor homeobox 2; TMSB10: thymosin beta-10; TMSB4X: thymosin beta-4; TPM1: tropomyosin 1 (alpha); TXNRD1: thioredoxin reductase 1; USP36: ubiquitin specific peptidase 36; XRN1: 5′-3′ exoribonuclease 1.
Fibrosis Progression is Associated with the Altered Expression of Hepatoprotective Proteins Observed Prior to Histologically Detected Liver Injury
Patients with rapidly progressive fibrosis exhibited a decreased abundance of proteins functioning in hepatoprotective responses associated with superoxide, cysteine, glutathione, and xenobiotic metabolism [superoxide dismutase 1 (SOD1), cystathionine beta synthase (CBS), various glutathione-S-transferases (GSTs), FK506 binding protein 14 (FKBP14), carboxymethylenebutenolidase homolog (CMBL)] (Figure 3). These findings suggest that patients with rapidly progressive fibrosis are likely to experience increased oxidative stress. Consistent with this idea we further observed an increase in the abundance of proteins which function to counteract damaging protein and DNA modifications caused by reactive oxidants [aryl sulfotransferase 1A3 (SULT1A3), thioredoxin reductase 1 (TXNRD1), alpha thalassemia/mental retardation syndrome X-linked (ATRX), 5′-3′ exoribonuclease 1 (XRN1)] (Figure 3).
Proteins Implicated in Fibrosing Liver Injury are Differentially Expressed in Patients with Rapidly Progressive Liver Disease
Early progression to fibrosis was further associated with the co-ordinated up- and down-regulation of proteins previously linked to epithelial-to-mesencyhmal transition (EMT) [family with sequence similarity 3, member C (FAM3C), nexilin (NEXN), CD44, epithelial cell adhesion molecule (EPCAM)], a process recognized as a potential contributor to liver fibrogenesis (24-26). A concomitant up-regulation of cytokines [galectin 3 (LGALS3), insulin-like growth factor binding protein 7 (IGFBP7), AGT] and cytoskeletal/membrane proteins [tropomyosin 1 (TPM1), myosin, heavy chain 11 (MYH11), N-acylsphingosine amidohydrolase 2B (ASAH2B)] that have been previously associated with the proliferative and contractile phenotype of activated hepatic stellate cells (HSC) was also observed (8, 25, 27, 28). These data represent, to our knowledge, the first characterization of related longitudinal global protein abundance patterns in transplantation specimens, providing the foundation for further characterization in specific cell populations via methods such as immunohistochemistry or proteome analysis of laser capture microdissected cells.
Patients with Rapidly Progressive Fibrosis Exhibit Altered Abundance of Serum Metabolites Associated with Oxidative Stress
Complementary metabolomic analyses were performed in an independent group of 60 HCV+ liver transplant recipients to determine whether surrogate markers for altered hepatic function are detectable in serum. Among 396 compounds of known identity, 99 were differentially regulated in patients with rapid fibrosis progression (Table S5). Notably, we observed alterations in the abundance of numerous metabolites indicative of oxidative stress, including elevated expression of several gamma-glutamyl peptides associated with increased glutathione turnover (Fig. 4, Table S5). This contrasts with the observed decline in cysteine, an important precursor of glutathione biosynthesis, whose decreased expression was inversely correlated with that of amino acids (methionine and serine) involved in its biosynthesis (Fig. 4). These results are consistent with proteomic data suggesting increased oxidative stress in liver transplant recipients who develop significant liver injury, including perturbations in glutathione homeostasis.
Figure 4. Box and Whiskers plots of differentially regulated serum metabolites associated with oxidative stress.

A selection of time-matched samples for binary comparison of mild (30 with stage 0-1 fibrosis) versus severe (30 with stage 3-4 fibrosis) liver disease were analyzed. A) Representative examples of gamma-glutamyl peptides that were significantly increased (P < 0.05) in HCV infected liver transplant patients who develop significant liver injury. B) Metabolites involved in cysteine biosynthesis that were significantly different between the mild and severe disease groups. Median scaled values are presented on the y-axis.
Computational Modeling Efforts Identify Protein Bottlenecks Potentially Important in HCV-Associated Liver Disease Progression
We previously described the use of computational models incorporating proteomic data together with a combination of gene silencing and pharmacologic inhibition approaches identified and subsequently confirmed the role of the bottleneck protein dodecenoyl coenzyme A delta isomerase (DCI) in HCV replication (12, 19). To gain further insight into proteins which may play an important role in fibrogenesis, we applied this approach to these proteomic data and constructed an integrated protein association network, identifying 340 protein bottlenecks (the top 20% of proteins ranked by betweenness, as described in the experimental procedures). We observed that 10 differentially regulated proteins determined by AUC analysis were among the bottlenecks (Table 3; Table S7). These include proteins implicated in viral protein translation [poly(rC) binding protein 1 (PCBP1)], hepatic stellate cell activation and smooth muscle contractility [transcription elongation regulator 1 (TCERG1), protein kinase A RII alpha (PRKAR2A), MYH11, TPM1], liver regeneration [DiGeorge syndrome critical region gene 8 (DGCR8)], and chaperoning of the metabolic regulator adiponectin [glutathione S-transferase kappa 1 (GSTK1)] (29-34).
Table 3. Differentially Regulated Protein Bottlenecks.
| SwissPROT ID | Description | Gene Symbol | Median Protein AUC | Biological Functiona |
|---|---|---|---|---|
| P13861 | cAMP-dependent protein kinase type II-alpha regulatory subunit | PRKAR2A | 0.27 | signal transduction |
| O14776 | Transcription elongation regulator 1 | TCERG1 | 0.31 | transcriptional coactivator |
| Q8WYQ5-3 | Isoform 3 of Microprocessor complex subunit DGCR8 | DGCR8 | 0.37 | microRNA processing |
| O43709 | Uncharacterized methyltransferase WBSCR22 | WBSCR22 | 0.62 | putative methyltransferase |
| P35749 | Myosin-11 | MYH11 | 0.64 | contractile protein |
| Q15365 | Poly(rC)-binding protein 1 | PCBP1 | 0.64 | major cellular poly(rC)-binding protein, translational regulator |
| Q9Y2Q3 | Glutathione S-transferase kappa 1 | GSTK1 | 0.66 | conjugation of glutathione during cellular detoxification |
| P09493 | Tropomyosin alpha-1 chain | TPM1 | 0.67 | contractile protein |
| O60925 | Prefoldin subunit 1 | PFDN1 | 0.69 | chaperone |
| P60953 | Cell division control protein 42 homolog | CDC42 | 0.74 | Rho-subfamily GTPase involved in muscle cell differentation |
Functional analysis was performed using IPA as described in the Methods.
Discussion
Global Proteome Analyses Provide Insights into HCV-Associated Liver Disease Progression
This study provides the first demonstration of global proteome alterations preceding histologic evidence of HCV-associated liver disease progression in the transplant setting. Our data demonstrate alterations in well-known immune response proteins that are consistent with those described in a companion paper detailing the dynamic transcriptional reprogramming that occurs during HCV-associated liver disease progression in the transplant setting (Rasmussen et al, manuscript submitted). For example, while a broad repression of genes related to antigen presentation and immune responses was observed at the earliest time points monitored (0-3 months post-transplantation), patients with progressive liver disease exhibited a subsequent increase in genes associated with inflammatory responses and immune cell trafficking, including HLA alleles, over later time points coinciding with those of our proteome analyses (6-12 months post-transplant). Together these findings suggest that early immune repression increased hepatocyte permissiveness to infection or enhanced viral replication, resulting in a subsequent elevation in host antiviral immune and inflammatory activities contributing to fibrogenesis.
The overall pro-inflammatory proteomic profile and concomitant decline in proteins functioning to detoxify potent reactive oxidants suggests that patients with rapidly progressive fibrosis experience greater oxidative stress. We further explored this hypothesis in an independent group of HCV+ liver transplant recipients, demonstrating that patients who develop severe liver disease exhibit a unique metabolic profile characterized by marked changes in compounds associated with alterations in glutathione homeostasis and oxidative stress. The increased expression of gamma-glutamyl peptides is consistent with that previously described for a number of liver diseases, including HCV (17, 18, 35). We further observed a decrease in cysteine expression accompanied by an accumulation of amino acids upstream of the cysteine biosynthesis pathway involving CBS, a protein which was less abundant in patients with rapid fibrosis progression. Previous studies demonstrated an important role for CBS in hepatoprotection against oxidative stress and lipid peroxidation, and indicated that impaired CBS activity contributes to similar metabolic perturbations during acetaminophen-induced oxidative stress (36, 37). Although we cannot rule out potentially confounding genetic, dietary, environmental, or clinical variables as an underlying cause, our findings are consistent with previous studies that observed increases in oxidative stress in HCV+ liver transplant recipients relative to non-transplanted patients or control subjects (38) and, further suggest that HCV+ liver transplant recipients with rapidly progressive fibrosis experience greater levels of oxidative stress relative to their non-progressor counterparts prior to histologic evidence of liver injury. This provides new insights into a potential role for glutathione homeostasis in HCV pathogenesis, and future studies should examine this connection in greater detail.
Alterations in the expression of numerous proteins implicated in fibrogenic processes also occurred prior to histologic evidence of liver disease progression. These include examples of both transcriptionally (LGALS3, IGFBP7) and post-transcriptionally (FAM3C) regulated protein abundance increases (8, 24, 25, 28). The observed up-regulation of FAM3C is of particular interest given a recent study reporting an important role for transforming growth factor beta (TGFβ)-mediated translational induction of this protein during EMT, a process which may contribute to fibrogenesis (24). These findings highlight the value of complementary protein-level measurements for monitoring regulatory events that may play an important role in HCV-associated liver disease progression and would otherwise go undetected by transcriptome analyses.
Finally, we extended our computational modeling efforts to identify key host processes/proteins involved in HCV replication (12, 19) to the analysis of the clinical proteomic data generated here to identify differentially expressed proteins that may regulate liver fibrogenesis. We identified several contractile proteins associated with an activated HSC phenotype, including PRKAR2A and TPM1 (29, 32). We are especially interested in investigating the functional significance of the network bottleneck PRKAR2A, given the recently described role for epigenetic mechanisms involving histone deacetylase (HDAC) activity in the down-regulation of PRKAR2A abundance and subsequent uterine smooth muscle cell contractility occurring during pregnancy and labor (29). A similar increase in HDAC activity has been reported in HCV full-length replicon cells during elevated ROS production and, a role for HDAC activity in the in vitro differentiation of hepatic stellate cells has been described (39, 40). Based on these findings, we speculate that oxidative stress in patients with rapid fibrosis progression may contribute to hepatic fibrogenesis by modulating epigenetic regulatory mechanisms impacting PRKAR2A abundance and HSC activation. Efforts are now underway to leverage the most recent advances in proteomics technologies and animal model systems to further explore the role of epigenetic regulatory mechanisms in HCV-associated liver disease progression at both the organ and cellular level (41, 42).
In summary, our proteome and metabolome analyses suggest a potential role for oxidative stress in the rapid fibrosis progression observed in HCV+ liver transplant recipients. We further propose that differentially abundant protein bottlenecks identified by integrative network analysis may regulate processes contributing to HCV-associated liver disease progression, and merit further investigation to understand their functional significance. Several of these proteins have been detected in blood suggesting that they, and the differentially abundant serum metabolites, may prove useful in non-invasive, prognostic applications for predicting early progression to fibrosis.
Supplementary Material
Acknowledgments
We thank Zachary Caldwell for assistance with sample preparation. We also thank Dr. Janine Bryan for critically reading the manuscript and expert editorial support. We further acknowledge Dr. Steven Self for statistical support in clinical covariate analyses for our metabolome studies.
Financial Support: This work was supported by the National Institute on Drug Abuse (grant 1P30DA01562501 to M.G.K.). The proteomics measurements were performed in the Environmental Molecular Sciences Laboratory, a national scientific user facility sponsored by the DOE and located at Pacific Northwest National Laboratory, which is operated by Battelle Memorial Institute for the DOE under Contract DE-AC05-76RL0 1830, and utilized capabilities developed under NCRR grant RR018522 (to R.D.S.). JFGD is recipient of a CONACYT-Mexico Ph.D. Fellowship (No.: 207676/302245). Portions of this work were supported by the Washington State Life Sciences Discovery Fund (ID 2037574 to RDS).
Abbreviations
- AUC
area under the receiver operating characteristic curve
- HCV
hepatitis C virus
- PRKAR2A
protein kinase A RII alpha
- SVD-MDS
singular value decomposition initialized multidimensional scaling
Contributor Information
Deborah L. Diamond, Email: ddiamond@u.washington.edu.
Alexei L. Krasnoselsky, Email: akrasnos@u.washington.edu.
Kristin E. Burnum, Email: Kristin.Burnum@pnnl.gov.
Matthew E. Monroe, Email: Matthew.Monroe@pnl.gov.
Bobbie-Jo Webb-Robertson, Email: bobbie-jo.webb-robertson@pnnl.gov.
Jason E. McDermott, Email: jason.mcdermott@pnnl.gov.
Matthew M. Yeh, Email: myeh@u.washington.edu.
Jose Felipe Golib Dzib, Email: golib@ihes.fr.
Nathan Susnow, Email: nsusnow@gmail.com.
Susan Strom, Email: SusanSt@medicine.washington.edu.
Sean C. Proll, Email: proll@u.washington.edu.
Sarah E. Belisle, Email: sbelisle@u.washington.edu.
David E. Purdy, Email: purdyd@u.washington.edu.
Angela L. Rasmussen, Email: arasmus@u.washington.edu.
Kathie-Anne Walters, Email: Kathie.Walters@systemsbiology.org.
Jon M. Jacobs, Email: Jon.Jacobs@pnnl.gov.
Marina A. Gritsenko, Email: marina.gritsenko@pnnl.gov.
David G. Camp, Email: Dave.Camp@pnnl.gov.
Renuka Bhattacharya, Email: renukab@medicine.washington.edu.
James D. Perkins, Email: theperk@u.washington.edu.
Robert L. Carithers, Jr., Email: RobertC@medicine.washington.edu.
Iris W. Liou, Email: IrisL@medicine.washington.edu.
Anne M. Larson, Email: Anne.Larson@swedish.org.
Arndt Benecke, Email: arndt@ihes.fr.
Katrina M. Waters, Email: katrina.waters@pnnl.gov.
Richard D. Smith, Email: dick.smith@pnnl.gov.
Michael G. Katze, Email: honey@u.washington.edu.
References
- 1.Alter MJ, Margolis HS, Krawczynski K, Judson FN, Mares A, Alexander WJ, Hu PY, et al. The natural history of community-acquired hepatitis C in the United States. The Sentinel Counties Chronic non-A, non-B Hepatitis Study Team. N Engl J Med. 1992;327:1899–1905. doi: 10.1056/NEJM199212313272702. [DOI] [PubMed] [Google Scholar]
- 2.Kim WR. The burden of hepatitis C in the United States. Hepatology. 2002;36:S30–34. doi: 10.1053/jhep.2002.36791. [DOI] [PubMed] [Google Scholar]
- 3.Diamond DL, Jacobs JM, Paeper B, Proll SC, Gritsenko MA, Carithers RL, Jr, Larson AM, et al. Proteomic profiling of human liver biopsies: hepatitis C virus-induced fibrosis and mitochondrial dysfunction. Hepatology. 2007;46:649–657. doi: 10.1002/hep.21751. [DOI] [PubMed] [Google Scholar]
- 4.Diamond DL, Proll SC, Jacobs JM, Chan EY, Camp DG, 2nd, Smith RD, Katze MG. HepatoProteomics: applying proteomic technologies to the study of liver function and disease. Hepatology. 2006;44:299–308. doi: 10.1002/hep.21318. [DOI] [PubMed] [Google Scholar]
- 5.Jacobs JM, Diamond DL, Chan EY, Gritsenko MA, Qian W, Stastna M, Baas T, et al. Proteome analysis of liver cells expressing a full-length hepatitis C virus (HCV) replicon and biopsy specimens of posttransplantation liver from HCV-infected patients. J Virol. 2005;79:7558–7569. doi: 10.1128/JVI.79.12.7558-7569.2005. [DOI] [PMC free article] [PubMed] [Google Scholar]
- 6.Pezacki JP, Singaravelu R, Lyn RK. Host-virus interactions during hepatitis C virus infection: a complex and dynamic molecular biosystem. Mol Biosyst. 2010;6:1131–1142. doi: 10.1039/b924668c. [DOI] [PubMed] [Google Scholar]
- 7.Walters KA, Katze MG. Using high-throughput genomics to study hepatitis C: what determines the outcome of infection? Antiviral Res. 2009;81:198–208. doi: 10.1016/j.antiviral.2008.12.005. [DOI] [PMC free article] [PubMed] [Google Scholar]
- 8.Smith MW, Walters KA, Korth MJ, Fitzgibbon M, Proll S, Thompson JC, Yeh MM, et al. Gene expression patterns that correlate with hepatitis C and early progression to fibrosis in liver transplant recipients. Gastroenterology. 2006;130:179–187. doi: 10.1053/j.gastro.2005.08.015. [DOI] [PubMed] [Google Scholar]
- 9.Rodriguez-Luna H, Douglas DD. Natural history of hepatitis C following liver transplantation. Curr Opin Infect Dis. 2004;17:363–371. doi: 10.1097/01.qco.0000136934.06039.01. [DOI] [PubMed] [Google Scholar]
- 10.Shuhart MC, Bronner MP, Gretch DR, Thomassen LV, Wartelle CF, Tateyama H, Emerson SS, et al. Histological and clinical outcome after liver transplantation for hepatitis C. Hepatology. 1997;26:1646–1652. doi: 10.1002/hep.510260638. [DOI] [PubMed] [Google Scholar]
- 11.Batts KP, Ludwig J. Chronic hepatitis. An update on terminology and reporting. Am J Surg Pathol. 1995;19:1409–1417. doi: 10.1097/00000478-199512000-00007. [DOI] [PubMed] [Google Scholar]
- 12.Diamond DL, Syder AJ, Jacobs JM, Sorensen CM, Walters KA, Proll SC, McDermott JE, et al. Temporal proteome and lipidome profiles reveal hepatitis C virus-associated reprogramming of hepatocellular metabolism and bioenergetics. PLoS Pathog. 2010;6:e1000719. doi: 10.1371/journal.ppat.1000719. [DOI] [PMC free article] [PubMed] [Google Scholar]
- 13.Webb-Robertson BJ, McCue LA, Waters KM, Matzke MM, Jacobs JM, Metz TO, Varnum SM, et al. Combined statistical analyses of peptide intensities and peptide occurrences improves identification of significant peptides from MS-based proteomics data. J Proteome Res. 2010;9:5748–5756. doi: 10.1021/pr1005247. [DOI] [PMC free article] [PubMed] [Google Scholar]
- 14.Becavin C, Benecke A. New dimensionality reduction methods for the representation of high dimensional ‘omics’ data. Expert Rev Mol Diagn. 2011;11:27–34. doi: 10.1586/erm.10.95. [DOI] [PubMed] [Google Scholar]
- 15.Becavin C, Tchitchek N, Mintsa-Eya C, Lesne A, Benecke A. Improving the efficiency of multidimensional scaling in the analysis of high-dimensional data using singular value decomposition. Bioinformatics. 2011;27:1413–1421. doi: 10.1093/bioinformatics/btr143. [DOI] [PubMed] [Google Scholar]
- 16.Evans AM, DeHaven CD, Barrett T, Mitchell M, Milgram E. Integrated, nontargeted ultrahigh performance liquid chromatography/electrospray ionization tandem mass spectrometry platform for the identification and relative quantification of the small-molecule complement of biological systems. Anal Chem. 2009;81:6656–6667. doi: 10.1021/ac901536h. [DOI] [PubMed] [Google Scholar]
- 17.Kalhan SC, Guo L, Edmison J, Dasarathy S, McCullough AJ, Hanson RW, Milburn M. Plasma metabolomic profile in nonalcoholic fatty liver disease. Metabolism. 2011;60:404–413. doi: 10.1016/j.metabol.2010.03.006. [DOI] [PMC free article] [PubMed] [Google Scholar]
- 18.Roe B, Kensicki E, Mohney R, Hall WW. Metabolomic profile of hepatitis C virus-infected hepatocytes. PLoS One. 2011;6:e23641. doi: 10.1371/journal.pone.0023641. [DOI] [PMC free article] [PubMed] [Google Scholar]
- 19.Rasmussen AL, Diamond DL, McDermott JE, Gao X, Metz TO, Matzke MM, Carter VS, et al. Systems virology identifies a mitochondrial Fatty Acid oxidation enzyme, dodecenoyl coenzyme a delta isomerase, required for hepatitis C virus replication and likely pathogenesis. J Virol. 2011;85:11646–11654. doi: 10.1128/JVI.05605-11. [DOI] [PMC free article] [PubMed] [Google Scholar]
- 20.Dyer MD, Murali TM, Sobral BW. The landscape of human proteins interacting with viruses and other pathogens. PLoS Pathog. 2008;4:e32. doi: 10.1371/journal.ppat.0040032. [DOI] [PMC free article] [PubMed] [Google Scholar]
- 21.McDermott JE, Taylor RC, Yoon H, Heffron F. Bottlenecks and hubs in inferred networks are important for virulence in Salmonella typhimurium. J Comput Biol. 2009;16:169–180. doi: 10.1089/cmb.2008.04TT. [DOI] [PubMed] [Google Scholar]
- 22.Yu H, Kim PM, Sprecher E, Trifonov V, Gerstein M. The importance of bottlenecks in protein networks: correlation with gene essentiality and expression dynamics. PLoS Comput Biol. 2007;3:e59. doi: 10.1371/journal.pcbi.0030059. [DOI] [PMC free article] [PubMed] [Google Scholar]
- 23.Gehrau R, Maluf D, Archer K, Stravitz R, Suh J, Le N, Mas V. Molecular pathways differentiate hepatitis C virus (HCV) recurrence from acute cellular rejection in HCV liver recipients. Mol Med. 2011;17:824–833. doi: 10.2119/molmed.2011.00072. [DOI] [PMC free article] [PubMed] [Google Scholar]
- 24.Chaudhury A, Hussey GS, Ray PS, Jin G, Fox PL, Howe PH. TGF-beta-mediated phosphorylation of hnRNP E1 induces EMT via transcript-selective translational induction of Dab2 and ILEI. Nat Cell Biol. 2010;12:286–293. doi: 10.1038/ncb2029. [DOI] [PMC free article] [PubMed] [Google Scholar]
- 25.Hernandez-Gea V, Friedman SL. Pathogenesis of liver fibrosis. Annu Rev Pathol. 2011;6:425–456. doi: 10.1146/annurev-pathol-011110-130246. [DOI] [PubMed] [Google Scholar]
- 26.Thomson S, Petti F, Sujka-Kwok I, Mercado P, Bean J, Monaghan M, Seymour SL, et al. A systems view of epithelial-mesenchymal transition signaling states. Clin Exp Metastasis. 2011;28:137–155. doi: 10.1007/s10585-010-9367-3. [DOI] [PMC free article] [PubMed] [Google Scholar]
- 27.Auge N, Nikolova-Karakashian M, Carpentier S, Parthasarathy S, Negre-Salvayre A, Salvayre R, Merrill AH, Jr, et al. Role of sphingosine 1-phosphate in the mitogenesis induced by oxidized low density lipoprotein in smooth muscle cells via activation of sphingomyelinase, ceramidase, and sphingosine kinase. J Biol Chem. 1999;274:21533–21538. doi: 10.1074/jbc.274.31.21533. [DOI] [PubMed] [Google Scholar]
- 28.Boers W, Aarrass S, Linthorst C, Pinzani M, Elferink RO, Bosma P. Transcriptional profiling reveals novel markers of liver fibrogenesis: gremlin and insulin-like growth factor-binding proteins. J Biol Chem. 2006;281:16289–16295. doi: 10.1074/jbc.M600711200. [DOI] [PubMed] [Google Scholar]
- 29.Karolczak-Bayatti M, Loughney AD, Robson SC, Europe-Finner GN. Epigenetic modulation of the protein kinase A RIIalpha (PRKAR2A) gene by histone deacetylases 1 and 2 in human smooth muscle cells. J Cell Mol Med. 2011;15:94–108. doi: 10.1111/j.1582-4934.2009.00927.x. [DOI] [PMC free article] [PubMed] [Google Scholar]
- 30.Liu M, Zhou L, Xu A, Lam KS, Wetzel MD, Xiang R, Zhang J, et al. A disulfide-bond A oxidoreductase-like protein (DsbA-L) regulates adiponectin multimerization. Proc Natl Acad Sci U S A. 2008;105:18302–18307. doi: 10.1073/pnas.0806341105. [DOI] [PMC free article] [PubMed] [Google Scholar]
- 31.Moazed B, Banman SL, Wilkinson GA, Roesler WJ. TCERG1 inhibits C/EBPalpha through a mechanism that does not involve sequestration of C/EBPalpha at pericentromeric heterochromatin. J Cell Biochem. 2011;112:2317–2326. doi: 10.1002/jcb.23154. [DOI] [PubMed] [Google Scholar]
- 32.Molleken C, Sitek B, Henkel C, Poschmann G, Sipos B, Wiese S, Warscheid B, et al. Detection of novel biomarkers of liver cirrhosis by proteomic analysis. Hepatology. 2009;49:1257–1266. doi: 10.1002/hep.22764. [DOI] [PMC free article] [PubMed] [Google Scholar]
- 33.Shu J, Kren BT, Xia Z, Wong PY, Li L, Hanse EA, Min MX, et al. Genomewide microRNA down-regulation as a negative feedback mechanism in the early phases of liver regeneration. Hepatology. 2011;54:609–619. doi: 10.1002/hep.24421. [DOI] [PMC free article] [PubMed] [Google Scholar]
- 34.Spangberg K, Schwartz S. Poly(C)-binding protein interacts with the hepatitis C virus 5′ untranslated region. J Gen Virol. 1999;80(Pt 6):1371–1376. doi: 10.1099/0022-1317-80-6-1371. [DOI] [PubMed] [Google Scholar]
- 35.Soga T, Sugimoto M, Honma M, Mori M, Igarashi K, Kashikura K, Ikeda S, et al. Serum metabolomics reveals gamma-glutamyl dipeptides as biomarkers for discrimination among different forms of liver disease. J Hepatol. 2011;55:896–905. doi: 10.1016/j.jhep.2011.01.031. [DOI] [PubMed] [Google Scholar]
- 36.Robert K, Nehme J, Bourdon E, Pivert G, Friguet B, Delcayre C, Delabar JM, et al. Cystathionine beta synthase deficiency promotes oxidative stress, fibrosis, and steatosis in mice liver. Gastroenterology. 2005;128:1405–1415. doi: 10.1053/j.gastro.2005.02.034. [DOI] [PubMed] [Google Scholar]
- 37.Soga T, Baran R, Suematsu M, Ueno Y, Ikeda S, Sakurakawa T, Kakazu Y, et al. Differential metabolomics reveals ophthalmic acid as an oxidative stress biomarker indicating hepatic glutathione consumption. J Biol Chem. 2006;281:16768–16776. doi: 10.1074/jbc.M601876200. [DOI] [PubMed] [Google Scholar]
- 38.Madill J, Arendt B, Aghdassi E, Chow C, Guindi M, Therapondos G, Lilly L, et al. Oxidative stress and nutritional factors in hepatitis C virus-positive liver recipients, controls, and hepatitis C virus-positive nontransplant patients. Transplant Proc. 2010;42:1744–1749. doi: 10.1016/j.transproceed.2010.03.141. [DOI] [PubMed] [Google Scholar]
- 39.Miura K, Taura K, Kodama Y, Schnabl B, Brenner DA. Hepatitis C virus-induced oxidative stress suppresses hepcidin expression through increased histone deacetylase activity. Hepatology. 2008;48:1420–1429. doi: 10.1002/hep.22486. [DOI] [PubMed] [Google Scholar]
- 40.Niki T, Rombouts K, De Bleser P, De Smet K, Rogiers V, Schuppan D, Yoshida M, et al. A histone deacetylase inhibitor, trichostatin A, suppresses myofibroblastic differentiation of rat hepatic stellate cells in primary culture. Hepatology. 1999;29:858–867. doi: 10.1002/hep.510290328. [DOI] [PubMed] [Google Scholar]
- 41.Britton LM, Gonzales-Cope M, Zee BM, Garcia BA. Breaking the histone code with quantitative mass spectrometry. Expert Rev Proteomics. 2011;8:631–643. doi: 10.1586/epr.11.47. [DOI] [PMC free article] [PubMed] [Google Scholar]
- 42.Washburn ML, Bility MT, Zhang L, Kovalev GI, Buntzman A, Frelinger JA, Barry W, et al. A humanized mouse model to study hepatitis C virus infection, immune response, and liver disease. Gastroenterology. 2011;140:1334–1344. doi: 10.1053/j.gastro.2011.01.001. [DOI] [PMC free article] [PubMed] [Google Scholar]
Associated Data
This section collects any data citations, data availability statements, or supplementary materials included in this article.