Abstract
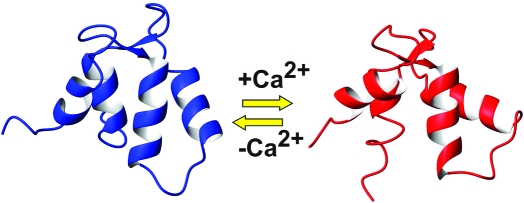
Muscle contraction is activated by two distinct mechanisms. One depends on the calcium influx, and the other is calcium-independent and activated by mechanical stress. A prototypical example of stretch activation is observed in insect muscles. In Lethocerus, a model system ideally suited for studying stretch activation, the two mechanisms seem to be under the control of different isoforms of troponin C (TnC), F1 and F2, which are responsible for stretch and calcium-dependent regulation, respectively. We have previously shown that F1 TnC is a typical collapsed dumbbell EF-hand protein that accommodates one calcium ion in its fourth EF-hand. When calcium loaded, the C-terminal domain of F1 TnC is in an open conformation which allows binding to troponin I. We have determined the solution structure of the isolated F1 TnC C-terminal domain in the absence of calcium and have compared it together with its dynamical properties with those of the calcium-loaded form. The domain is folded also in the absence of calcium and is in a closed conformation. Binding of a single calcium is sufficient to induce a modest but clear closed-to-open conformational transition and releases the conformational entropy observed in the calcium-free form. These results provide the first example of a TnC domain in which the presence of only one calcium ion is sufficient to induce a closed-to-open transition and clarify the role of calcium in stretch activation.
A common feature of many insect species is the ability to contract wing muscles at a high frequency without weakening the power output (1,2). The muscles responsible for this feature are called indirect flight muscles (IFM).1Alongside the canonical calcium-regulated mechanism, IFM can also contract in an asynchronous manner, that is, in such a way that the contraction frequency is uncoupled from the presynaptic motor neuron spikes and therefore from the frequency of pumping calcium in and out of the sarcoplasmatic reticulum. Asynchronous muscle contraction regulation is thought to be achieved mainly through mechanical stretch, even though calcium retains some as yet unclear role (1−7).
In Lethocerus, a giant water bug used as a model system to study asynchronous contraction, a troponin C isoform (F1 TnC) has been shown to regulate stretch activation in IFM (6,8). F1 TnC is part of the troponin complex together with troponin H (the Lethocerus ortholog of TnI) and troponin T (8,9). The structure of calcium-loaded F1 TnC was recently determined: it has a typical EF-hand fold with a calcium silent N-terminal domain, a calcium active C-terminal domain, and a flexible linker connecting the N- and C-terminal domains (10). The C-terminal domain binds only one calcium ion in its fourth EF-hand and is in an open conformation.
The calcium binding ability of the C-terminal domain of F1 TnC is crucial for stretch activation: F1 TnC mutations designed to abolish calcium binding are unable to contract in an asynchronous manner (8). A reasonable way to explain the role of calcium is to hypothesize that, in stretch activated fibres, calcium is needed to induce an open conformation of the F1 C-terminal domain. Such conformational change would allow binding of F1 TnC to TnH. Calcium would therefore play a structural role (i.e., that of anchoring F1 TnC to the actin filament), leaving open the question of how regulation is achieved (8). This hypothesis seemed, however, to be contradicted by the observation that calcium is not needed for the interaction of F1 TnC with TnH and thus for anchoring the troponin complex to the thin filament: the affinities of F1 TnC for TnH peptides are calcium-independent (10).
Here, we have explored the issue further by determining the structure of the calcium-free (apo) C-terminal domain of F1 TnC (F1 CTnC) and studying its dynamics in solution. Previous studies indicated that the domain is mostly independent of the N-terminal one and can therefore be studied in isolation (10). We show that the domain adopts a closed conformation and experiences appreciable conformational exchange. This indicates that binding of a single calcium ion is sufficient to induce a closed-to-open conformational transition in a manner similar to what is observed in other fully calcium-loaded TnCs. Calcium has the effect of rigidifying the structure by reducing the conformational entropy observed in the calcium-free form. Such findings provide a rational background for understanding previous results and clarifying the role of calcium in stretch activation.
Materials and Methods
Protein Expression and Purification
Two sets of primers were designed to clone F1 CTnC (residues M89−E158) using as a PCR template the cDNA sequence of full-length F1 TnC (9−11). The PCR product was gel purified using the Novagen kit, following the protocol suggested by the manufacturer and digested using NcoI and NotI restriction enzymes. The product was cloned into the NcoI and NotI sites of a modified pET24d (M11) expression vector (Novagen) containing an N-terminal hexahistidine (His6) tag followed by a tobacco-etch-virus (TEV) protease cleavage site (12). The expression and purification procedures are as previously described (10).
NMR Data Acquisition and Processing
NMR spectra of F1 CTnC were recorded on 0.4−0.8 mM uniformly 15N-labeled or 15N- and 13C-labeled samples in a 90% H2O/10% D2O mixture, 10 mM Tris-HCl buffer (pH 6.8), and 100 mM NaCl. Spectra were recorded at 25 °C on Varian or Bruker spectrometers operating at 600 or 800 MHz proton frequencies and equipped with 5 mm triple-resonance probes or cryoprobes. Sequence specific assignment was based on standard experiments using the same strategy described for full-length F1 TnC (11).
The spectra were processed and analyzed with NMRPipe/NMRDraw (13) and XEASY (14). The mixing times used for the TOCSY- and NOESY-type experiments were typically 60 and 100 ms, respectively.
Relaxation Data
Heteronuclear Overhauser effects (NOEs) and longitudinal (T1) and transverse (T2) relaxation times were recorded at 25 °C on a Varian Inova spectrometer operating at 600 MHz (15,16). T1 and T2 values were obtained by nonlinear least-squares fitting of the peak intensities to an exponential function. Lipari−Zsabo (17,18) analysis was conducted using Tensor2 (19). An initial estimate of the correlation time was obtained by removing the residues affected by chemical exchange. The estimated value was used to fit every residue to the best model. An isotropic tumbling was assumed both for apo and holo F1 CTnC.
Structure Calculation
The NOESY cross-peaks were manually peak picked and the volumes determined by the maximum integration method in XEASY (14). The frequency tolerance was ±0.03 in the acquisition dimension, ±0.04 in the indirect proton dimension, and ±0.5 in the carbon dimension for 13C-edited NOESY or ±0.05, ±0.05, and ±0.5, respectively, for 15N-edited NOESY. Dihedral angle restraints was obtained from Talos (20).
Structure calculations were conducted with Aria version 1.2 (21), based on a standard simulated annealing CNS protocol (22). A typical run consisted of nine iterations. The initial structure ensemble was generated at iteration 0 choosing an NOE violation tolerance and a partial assignment cutoff probability of 1000 and 1.01, respectively. In the following eight iterations, the NOE violation tolerances were progressively reduced (1000.0, 1.0, 0.5, 0.1, 1.0, 0.1, 0.1, and 0.1 Å), with the exception of iteration 5 in which the violation tolerance was increased to 1 Å to ensure that important NOEs consistent with the structure at that stage were not excluded. The partial assignment cutoff probability was reduced in parallel (0.9999, 0.999, 0.99, 0.98, 0.96, 0.93, 0.90, and 0.80) to eliminate ambiguous NOEs that do not contribute significantly. Twenty structures were calculated at each iteration. Floating assignment of prochiral groups and correction for spin diffusion were applied (23,24). The seven best structures in terms of lowest global energy were selected at each iteration and used in the following iteration for the assignment of additional NOEs. In the eighth iteration, the structures were refined in water (21). The 10 best structures in energetic terms were selected as representative final structures and used for statistical analysis. An average structure was obtained with Weatsheaf (25).
NMR assignment and atomic coordinates were submitted to the relevant databases (as BMRB and PDB entries 15698 and 2K2A, respectively).
CD Spectra
Far-UV CD spectra were recorded on a Jasco J-715 spectropolarimeter. All spectra were recorded at 20 °C (unless otherwise noted) in 25 mM Tris-HCl and 100 mM NaCl at pH 6.8 with added calcium (250 μM) or EDTA (1 mM) where necessary. Thermal denaturation was followed by monitoring the far-UV CD signal at 222 nm while the temperature was increased from 2 to 95 °C at a rate of 1 °C/min. Data fitting was achieved with software written in house (S. Martin, unpublished software).
Results
The Secondary Structure of F1 CTnC Is Not Affected by Calcium
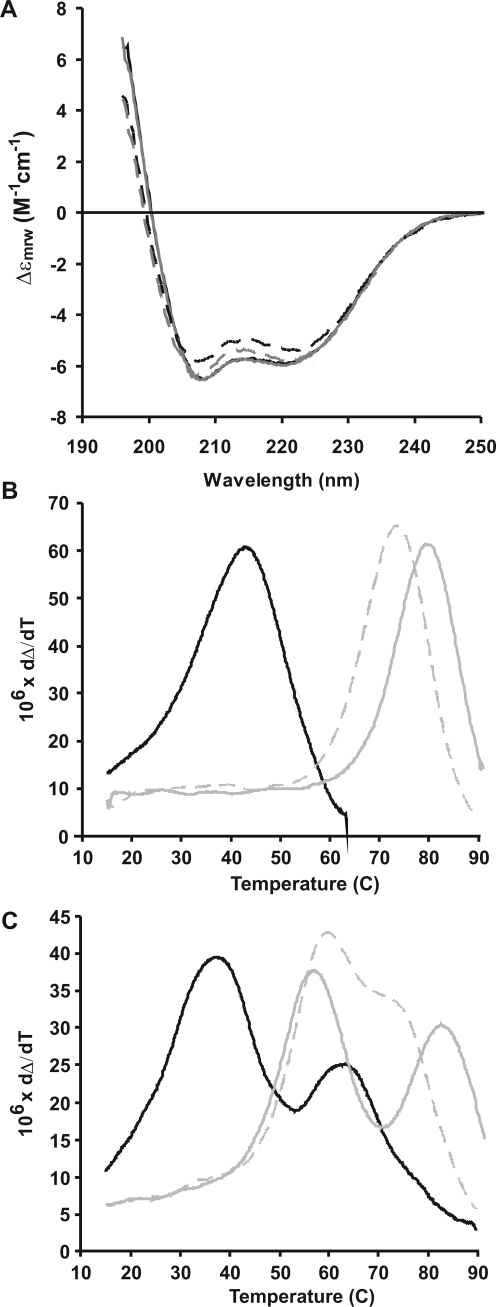
The far-UV CD spectra of the apo and holo forms of F1 CTnC were recorded under similar conditions in terms of buffer, pH, and temperature (Figure 1A). They show the typical behavior observed for helical proteins, with double minima at 208 and 222 nm. The two spectra have similar shapes and intensities, indicating a comparable content of secondary structure. We estimated from data fitting 50% helical, 7% β, 16% turn, and 27% random coil contents for apo F1 CTnC versus 53% helical, 8% β, 13% turn, and 26% random for the holo form.
Figure 1.
CD data. (A) The CD spectra of apo (solid black line) and holo (solid gray line) F1 CTnC. The spectra of apo (solid black line) and holo (solid gray line) full-length F1 TnC are also reported for the sake of comparison. (B) Thermal unfolding monitored by CD of apo (black) and holo (gray) F1 CTnC using two different calcium concentrations (0.5 mM (dashed grey line) and 2.5 mM (continuous grey line) which correspond to 1:20 and 1:100 protein:calcium ratios respectively). The melting temperature shifts as a function of the calcium concentration. (C) Same as panel B but monitored for full-length F1 TnC.
The thermal stabilities of apo and holo F1 CTnC were then tested by temperature scans followed by far-UV CD. The isolated domain undergoes highly cooperative and fully reversible transitions with melting temperatures of 43 and 74 °C for the apo and holo forms, respectively (Figure 1B). These values were compared to those obtained for apo and holo full-length F1 TnC for which we obtained values of 38 and 63 °C (apo) and 60 and 72 °C (holo) (Figure 1C). Since the NTnC is calcium insensitive, it is reasonable to assign the transition around 60 °C to this domain.
Taken together these results indicate that calcium provides an appreciable level of stabilization of the fold and confirm that the two halves of the protein are mostly independent.
NMR Spectral Properties of Apo F1 CTnC
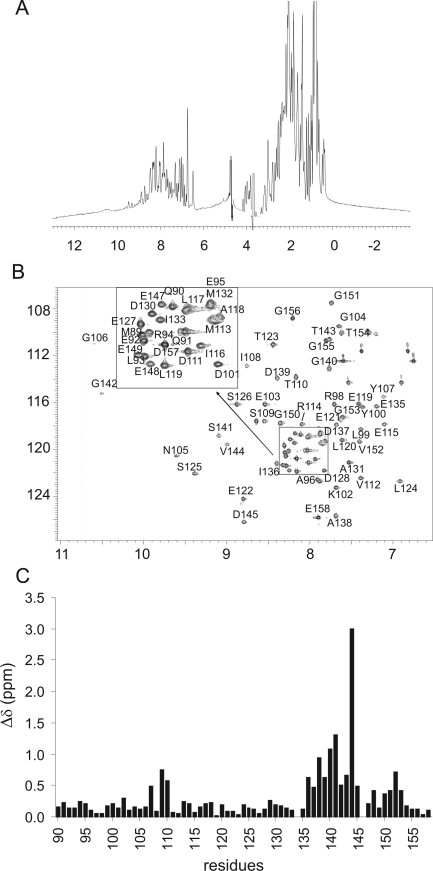
The one-dimensional (1D) and 1H−15N HSQC spectra of apo F1 CTnC have an excellent dispersion, indicating that the domain is folded also in the absence of calcium (Figure 2A). However, the HSQC spectrum recorded at 25 °C and pH 6.8 is less populated than expected. Only 62 of the expected 70 residues are clearly identifiable, with the amides of residues 109, 133, 134, 139, 144, 146, 148, and 152 missing. Different pH and temperature conditions were used in an attempt to improve the quality of the spectrum, but no significant differences were observed. When the spectrum was acquired at 15 °C, some of the residues not visible at higher temperatures (109, 133, 139, 144, 148, and 152) became detectable, suggesting that some peaks are in an intermediate exchange regime in the NMR time scale (Figure 2B). All signals were broader than expected for a protein of this molecular weight.
Figure 2.
NMR analysis of apo F1 CTnC and comparison with the spectrum of the holo form. (A) 1D spectrum and (B) assigned 15N−1H HSQC spectra of apo F1. (C) Averaged chemical shift perturbation {Δ = [(δN/10)2 + (δH)2]1/2} as a function of sequence. The spectra were recorded on an INOVA spectrometer operating at 600 MHz.
As previously noted (10), the chemical shifts of the apo and holo forms show pronounced differences for residues directly involved in calcium binding, that is, in the second EF-hand and in residues of the first EF-hand but in the proximity of the β-sheet (Figure 2C). Among these, Val144 experiences the maximal variation from 9.09 to 9.89 ppm and from 119.56 to 128.8 ppm. This is compatible with its position in the canonical EF-hand loop (position 8) and is highly diagnostic of the presence of Ca2+ binding (26).
These observations are highly suggestive of marked differences in the dynamics of the apo and holo proteins.
Description of the Apo F1 CTnC Structure
The solution structure of apo F1 CTnC was determined by standard high-resolution NMR methods and an automatic iterative procedure that makes use of Aria (21). The final total number of NOEs used in the calculation was significantly lower than for the holo form (18.7 NOEs/residue vs 24.3 NOEs/residue), in agreement with the more dynamic nature of apo F1 CTnT. The final bundle is nevertheless of excellent quality as judged by several independent quality tests (Table 1). The backbone root-mean-square deviation (rmsd) from the average structure [as calculated with Wheatsheaf (25)] is 1.3 Å.
Table 1. Structural Statistics for the Apo F1 C-Lobe.
| final no. of NMR restraints | |
| total distance | 1311 |
| unambiguous/ambiguous | 1046/265 |
| itraresidue | 632 |
| squential | 279 |
| medium-range (from residue i to i + j, j = 2−4) | 149 |
| long-range (from residue i to i + j, j > 4) | 251 |
| deviation from idealized geometry | |
| bond lengths (Å) | 0.001 ± 0.000 |
| bond angles (deg) | 0.258 ± 0.014 |
| improper dihedrals (deg) | 0.135 ± 0.029 |
| no. of restraint violations | |
| distance restraint violation >0.5 Å | 0 |
| dihedral restraint violation >5° | 0 |
| rmsd (Å) from average | |
| backbone atoms in structured regions | 1.33 |
| heavy atoms in structured regions | 1.78 |
| backbone atoms in secondary structure elements | 0.79 |
| heavy atoms in secondary structure elements | 1.28 |
| Whatif quality checka | |
| first-generation packing quality | −1.70 |
| second-generation packing quality | −2.08 |
| Ramachandran plot appearance | −2.70 |
| X1-χ2 rotamer normality | −1.10 |
| backbone conformation | −1.66 |
| Procheck Ramachandran statisticsb | |
| most favored region (%) | 80.8 |
| additionally allowed regions (%) | 15.7 |
| generously allowed regions (%) | 2.6 |
| disallowed regions (%) | 0.8 |
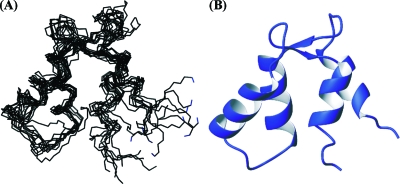
The structure consists of two EF-hand motifs, each of which comprises two α-helices. They span residues 92−100 and 110−120 in EF-hand 3 and residues 129−136 and 147−153 in EF-hand 4 and flank two loops, which, in canonical EF-hands, contain the six ligands responsible for Ca2+ coordination (for an exhaustive review, see ref (27)) (Figure 3A). The loops end with two short β-strands (formed by residues 107 and 108 and residues 143 and 144) which pair up to form the typical short antiparallel β-sheet which holds the two EF-hands side by side.
Figure 3.
Solution structure of apo F1 CTnC. (A) NMR bundle of the 10 best water-refined structures in terms of energy and NOE violations. (B) Average structure as calculated with Weatsheaf (25).
When the structure of apo F1 CTnC was run against the PDB database to detect structurally similar proteins, we found, among the highest hits, sorcin (Z score of 7.4, rmsd of 2.0 over 64 residues), the C-terminal domain of full-length holo F1 TnC (PDB entry 2jnf) (Z score of 7.2, rmsd of 2.9 over 68 residues), calpain (PDB entry 3df0) (Z score of 7.2, rmsd of 2.7 over 66 residues), and centrin (PDB entry 2joj) (Z score of 7.1, rmsd of 3.0 over 70 residues) (28). When the SSM server was used (www.ebi.ac.uk/msb-srb/ssm), we observed four calbindin D9k structures (PDB entries 1n65, 1kqv, 1cdn, and 1ksm) among the most similar hits, superposing with rmsd values of 2.35−2.84 Å. Interestingly, calbindin D9k and calpain represent examples of EF-hand domains that undergo small conformational transitions upon calcium binding (29−32).
Structural Comparison between the Apo and Holo F1 CTnC Three-Dimensional (3D) Structures
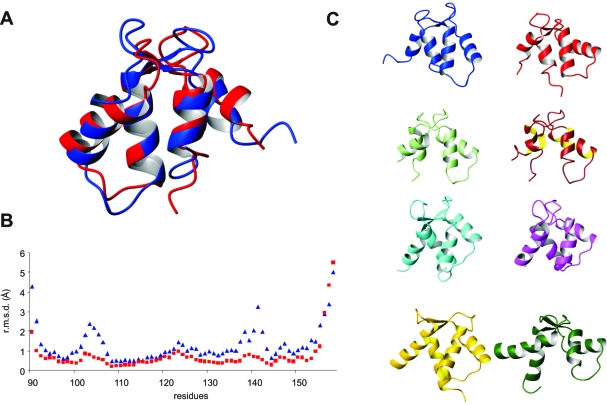
The lowest-energy structures of both bundles superimpose with an rmsd of 2.7 Ǻ on backbone atoms 90−158 (Figure 4A). Comparison of the rmsd values calculated for the apo form of F1 CTnC with that of the equivalent region in the full-length holo protein shows a similar behavior with larger values around the loops (Figure 4B). The maximal values in the holo form are only marginally larger than the average, indicating that the loops are overall well-defined. The variations are much larger in apo F1 CTnC, in agreement with the observation that some residues in these regions cannot be detected at room temperature. There is also no significant difference in the secondary structure elements: ca. 33 residues (i.e., 50%) of both structures are in a helical conformation, in agreement with the CD results.
Figure 4.
Structural comparison. (A) Structural superposition of apo (blue) and holo (red) F1 CTnC using regions of maximal similarity according to DaliLite (http://www.ebi.ac.uk/Tools/dalilite/index.html). (B) Comparison of the rmsd values of the atomic coordinates in the bundles vs the sequence. The blue curve refers to apo F1 CTnC and the red curve to the holo F1 CTnC as obtained from the bundle of full-length F1 TnC coordinates. (C) Structures of different TnCs available both in the apo form and in the holo form. We show from left to right and from top to bottom the following: apo F1 CTnC (PDB entry 2k2a, blue), holo CTnC (PDB entry 2jnf, red), apo skCtnC in a complex with TnI and TnT (PDB entry 1yv0, light green), holo skCtnC in a complex with TnI and TnT (PDB entry 1ytz, brown), apo cNTnC (PDB entry 1spy, cyan), holo cNTnC (PDB entry 1apo, magenta), apo skNTnC (PDB entry 1tnp, gold), and holo skNTnC (PDB entry 1tnq, dark green). The structures were superposed on helices I and II and then displaced for the sake of clarity. The orientation chosen differs by approximately 180° from those in panel A.
Despite these similarities, comparison of the angles between the helical axes with those observed for other TnCs and EF-hand proteins shows conclusively that apo F1 CTnC is in a closed conformation whereas the holo form adopts an open fold (Table 2). Particularly diagnostic are the angles between helices I and II which are around 135° in apo EF-hands and close to 95° in holo forms. Likewise, the angles between helices II and III and helices I and IV that are particularly sensitive to small conformational changes are distinctly different. Interestingly, the III−IV and I−IV angles experience a large variability in apo F1 CTnC, suggesting that the fourth EF-hand is less well-defined in the structure.
Table 2. Interhelical Angles in Representative EF-Handsa.
| protein | PDB entry | method | I−II | II−III | III−IV | I−IV |
|---|---|---|---|---|---|---|
| apo NCaM | 1dmo | NMR | 128 ± 3 | 130 ± 4 | 130 ± 4 | 121 ± 2 |
| apo CCaM | 1dmo | NMR | 137 ± 3 | 144 ± 3 | 132 ± 5 | 144 ± 3 |
| apo skNTnC | 1tnp | NMR | 130 ± 3 | 126 ± 5 | 125 ± 4 | 111 ± 2 |
| apo cNTnC | 1spy | NMR | 139 ± 3 | 115 ± 4 | 125 ± 5 | 117 ± 3 |
| apo cNTnC | 1a2x | X-ray | 138 | 119 | 136 | 121 |
| holo cNTnCb | 1ap4 | NMR | 136 ± 4 | 97 ± 4 | 119 ± 4 | 115 ± 2 |
| apo F1 NTnC | 2jnf | NMR | 133 ± 3 | 118 ± 2 | 124 ± 2 | 126 ± 3 |
| apo F1 CTnC | 2k2a | NMR | 135 ± 5 | 134 ± 4 | 132 ± 12 | 129 ± 7 |
| holo F1 CTnC | 2jnf | NMR | 103 ± 3 | 119 ± 2 | 127 ± 4 | 97 ± 2 |
| holo NCaM | 4cln | X-ray | 94 | 110 | 96 | 107 |
| holo NCaM | 1cll | X-ray | 87 | 112 | 96 | 99 |
| holo NCaM | 1g4y | X-ray | 96 | 111 | 90 | 115 |
| holo NCaM | 1cdl | X-ray | 88 | 112 | 91 | 104 |
| holo CCaM | 4cln | X-ray | 98 | 114 | 94 | 115 |
| holo CCaM | 1cll | X-ray | 97 | 112 | 95 | 109 |
| apo CCaMc | 1g4y | X-ray | 95 | 137 | 93 | 140 |
| holo CCaM | 1cdl | X-ray | 101 | 112 | 96 | 112 |
| holo cCTnC | 1a2x | X-ray | 99 | 120 | 109 | 112 |
| holo cCTnC | 1j1d | X-ray | 100 | 125 | 118 | 109 |
| holo skNTnC | 1tnq | NMR | 90 ± 3 | 100 ± 6 | 69 ± 5 | 109 ± 3 |
| holo skNTnC | 1ytz | X-ray | 105 | 101 | 94 | 116 |
| apo skCTnCd | 1yv0 | X-ray | 101 | 121 | 112 | 106 |
| holo skCTnC | 1ytz | X-ray | 106 | 123 | 111 | 114 |
| apo CRLCe | 1wdcB | X-ray | 103 | 146 | 104 | 144 |
| apo CELCe | 1wdcC | X-ray | 115 | 130 | 94 | 143 |
| holo CActe | 1h8b | NMR | 96 ± 3 | 150 ± 4 | 93 ± 4 | 147 ± 3 |
The values were calculated using the interhlx program freely available online (http://nmr.uhnres.utoronto.ca/ikura/resources/data+sw/interhlx/). Entries for apo and holo F1 CTnC are indicated in bold. Apo and holo indications refer to whether calcium is present in the specific domain mentioned (N or C according to whether it is the N- or C-terminal domain, respectively). RLC and ELC stand for myosin regulatory and essential light chains, respectively. Act stands for α-actinin. The standard deviations over the bundle are indicated for NMR structures.
This domain undergoes a conformational change only upon peptide binding (35).
This is a complex of CaM with a helical hairpin that is an unusually bulky target (43).
Relatively little variability is observed between the apo and holo forms of skTnC in a complex with TnI and TnT (34).
Visual comparison of apo and holo CTnC structures from Lethocerus and from other species gives us some idea about the degree of structural variability allowed in the family (Figure 4C). While clearly different from the apo form, holo F1 CTnC experiences a more modest conformational change as compared, for instance, to the isolated NTnC from skeletal muscle (skNTnC) (33). The structure of skCTnC in a complex with TnI and TnT remains in an open conformation also in the apo form (34). The N-terminal domain of TnC from cardiac muscle (cNTnC), which contains a single active EF-hand in site II, remains closed in the holo form and opens only upon target binding (35,36).
Dynamics of Apo and Holo F1 CTnC
Finally, we compared the relaxation parameters of the apo and holo forms of F1 CTnC. 15N NMR relaxation data were analyzed for 57 of 70 total residues for the apo form and 63 of 70 for the holo form. Partial resonance overlap was observed for residues 89, 91, and 92. For the apo form, the backbone resonances of residues 134 and 146 were not observed because of rapid exchange with water. We also could not obtain the relaxation parameters for residues 90, 106, 109, 139, 142, 146, 148, and 152 because of poor fitting of the experimental data to a single exponential.
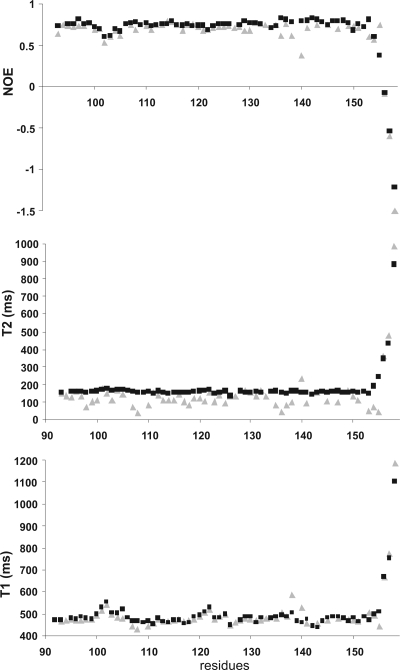
The values observed for holo F1 CTnC (Figure 5) are very similar to those described for the corresponding region of full-length holo F1 TnC (10). NOEs and the longitudinal (T1) relaxation times of holo and apo F1 CTnC are also similar, indicating similar high-frequency local motions. For instance, the average T1 in the apo form calculated from residues with NOEs of >0.6 (i.e., residues whose relaxation is not significantly affected by internal motions) is 475.7 ± 24.0 ms; the equivalent value for the holo form is 479.8 ± 20 ms. Small deviations are observed in the loop regions, in agreement with the rmsd data (Figures 4A and 5). Noticeable differences are instead observed for the transverse relaxation times (T2) which are significantly smaller for the apo form, especially for residues in the loop regions. The average T2 values are 115.1 ± 34.9 and 155.3 ± 7.25 ms for the apo and holo forms, respectively.
Figure 5.
Comparison of the relaxation parameters for apo (gray) and holo (black) F1 CTnC. T1, T2, and NOEs are shown from bottom to top. The spectra were recorded at 600 MHz and 25 °C.
Using the Tensor2 software, we estimated a τc of 4.50 ± 0.05 ns for holo CtnC (19). All residues could be included in the calculations, and the isotropic model was considered valid for describing the tumbling of the molecule. No residues of the holo form required a significant chemical exchange contribution for the data fitting.
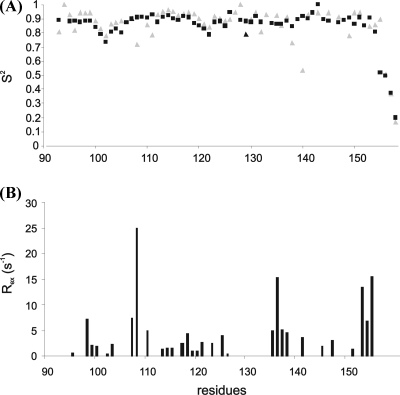
In apo F1 CTnC, we calculated a τc of 4.44 ± 0.05 ns when including only residues that do not undergo chemical exchange (i.e., 96, 101, 104, 111, 116, 128−130, 132, 143, and 149). With this assumption, the isotropic model is considered appropriate. When all residues were considered, including those with anomalously short T2 values, τc increases to 5.26 ± 0.05 ns but the isotropic model is no longer considered appropriate. Since the apo structure is, at least as a first approximation, globular, the isotropic model can be accepted to describe the tumbling of the molecule. Accordingly, the order parameters obtained assuming the Lipari−Szabo model-free approach (17,18) confirm that the I−II and III−IV loops, i.e., residues 101−107 and 137−143 respectively, are less rigid in the apo form (Figure 6). A significant contribution of the chemical exchange had to be included for the majority of the residues to fit the data of the apo protein.
Figure 6.
Dynamics of F1 CTnC as estimated from the relaxation parameters recorded at 600 MHz and 25 °C and analyzed according to the Lipari−Szabo model-free analysis (18,19). (A) Comparison of the S2 parameters in apo (gray) and holo (black) CTnC. Errors in S2 have an average value of 0.01 and are not shown for the sake of clarity. (B) Exchange contributions along the sequence.
Taken together, these data indicate that calcium does not affect the local low-frequency motions of F1 CTnC but has a strong effect in damping large-scale motions in the micro- to millisecond range due to conformational exchange.
Discussion
We have characterized the solution structure of isolated Lethocerus apo CTnC. It is interesting to notice that there are several examples of NTnC determined in the absence of calcium. In contrast, ours is the second structure of a CTnC determined both in the apo form and in the holo form, after that of vertebrate skTnC determined in a complex with TnI and TnT (34). The reason for such an apparent lack of interest toward this region is probably related to the fact that, in muscles, CTnC is thought to be permanently Ca2+- or Mg2+-loaded and attached to TnI, whereas the regulatory N-terminal domain responds to calcium efflux. There are, however, several reasons that make our results for apo F1 CTnC novel and interesting. In all dumbbell-shaped EF-hand proteins, such as TnC and calmodulin, the N- and C-domains seem to have a precise hierarchy: despite the pseudosymmetry, the C-terminus is always involved in substrate recognition either by itself or cooperatively with the N-terminus (A. Pastore, unpublished observations). On the other hand, there are no examples in which the substrate is bound only to the N-terminal domain, in agreement with its regulatory role. Studies of the mechanisms of recognition may therefore allow us to understand better the thermodynamics of this behavior. The mechanism of a closed-to-open transition is also common to many EF-hand domains and more specifically to TnCs, but with interesting and specific exceptions that are worth identifying and discussed individually. The presence of only one active EF-hand in F1 CTnC could mean that it is not obvious to expect the domain to follow the general model. Finally, it is at this stage unclear whether the same mechanism observed in calcium-regulated muscles holds for stretch activation. Quite the opposite, previous results have indicated that TnI recognition is largely calcium independent, leaving the role of calcium in F1 TnC unclear.
Our studies provide conclusive evidence that F1 CTnC is stably folded also in the absence of calcium. This result should be compared with the corresponding region of skTnC, which is intrinsically disordered in the absence of both calcium and TnI (37). An intrinsically higher stability of the Lethocerus F1 CTnC could reasonably be explained by the presence of a single active calcium binding site which could therefore have weaker effects on stabilizing the structure.
Binding of F1 CTnC to a single calcium atom is sufficient to induce a conformational change. This is at variance with cNTnC, which also binds a single Ca2+ ion but remains in a closed conformation also when calcium is bound (35,36). In cardiac muscles, Ca2+ binding does not, in fact, induce a significant structural change in TnC (38). The presence of both Ca2+ and TnI is necessary to stabilize an open conformation, which leads to exposure of the hydrophobic pocket. Interestingly, F1 CTnC also differs from the X-ray structure of apo skCTnC which is in an open conformation although less ordered (34).
The degree of opening observed in F1 CTnC seems overall less pronounced than in other EF-hands. This agrees with the observation of a structural similarity with calbindin D9K and calpain. These are two members of the EF-hand protein family which show the smallest structural variability upon calcium binding (29−32). This proves once again how variable EF-hand proteins can be, being able to adopt through their structural plasticity “a continuum of conformations according to their binding states and their partners” (39).
Our studies of the dynamics of F1 CTnC revealed very similar high-frequency motions for the apo and holo forms. A main and important difference resides in a significantly larger contribution of conformational exchange in the apo protein, which is typical of low-frequency motions (in the micro- and millisecond time scale). We can therefore assume that the most important role of calcium in F1 TnC is that of reducing the conformational entropy of the domain, allowing the protein to be locked in a specific conformation.
We may at this point wonder why interaction of F1 TnC with TnI peptides is calcium-independent (10). A similar behavior is observed with calmodulin which is able to bind IQ motifs in the absence and presence of calcium with comparable affinities (40). While an exact account of the energetic contributions of such interactions still awaits a detailed explanation, a reasonable explanation for this discrepancy is to hypothesize that the complexes formed by apo and holo F1 TnC are somewhat different. Calcium would thus also have the effect of selecting the specific conformation needed for correctly anchoring the TnI to the system. A direct test of this hypothesis can be expected by determination of the structure of a complex of F1 TnC with TnI in the absence and presence of calcium.
Acknowledgments
We gratefully acknowledge the technical support of the NIMR NMR Centre. We also thank David Trentham (London, U.K.) and Brian Sykes (Alberta) for stimulating discussions.
Footnotes
Abbreviations: 1D, one-dimensional; cNTnC, cardiac NTnC; CD, circular dichroism; CTnC, C-terminal domain of TnC; IFM, indirect flight muscles; NMR, nuclear magnetic resonance; NOE, nuclear Overhauser effect; NTnC, N-terminal domain of TnC; PCR, polymerase chain reaction; skNTnC, skeletal NTnC; T1 and T2, longitudinal and transverse relaxation times, respectively; τc, correlation time; TEV, tobacco-etch-virus; Tn, troponin; TnC, troponin C; TnI, troponin I.
References
- Pringle J. W. (1949) The excitation and contraction of the flight muscle of insects. J. Physiol. 108, 226–232. [DOI] [PMC free article] [PubMed] [Google Scholar]
- Bullard B.; Burkart C.; Labeit S.; Leonard K. (2005) The function of elastic proteins in oscillatory contraction of insect flight muscle. J. Muscle Res. Cell Motil. 26, 466–476. [DOI] [PubMed] [Google Scholar]
- Pringle J. W. (1978) The Croonian Lecture, 1977. Stretch activation of muscle: Function and mechanism. Proc. R. Soc. London, Ser. B 201, 107–130. [DOI] [PubMed] [Google Scholar]
- Peckham M.; Cripps R.; White D.; Bullard B. (1992) Mechanics and protein content of insect flight muscle. J. Exp. Biol. 168, 57–76. [Google Scholar]
- Taylor K. A.; Schmitz H.; Reedy M. C.; Goldman Y. E.; Franzini-Armstrong C.; Sasaki H.; Tregear R. T.; Poole K.; Lucaveche C.; Edwards R. J.; Chen L. F.; Winkler H.; Reedy M. K. (1999) Tomographic 3D reconstruction of quick-frozen, Ca2+-activated contracting insect flight muscle. Cell 99, 421–431. [DOI] [PubMed] [Google Scholar]
- Josephson R. K.; Malamud J. G.; Stokes D. R. (2000) Asynchronous muscle: A primer. J. Exp. Biol. 203(Part 18), 2713–2722. [DOI] [PubMed] [Google Scholar]
- Linari M.; Reedy M. K.; Reedy M. C.; Lombardi V.; Piazzesi G. (2004) Ca-activation and stretch-activation in insect flight muscle. Biophys. J. 87, 1101–1111. [DOI] [PMC free article] [PubMed] [Google Scholar]
- Agianian B.; Krzic U.; Qiu F.; Linke W. A.; Leonard K.; Bullard B. (2004) A troponin switch that regulates muscle contraction by stretch instead of calcium. EMBO J. 23, 772–779. [DOI] [PMC free article] [PubMed] [Google Scholar]
- Qiu F.; Lakey A.; Agianian B.; Hutchings A.; Butcher G. W.; Labeit S.; Leonard K.; Bullard B. (2003) Troponin C in different insect muscle types: Identification of two isoforms in Lethocerus, Drosophila and Anopheles that are specific to asynchronous flight muscle in the adult insect. Biochem. J. 371, 811–821. [DOI] [PMC free article] [PubMed] [Google Scholar]
- De Nicola G.; Burkart C.; Qiu F.; Agianian B.; Labeit S.; Martin S.; Bullard B.; Pastore A. (2007) The structure of Lethocerus troponin C: New insights into the mechanism of stretch activation in muscles. Structure 7, 813–824. [DOI] [PubMed] [Google Scholar]
- De Nicola G.; Biekofsky R.; Kelly G.; Agianian B.; Bullard B.; Pastore A. (2004) Assignment of the 1H, 13C, and 15N resonances of holo isoform 4 of Lethocerus indicus troponin C. J. Biomol. NMR 29, 461–462. [DOI] [PubMed] [Google Scholar]
- Phan J.; Zdanov A.; Evdokimov A. G.; Tropea J. E.; Peters H. P. K.; Kapust R. B.; Li M.; Wlodawer A.; Waugh D. S. (2002) Structural basis for the substrate specificity of tobacco etch virus protease. J. Biol. Chem. 277, 50564–50572. [DOI] [PubMed] [Google Scholar]
- Delaglio F.; Grzesiek S.; Vuister G. W.; Zhu G.; Pfeifer J.; Bax A. (1995) NMRPipe: A multidimensional spectral processing system based on UNIX pipes. J. Biomol. NMR 6, 277–293. [DOI] [PubMed] [Google Scholar]
- Bartels C.; Xia T.; Billeter N.; Güntert P.; Wüthrich K. (1995) The program XEASY for computer-supported NMR spectral analysis of biological macromolecules. J. Biomol. NMR 6, 1–10. [DOI] [PubMed] [Google Scholar]
- Kay L. E.; Torchia D. A.; Bax A. (1989) Backbone dynamics of proteins as studied by N-15 inverse detected heteronuclear NMR-spectroscopy: Application to staphylococcal nuclease. Biochemistry 28, 2387–2391. [DOI] [PubMed] [Google Scholar]
- Boyd J.; Hommel U.; Campbell I. D. (1990) Influence of cross-correlation between dipolar and anisotropic chemical-shift relaxation mechanism upon longitudinal relaxation rates of N-15 in macromolecules. Chem. Phys. Lett. 175, 477–482. [Google Scholar]
- Lipari G.; Szabo A. (1982) Model-free approach to the interpretation of nuclear magnetic resonance relaxation in macromolecules. 1. Theory and range of validity. J. Am. Chem. Soc. 104, 4546–4559. [Google Scholar]
- Lipari G.; Szabo A. (1982) Model-free approach to the interpretation of nuclear magnetic resonance relaxation in macromolecules. 2. Analysis of experimental results. J. Am. Chem. Soc. 104, 4559–4570. [Google Scholar]
- Dosset P.; Hus J. C.; Blackledge M.; Marion D. (2000) Efficient analysis of macromolecular rotational diffusion from heteronuclear relaxation data. J. Biomol. NMR 16, 23–28. [DOI] [PubMed] [Google Scholar]
- Cornilescu G.; Delaglio F.; Bax A. (1999) Protein backbone angle restraints from searching a database for chemical shift and sequence homology. J. Biomol. NMR 13, 289–302. [DOI] [PubMed] [Google Scholar]
- Linge J. P.; Habeck M.; Rieping W.; Nilges M. (2003) ARIA: Automated NOE assignment and NMR structure calculation. Bioinformatics 19, 315–316. [DOI] [PubMed] [Google Scholar]
- Brünger A. T.; Adams P. D.; Clore G. M.; DeLano W. L.; Gros P.; Grosse-Kunstleve R. W.; Jiang J. S.; Kuszewski J.; Nilges M.; Pannu N. S.; Read R. J.; Rice L. M.; Simonson T.; Warren G. L. (1998) Cystallography & NMR system: A new software suite for macromolecular structure determination. Acta Crystallogr. D54, 905–921. [DOI] [PubMed] [Google Scholar]
- Folmer R. H.; Hilbers C. W.; Konings R. N.; Nilges M. (1997) Floating stereospecific assignment revisited: Application to an 18 kDa protein and comparison with J-coupling data. J. Biomol. NMR 9, 245–258. [DOI] [PubMed] [Google Scholar]
- Linge J. P.; Habeck M.; Rieping W.; Nilges M. (2004) Correction of spin diffusion during iterative automated NOE assignment. J. Magn. Reson. 167, 334–342. [DOI] [PubMed] [Google Scholar]
- Thomas D.; Pastore A. (2005) WHEATSHEAF: An algorithm to average protein structure ensembles. Acta Crystallogr. D61, 112–116. [DOI] [PubMed] [Google Scholar]
- Biekofsky R. R.; Martin S. R.; Browne J. P.; Bayley P. M.; Feeney J. (1998) Ca2+ coordination to backbone carbonyl oxygen atoms in calmodulin and other EF-hand proteins. 15N chemical shifts as probes for monitoring individual site Ca2+ coordination. Biochemistry 37, 7617–7629. [DOI] [PubMed] [Google Scholar]
- Strynadka N. C.; James M. N. (1989) Crystal structures of the helix−loop−helix calcium-binding proteins. Annu. Rev. Biochem. 58, 951–998. [DOI] [PubMed] [Google Scholar]
- Holm L.; Sander C. (1993) Protein structure comparison by alignment of distance matrices. J. Mol. Biol. 233, 123–138. [DOI] [PubMed] [Google Scholar]
- Skelton N. J.; Kordel J.; Chazin W. J. (1995) Determination of the solution structure of apo calbindin D9k by NMR spectroscopy. J. Mol. Biol. 249, 441–462. [DOI] [PubMed] [Google Scholar]
- Hosfield C. M.; Elce J. S.; Davies P. L.; Jia Z. (1999) Crystal structure of calpain reveals the structural basis for Ca2+-dependent protease activity and a novel mode of enzyme activation. EMBO J. 18, 6880–6889. [DOI] [PMC free article] [PubMed] [Google Scholar]
- Strobl S.; Fernandez-Catalan C.; Braun M.; Huber R.; Masumoto H.; Nakagawa K.; Irie A.; Sorimachi H.; Bourenkow G.; Bartunik H.; Suzuki K.; Bode W. (2000) The crystal structure of calcium-free human μ-calpain suggests an electrostatic switch mechanism for activation by calcium. Proc. Natl. Acad. Sci. U.S.A. 97, 588–592. [DOI] [PMC free article] [PubMed] [Google Scholar]
- Moldoveanu T.; Hosfield C. M.; Lim D.; Zia Z.; Davies P. L. (2003) Calpain silencing by a reversible intrinsic mechanism. Nat. Struct. Biol. 10, 371–378. [DOI] [PubMed] [Google Scholar]
- Gagné S. M.; Tsuda S.; Li M. X.; Smillie L. B.; Sykes B. D. (1995) Structures of the troponin C regulatory domains in the apo and calcium-saturated states. Nat. Struct. Biol. 2, 784–789. [DOI] [PubMed] [Google Scholar]
- Vinogradova M. V.; Stone D. B.; Malanina G. G.; Karatzaferi C.; Cooke R.; Mendelson R. A.; Fletterick R. J. (2005) Ca2+-regulated structural changes in troponin. Proc. Natl. Acad. Sci. U.S.A. 102, 5038–5043. [DOI] [PMC free article] [PubMed] [Google Scholar]
- Li M. X.; Spyracopoulos L.; Sykes B. D. (1999) Binding of cardiac troponin-I147−163 induces a structural opening in human cardiac troponin-C. Biochemistry 38, 8289–8298. [DOI] [PubMed] [Google Scholar]
- Dong W. J.; Xing J.; Villain M.; Hellinger M.; Robinson J. M.; Chandra M.; Solaro R. J.; Umeda P. K.; Cheung H. C. (1999) Conformation of the regulatory domain of cardiac muscle troponin C in its complex with cardiac troponin I. J. Biol. Chem. 274, 31382–31390. [DOI] [PubMed] [Google Scholar]
- Mercier P.; Li M. K.; Sykes B. D. (2000) Role of the structural domain of troponin C in muscle regulation: NMR studies of Ca2+ binding and subsequent interactions with regions 1−40 and 96−115 of troponin I. Biochemistry 39, 2902–2911. [DOI] [PubMed] [Google Scholar]
- Sia S. K.; Li M. X.; Spyracopoulos L.; Gagné S. M.; Liu W.; Putkey J. A.; Sykes B. D. (1997) Structure of cardiac muscle troponin C unexpectedly reveals a closed regulatory domain. J. Biol. Chem. 272, 18216–18221. [DOI] [PubMed] [Google Scholar]
- Yap K. L.; Ames J. B.; Swindells M. B.; Ikura M. (1999) Proteins 37, 499–507. [DOI] [PubMed] [Google Scholar]
- Martin S. R.; Bayley P. M. (2002) Diversity of conformational states and changes within the EF-hand protein superfamily. Protein Sci. 11, 2909–2923.12441389 [Google Scholar]
- Vriend G. (1990) WHAT IF: A molecular modelling and drug design program. J. Mol. Graphics 8, 52–56. [DOI] [PubMed] [Google Scholar]
- Laskowski R. A.; Rullman J. A.; MacArthur M. W.; Kaptein R.; Thornton J. M. (1996) AQUA and PROCHECK-NMR: Programs for checking the quality of protein structures solved by NMR. J. Biomol. NMR 8, 477–486. [DOI] [PubMed] [Google Scholar]
- Schumacher M. A.; Rivard A. F.; Bächinger H. P.; Adelman J. P. (2001) Structure of the gating domain of a Ca2+-activated K+ channel complexed with Ca2+/calmodulin. Nature 26, 1120–1124. [DOI] [PubMed] [Google Scholar]
- Atkinson R. A.; Joseph C.; Kelly G.; Muskett F. W.; Frenkiel T. A.; Nietlispach D.; Pastore A. (2001) Ca2+-independent binding of an EF-hand domain to a novel motif in the α-actinin-titin complex. Nat. Struct. Biol. 8, 853–857. [DOI] [PubMed] [Google Scholar]
- Houdusse A.; Cohen C. (1996) Structure of the regulatory domain of scallop myosin at 2 Å resolution: Implications for regulation. Structure 4, 21–32. [DOI] [PubMed] [Google Scholar]


