Abstract
Developing sensors for in vivo chemical monitoring is a daunting challenge. An alternative approach is to couple sampling methods with online analytical techniques; however, such approaches are generally hampered by lower temporal resolution and slow analysis. In this work, microdialysis sampling was coupled with segmented flow electrospray ionization mass spectrometry (ESI-MS) to perform in vivo chemical monitoring. Use of segmented flow to prevent Taylor dispersion of collected zones and rapid analysis with direct ESI-MS allowed 5 s temporal resolution to be achieved. The MS “sensor” was applied to monitoring acetylcholine in the brain of live rats. The detection limit of 5 nM was sufficient to monitor basal acetylcholine as well as dynamic changes elicited by microinjection of neostigmine, an inhibitor of acetycholinesterase that evoked rapid increases in acetycholine, and tetrodotoxin, a blocker of Na+ channels, that lowered the acetylcholine concentration. The versatility of the sensor was demonstrated by simultaneously monitoring metabolites and infused drugs.
Introduction
Chemical monitoring in a complex microenvironment such as the brain of live subjects requires methods that have high selectivity, low detection limits, and rapid temporal responses. Electrochemical and optical sensors have proven effective for some analytes; however, it is often difficult to develop probes with the necessary performance and many analytes are not amenable to these approaches1. Continuous sampling methods, such as microdialysis, coupled to analytical techniques offer an alternative to sensors; but, with a few exceptions2, 3, the relatively slow rate of analysis is a hindrance to achieving comparable temporal resolution to sensors. Mass spectrometry (MS) coupled with continuous ionization methods is an attractive choice for chemical sensing because it allows high-speed analysis with the selectivity and resolving power needed for complex mixtures. The concept of MS-based sensing has been well-documented for volatile organic monitoring4. Ambient ionization methods have potential for monitoring condensed phase environments that are accessible to the ionization source5. For less accessible environments, such as in vivo, it is necessary to couple the mass spectrometer to a sampling probe. In one example, microdialysis was coupled with fast atom bombardment MS to monitor penicillin G in the bloodstream of a live rat; however, the sample was collected in an injection valve before transferring to the ionization source so that temporal resolution was limited by the time required to collect sufficient sample, which was 20 min6. Microdialysis sampling has also been coupled online with liquid chromatography (LC)-MS7; but, sample collection and LC separation slow the overall process.
In this report we couple microdialysis sampling directly with electrospray ionization (ESI)-MS to monitor neurotransmitter, metabolite, and drug in the brain of live rats at 5 s temporal resolution. Dilution of the sample stream reduces ionization suppression and fast scanning by MS allows rapid, online assay. Segmenting the sample stream into nanoliter droplets is used to prevent temporal distortion due to Taylor dispersion as concentration pulses collected by the probe are transported to the MS8. Segmented flow also facilitates offline analysis by providing a convenient way of storing nanoliter samples for later analysis9. Several methods for coupling segmented flow to ESI-MS have been reported10-14. Here we use a direct interface that prevents dilution of sample and is simple to implement.
The MS “sensor” is applied to monitoring acetylcholine, a neurotransmitter involved in a myriad of functions including cognition15, memory16, addiction17,and movement18. Dysregulation of acetylcholine is associated with neurological disorders such as schizophrenia, Parkinson's disease and Alzheimer's disease19, 20. Measurement of acetylcholine in the brain of live animals is of great value for better understanding the role of cholinergic neurotransmission in normal and pathological states. Enzyme modified electrochemical sensors for acetylcholine have been reported with temporal resolution better than 10 s21, 22; however, high background from choline, a metabolite of acetylcholine that is rapidly generated by acetylcholinesterase in the extracellular space, compromises this technique so that basal concentrations cannot be detected22. Alternatively, choline can be monitored by electrochemistry as a surrogate for acetylcholine23. Acetylcholine is frequently monitored in vivo using microdialysis sampling and offline analysis by HPLC with electrochemical or MS detection. These methods are highly sensitive and capable of detecting basal acetylcholine levels in vivo24-29; however, the LC methods are slow and consume microliter samples making them incompatible with high temporal resolution. Recently, matrix assisted laser desorption ionization (MALDI)-MS was used to detect acetylcholine and choline in dialysate samples; however, this method is only compatible with offline analysis and 60 s temporal resolution30. We find that microdialysis coupled with segmented flow ESI-MS provides a convenient way to monitor acetylcholine at high temporal resolution. Further, the method allows simultaneous monitoring of drugs or metabolites illustrating the versatility of microdialysis with segmented flow ESI-MS for in vivo sensing.
Experimental Section
Chemicals and reagents
All chemicals were purchased from Sigma-Aldrich (St. Louis, MO) unless otherwise specified. HPLC grade water and methanol were from Burdick & Jackson (Muskegon, MI). d4-acetylcholine was purchased from C/D/N isotopes (Pointe-Claire, Canada ). Artificial cerebrospinal fluid (aCSF) solution contained 145 mM NaCl, 2.68 mM KCl, 1.0 mM MgSO4·7H2O, 1.22 mM CaCl2, 1.55 mM Na2HPO4, 0.45 mM NaH2PO4·H2O adjusted to pH 7.4 (salts purchased from Fisher Scientific, Pittsburgh, PA). Tetrodotoxin (TTX) was purchased from Tocris (Minneapolis, MN).
Segmented flow microdialysis
Dialysis probes with side-by-side design were made as previously described31. Briefly, two 40 μm ID × 100 μm OD fused silica capillary (Polymicro Technologies, Phoenix, AZ) were glued together with a 2 mm offset at the tip. The capillary tips were ensheathed in an 18 kDa molecular weight cutoff dialysis fiber made from regenerated cellulose (Spectrum Laboratories, Rancho Dominguez, CA). The tip of the fiber was sealed with polyimide sealing resin (Grace, Deerfield, IL).
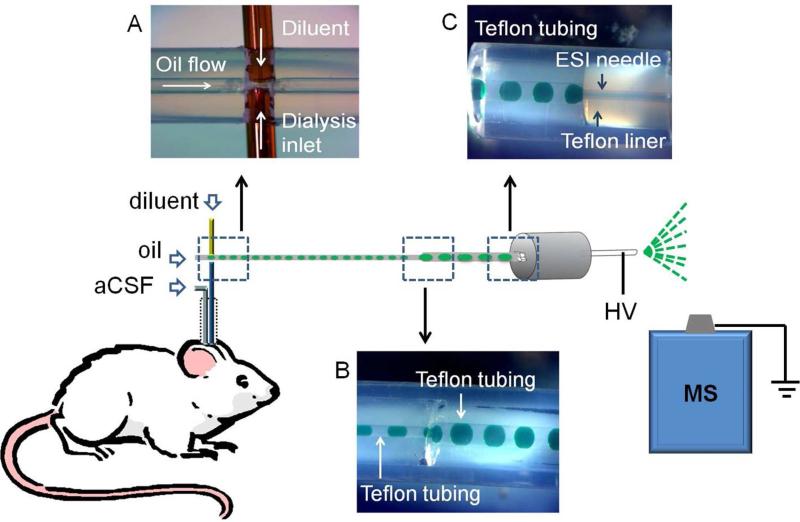
The outlet of the microdialysis probe was coupled to a fluidic cross for generating segmented flow (Figure 1A). The cross was made by inserting a 40 μm ID × 360 μm OD fused silica capillary (Polymicro Technologies, Phoenix, AZ) and the microdialysis probe outlet through the walls of a 55 cm length of 250 μm ID × 1/16” OD perfluoroalkoxyalkane (PFA) tubing (IDEX, Oak Harbor, WA) so that they were juxtaposed as shown in Figure 1A. The structure was sealed by epoxy (Quickset™, LOCTITE, Westlake, OH). Dialysate exiting microdialysis probes at 1 μL/min was mixed with diluent flowing from the juxtaposed capillary at 1 μL/min. The combined streams were segmented into droplets by perflurodecalin pumped at 2 μL/min through the PFA tubing as illustrated in Figure 1A. This arrangement generated ~32 nL droplets (1 droplet/s) of equal parts diluent and dialysate segmented by perfluorodecalin. Diluent consisted of 50:50 water: methanol (v/v) containing 3 mM EDTA disodium salt and 400 nM d4-acetylcholine.
Figure 1.
Illustration of fluidic design for coupling microdialysis to segmented flow ESI-MS. (A) Droplet generation device before it was sealed with epoxy; (B) Droplet coalescence connection.; (C) Liquid connection at ESI probe. Droplets contained green food dye to facilitate visualization. HV stands for high voltage.
To facilitate online MS analysis, dialysate droplets were coalesced into bigger droplets (~ 160 nL corresponding to a 5 s fraction) by pumping them from the 250 μm ID tube into a 5 cm length of 500 μm ID × 1/16” OD PFA tubing (see Figure 1B). The coalescence junction was made by sliding a piece of fluorinated ethylene propylene (FEP) tubing (IDEX, Oak Harbor, WA) over the two pieces of 1/16” OD PFA tubing butted together to form a zero dead volume union (Figure 1B). For online analysis, wherein droplets were transported directly from the probe to the ESI source, the total infusion flow rate was 4 μL/min. For offline analysis, wherein samples were collected and then pumped into the ESI source, the infusion flow rate was 2 μL/min.
Electrospray ionization – mass spectrometry
Droplets were pumped into a 32 gauge ESI needle for MS analysis. PFA tubing containing samples was interfaced to the ESI needle using a polyether ether ketone (PEEK) zero dead volume union (ZU1TFPK, Valco, Houston, TX). For better visualization, the PEEK zero dead volume union was replaced with a transparent Teflon tee in Figure 1C.
In other experiments, the 32 gauge stainless steel ESI needle was replaced with a modified fused silica capillary of the same size (100 μm ID × 238 μm OD) to reduce carryover between droplets. The fused silica needle was coated on the outside with Au/Pd alloy by a sputter coater (SC7620 Mini, Emitech, Kent, TN). The inner surface was derivatized by infusing 100 μL of 1% trichloro(1H,1H,2H,2H-perfluorooctyl)silane in hexadecane followed by flushing with 300 μL of hexane and then He for 3 min.
The ESI source was interfaced to a Micromass/Waters (Milford, MA) Quattro Ultima triple quadrupole mass spectrometer. ESI voltage was 2.5 kV. The nebulizing gas was at 100 psi for an infusion flow rate of 4 μL/min but was decreased to 60 psi for 2 μL/min. The source temperature was maintained at 100 °C. The desolvation temperature was 200 °C. The desolvation gas flow rate was 200 L/h and cone gas flow rate was set at 150 L/h. The MS was operated in multiple reaction monitoring (MRM) mode using conditions listed in Table 1. Conditions for LC-MS acetylcholine analysis were described previously32.
Table 1.
Analyte MRM conditions. Three analytes were monitored together during in vivo experiments: acetylcholine, d4-acetylcholine, and choline or acetylcholine, d4-acetylcholine and neostigmine. Total MS cycle time was ~ 0.2 s.
| analyte | transition | dwell time (ms) | cone voltage | collision energy |
|---|---|---|---|---|
| acetylcholine | 146→87 | 70 | 35 | 15 |
| d4-acetylcholine | 150→91 | 70 | 35 | 15 |
| choline | 104→60 | 70 | 35 | 15 |
| neostigmine | 223→208 | 70 | 35 | 20 |
Temporal resolution and carryover measurement
Carryover of the ESI probe was characterized by infusing discrete droplets containing alternately 0 and 1 μM acetylcholine dissolved in 50:50 aCSF:diluent (v/v). A series of droplets were formed by moving one end of a PFA tubing (500 μm ID × 1/16” OD ) up and down by a computer-controlled x,y,z positioner between aqueous sample layer and oil layer in a glass vial, while the other end of the tubing was connected to syringe pump operating at pull mode (4 μL/min). Then the tubing was moved to another vial containing different concentrations of sample and a train of new droplets was formed in the same fashion. The tip of the PFA tubing was thoroughly rinsed when switching sampled solutions to eliminate carryover at droplet generation step.
Temporal resolution of the online microdialysis segmented flow ESI-MS system was measured by recording step increases in acetylcholine concentration created by quick transfer of dialysis probes between high and low concentration standard. To determine the effect of segmenting flow, a similar experiment was performed but by-passing the segmenting cross. Instead, the dialysate was mixed with diluent via a tee (C360QTPKG6, Valco, Houston, TX) at 1:1 ratio.
Surgery and in vivo experiments
All animal experiments were performed according to protocols approved by the University of Michigan Committee for the Use and Care of Animals. Male Sprague-Dawley rats (Harlan, Indianapolis, IN) were anesthetized with ketamine (65 mg/kg, intraperitoneal (I.P.) injection) and dexdomitor (0.25 mg/kg, I.P.) and placed in a stereotaxic frame (Kopf Instruments, Tujunga, CA). A burr hole was drilled +0.2 mm anterior-posterior and ±3.0 mm laterally from bregma to target the dorsomedial striatum33. The microdialysis probe was lowered so that the active area extended 4.8 mm to 6.8 mm from the top of the skull. One hour after probe insertion, neostigmine (5 μM) or TTX (100 μM) was microinjected. Boosters of ketamine (30 mg/kg, I.P.) and dexdomitor (0.13 mg/kg, I.P.) were given as needed. For microinjection experiments, a 20 μm ID × 90 μm OD capillary was glued so that the outlet was near the middle of the probe active area and 100 μm spaced from the membrane surface. A Picospritzer (General Valve, Fairfield, VA ) was used to infuse 200 nL of drug solution over 4 s from the capillary for each microinjection.
Data analysis
Segmented flow ESI-MS data was recorded by Masslynx 4.1 (Waters, Milford, MA) and exported as txt files for plotting and processing. The C-Unipolar Peak Areas detection function of Igor Pro 6.21 (WaveMetrics, Lake Oswego, OR) was used for peak detection and peak height determination. Peak height ratio to internal standard was used for quantification.
Results and Discussion
Direct ESI-MS analysis of acetylcholine in microdialysate droplets
Initial experiments were performed using flow injection analysis (FIA) to determine if acetylcholine dissolved in aCSF could be detected by direct ESI tandem MS (MS/MS). This study showed that signal for acetylcholine in aCSF was about 20-fold lower than that in water (Supplementary figure 1A and B), presumably due to ionization suppression. Two-fold dilution of dialysate samples with water reduced ionization suppression and increased the signal ~2.5-fold relative to that in aCSF to yield a low nanomolar detection limit (supplementary figure 1 C).
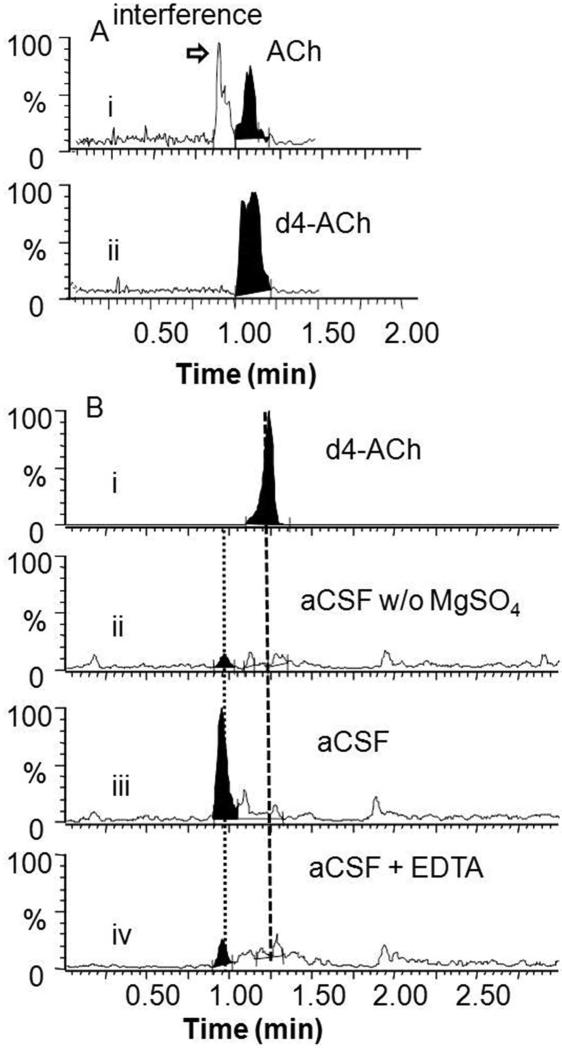
Another potential problem faced by direct ESI-MS/MS determination of acetylcholine in aCSF was interference. Using LC-MS/MS analysis of in vivo dialysate samples, we detected an additional peak besides acetylcholine corresponding to the same MRM transition (146 → 87), as has been previously reported25, 27 (Figure 2A). Because this peak would interfere with direct ESI-MS/MS analysis, we further studied its origin. Removing MgSO4 from aCSF eliminated this peak suggesting that it was due to Mg2+ cluster ions (Figure 2B). Addition of 3 mM EDTA disodium salt to dialysate samples to chelate Mg2+ effectively reduced the interference (Figure 2B) allowing direct detection of acetylcholine by ESI-MS/MS.
Figure 2.
Analysis of interference of acetylcholine measurement using LC-ESI-MS/MS. (A) Analysis of dialysate samples: (i) MRM (146→87) trace for acetylcholine (ACh) showing interference; (ii) MRM (150→91) trace for d4-acetylcholine. (B) Determination of source of acetylcholine interference and its reduction. (i) LC-ESI-MS/MS (150→91) trace of 1 μM d4-acetylcholine in aCSF; (ii) LC-ESI-MS/MS (146→87) trace of aCSF without MgSO4 showing no interfering peak; (iii) LC-ESI-MS/MS (146→87) trace of regular aCSF blank solution showing interference; (iv) LC-ESI-MS/MS (146→87) trace of regular aCSF blank spiked with 3 mM EDTA showing reduction of interfering peak.
Based on these experiments, and the desire to obtain high temporal resolution measurements, we designed the system shown in Figure 1 to interface microdialysis sampling to ESI-MS. The microdialysis stream was segmented into droplets using perfluorodecalin to avoid dispersion of collected samples during transport and storage (for offline measurements) as previously demonstrated9. As the sample stream was segmented, it was diluted with solvent containing EDTA, to chelate Mg2+, and d4-acetylcholine, to provide an internal standard.
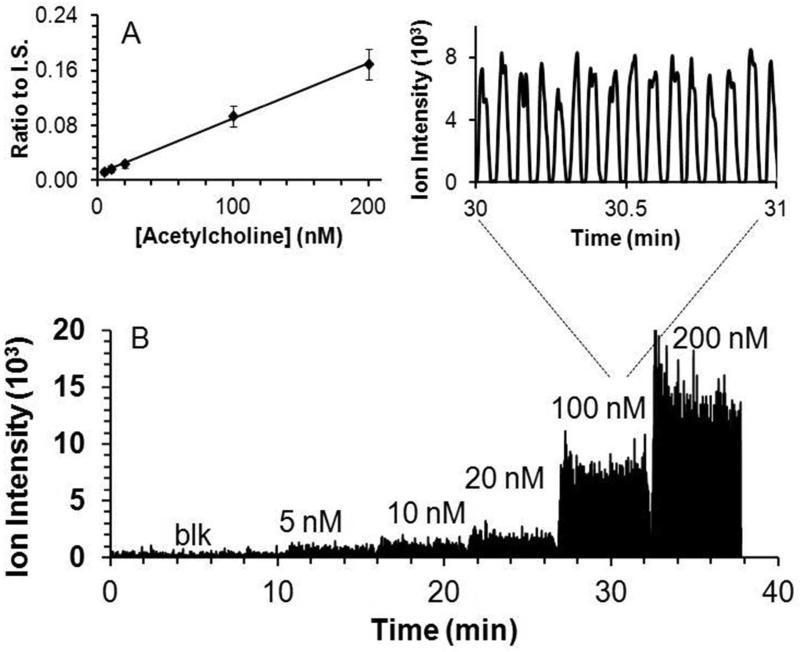
The segmented flow dialysate stream was coupled directly to the ESI source as shown in Figure 1. Figure 3 illustrates that infusion of perfluorodecalin-segmented acetylcholine containing droplets through the ESI source yields distinct current bursts corresponding to each droplet sample. During infusion of samples, perfluorodecalin was removed from the ESI needle by the nebulization gas and produced no signal in the mass spectra. The orthogonal spray geometry was advantageous because oil and non-ionized salt present in the sample were dissipated or deposited on a shield opposing the ESI needle instead of entering the MS inlet. In previous reports of segmented flow ESI-MS, the aqueous droplets were either desegmented prior to ESI-MS11-14 or directly ionized through nanospray under sufficiently low voltage and flow rate10. The ESI format used here proved to be simple (no desegmentation), robust (no clogging for example) and compatible with a wide range of experimental conditions including different flow rates and voltages.
Figure 3.
Quantitative performance of droplet-microdialysis-ESI-MS acetylcholine detection set up. (A) Calibration curve as ratio of signal for acetylcholine to internal standard (I.S.) Standard was prepared in aCSF. (B) Trace of different concentrations of acetylcholine by segmented flow ESI-MS/MS. Inset shows enlarged view of 16 samples at 100 nM. Result was obtained by sampling from different concentration acetylcholine standard solutions using the system shown in Figure 1.
Direct infusion of droplets containing different acetylcholine concentrations revealed a linear increase in MS/MS signal in the concentration range expected for dialysate samples (Figure 3). The limit of detection (LOD) was 5 nM based on the sampled concentration required to achieve signal to noise ratio of 3.
System temporal resolution
Temporal resolution is an important consideration for in vivo measurements. Choline pulses lasting just a few seconds have been detected in vivo by sensors suggesting the need for temporal resolution at that level to capture such dynamics23. To preserve temporal resolution, dialysate was segmented at 1 s intervals; but the 0.5 s duration of these droplets (with 0.5 s for oil) was too short for adequate analysis time during online detection. This was because the MS cycle time was 200 ms (time required for MRM scans for acetylcholine, d4-acetylcholine, and either a metabolite, choline, or drug, neostigmine), allowing only 2 to 3 scans per 0.5 s droplet. To obtain more scans per droplet, we coalesced the 32 nL droplets into 160 nL droplets thus increasing the droplet duration to 2.4 s at a total flow rate of 4 μL/min (2 μL/min of oil, 1 μL/min of dialysate, and 1 μL/min of diluent). Coalescence was reproducible as the RSD of the resulting droplet peak width was 7%; however, it did reduce the best possible temporal resolution. In principle, slower flow rates and narrower ESI needle could be used with droplets that were the original collected size and not coalesced; however, this would increase the overall analysis time and increase the possibility of clogging. As discussed below, the overall temporal resolution was not substantially compromised by this approach.
Once droplets are segmented they should preserve the temporal resolution of the measurement; however, when flowing over hydrophilic surfaces the aqueous samples can wet the surface allowing mixing or carryover between droplets to reduce temporal resolution. The stainless steel needle commonly used for ESI-MS contributed to carryover when segmented samples were pumped through it (Supplementary figure 2A,B). In contrast, a modified fused silica capillary (hydrophobic inner surface) eliminated this carryover (Supplementary figure 2C).
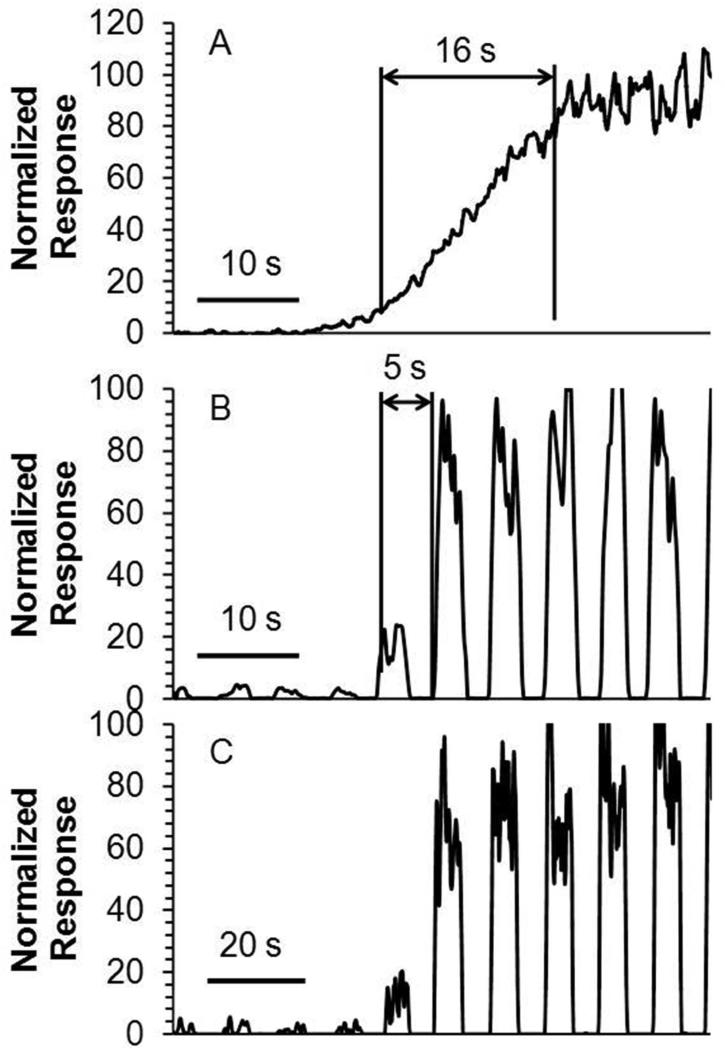
The temporal resolution with continuous flow was 16 s (Figure 4 A). In contrast, the temporal resolution of the segmented flow setup under identical microdialysis conditions and using same length of transfer tubing, was 5 s (Figure 4B), which was defined as tres ≈ φ/f (φ is the number of plugs required to see a change from 10 to 90 %, f is the plug frequency)34. Two factors limit the temporal resolution of the segmented flow ESI-MS system. First is the limited scan speed of the MS. A faster scanning instrument would allow online detection of small droplets without coalescing, a step that sacrificed temporal resolution. Alternatively, this issue can be solved by analyzing the droplets offline at slower flow rate to accommodate the maximal scan rate. As shown in Figure 4B-C, temporal information was unchanged when analyzing droplet samples at lower flow rate offline showing the potential for this approach. The other factor determining system temporal resolution was the swept volume of the microdialysis probe. Dispersion of concentration gradients crossing the membrane while being swept from the probe limits the temporal resolution to a few seconds9. Based on this lower limit for microdialysis, the compromises made to account for the mass spectrometer scan rate were not highly detrimental. It may be possible to achieve sub-second temporal resolution by using alternative sampling methods35.
Figure 4.
Measurement of temporal resolution and comparison. (A) Temporal response to a step change from 500 nM to 5 μM acetylcholine using microdialysis coupled directly to ESI-MS/MS without segmented flow. (B) Temporal response for the same experiment with segmented flow and online analysis. Droplets were analyzed at total flow rate of 4 μL/min. (C) Temporal response for same experiment using segmented flow and offline analysis. Droplets were collected in tubing and analyzed offline at infusion rate of 2 μL/min.
In vivo testing
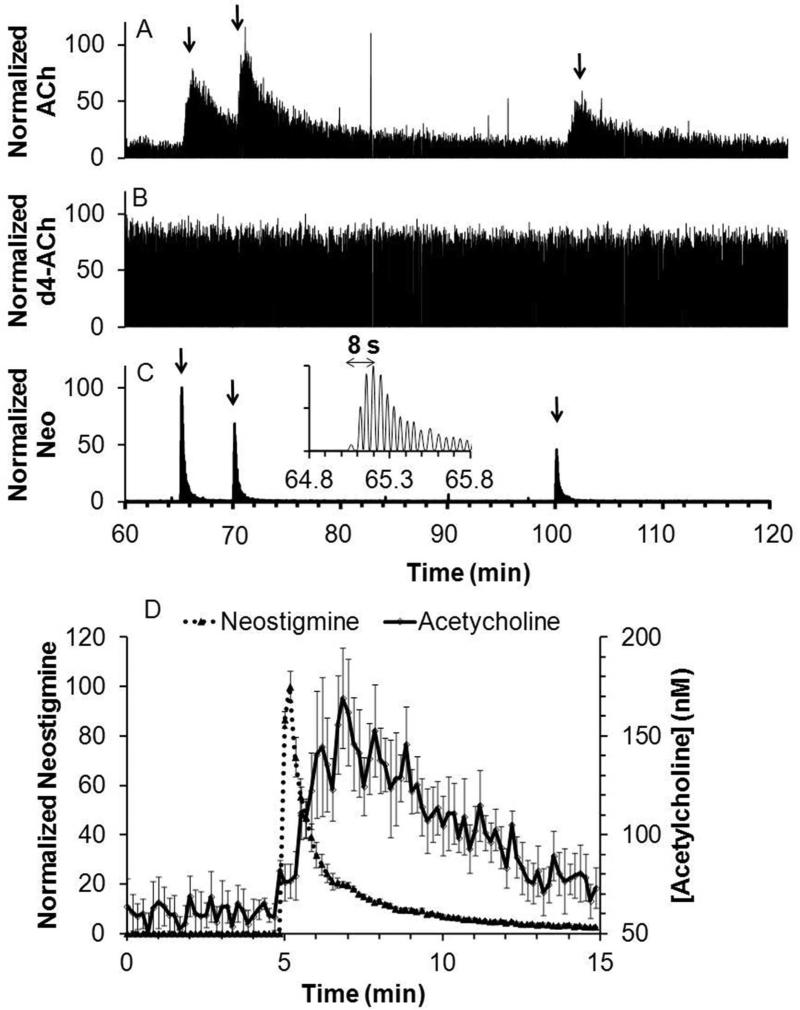
A typical acetylcholine trace from in vivo measurements in an anesthetized rat striatum is shown in Figure 5A. After an initial equilibration period (shown in Supplementary figure 3), a stable signal was achieved that corresponded to an average dialysate concentration of 10 ± 3 nM (SEM, n = 3 rats), in line with reported values22, 29, 36. Considering that in vitro recovery was 20%, this result corresponds to approximately 50 nM in vivo concentration (although in vitro recovery is not always a good approximation of in vivo recovery37).
Figure 5.
Recording of response to in vivo microinjection of neostigmine. Figure showed a sample trace for simultaneous detection of (A) acetylcholine (ACh); (B) internal standard, d4-acetylcholine (d4-ACh); and (C) neostigmine (Neo). Arrow indicates beginning of each microinjection. Insert is a magnified view of the 1st microinjection for neostigmine detection. (D) Averaged acetylcholine response to neostigmine microinjection (dotted line) overlaid with averaged neostigmine signal (solid line), (n = 6, error bar = SEM). Response of 2 to 3 droplets were binned in to one data point at 10 s interval for the averaged plot.
Microinjection of 200 nL of 5 μM neostigmine, an inhibitor of acetylcholinesterase, yielded a robust acetylcholine transient increase up to 280 ± 71 % of baseline (n = 6 injections from 3 rats). The signal for the internal standard d4-acetylcholine (Figure 5B) remained stable during microinjection showing that the changes in acetylcholine were not due to artifacts such as instrument drift or changes in ionization efficiency.
An advantage of MS detection is that it can be used to monitor multiple analytes simultaneously. For example, neostigmine was readily detected allowing a determination of its dynamics during microinjection (Figure 5C). Neostigmine reached a maximum within 10 s of injection illustrating the high temporal resolution possible in vivo. The average response for neostigmine and acetylcholine are overlaid in Figure 5D. The acetylcholine signal is broader than the drug signal possibly reflecting kinetics of inhibition (i.e., we detect the free drug only, so some drug may stay bound to enzyme and continue to inhibit). The broader acetylcholine signal may also reflect the longer distance these molecules had to diffuse through to the probe before detection. Thus, acetylcholine neurons farther from the probe than the microinjector are affected by the neostigmine and the released acetylcholine then diffuses to the probe for detection.
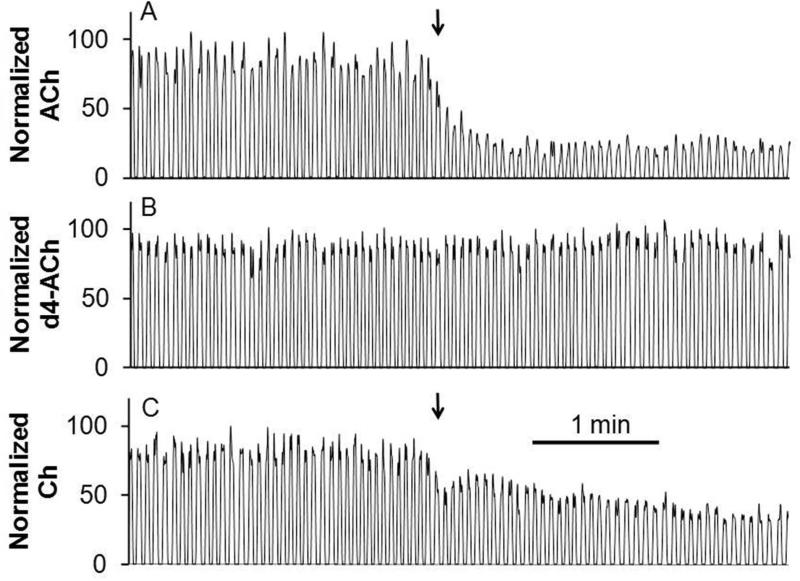
An important test of in vivo measurements of neurotransmitters is sensitivity to TTX. TTX binds to neuronal sodium channels to inhibit action potential propagation; therefore, decreases of neurotransmitter concentration with TTX treatment support the conclusion that the signal observed is due to neuronal firing and presumably neuronal release. Figure 6A shows that acetylcholine decreased when TTX was microinjected, in agreement with reports wherein TTX was perfused through a microdialysis probe into the brain27. The acetylcholine level remained low for at least 20 min after TTX administration likely due to the persistence of TTX associated with its high affinity for the sodium channel. For these experiments 200 nM neostigmine was perfused through the probe to increase dialysate concentration to 50 ± 10 nM (SEM, n = 5). Without this perfusion, it was difficult to detect a decrease in basal acetylcholine concentration which was typically near the LOD.
Figure 6.
Recording of in vivo response to a TTX microinjection. Microinjection conditions were the same as Figure 5. Traces showed simultaneous detection of (A) acetylcholine; (B) internal standard, d4-acetylcholine; and (C) choline (Ch) for one experiment. Arrow indicates beginning of microinjection.
Choline was also monitored in these experiments. As shown in Figure 6C, its signal roughly corresponds to that of acetylcholine, supporting the idea that it could be used as a surrogate for acetylcholine under these conditions. These results again illustrate the versatility of MS “sensing” in that different compounds can be selected for monitoring.
Conclusion
Microdialysis coupled with segmented flow ESI-MS provides a powerful in vivo sensor with good temporal resolution and selectivity. The method should be suitable for a variety of endogenous and exogenous compounds; however, application will be limited to chemicals that can be readily ionized from complex mixtures. The availability of a stable isotope labeled internal standard enhances quantification and helps account for possible matrix effects. Other sampling probes and online sample pretreatment may further extend the applicability of this approach.
Supplementary Material
Acknowledgement
This work was supported by NIH grant R37 EB003320 and a McKnight Foundation Award for Technical Innovations in Neuroscience. The authors thank Professor Brandon Ruotolo at University of Michigan for use of the sputter coater.
References
- 1.Wilson GS, Gifford R. Biosens. Bioelectron. 2005;20:2388–2403. doi: 10.1016/j.bios.2004.12.003. [DOI] [PubMed] [Google Scholar]
- 2.Nandi P, Lunte SM. Anal. Chim. Acta. 2009;651:1–14. doi: 10.1016/j.aca.2009.07.064. [DOI] [PMC free article] [PubMed] [Google Scholar]
- 3.Lada MW, Vickroy TW, Kennedy RT. Anal. Chem. 1997;69:4560–4565. doi: 10.1021/ac970518u. [DOI] [PubMed] [Google Scholar]
- 4.Lindinger W, Hansel A, Jordan A. Int. J. Mass Spectrom. 1998;173:191–241. [Google Scholar]
- 5.Cooks RG, Ouyang Z, Takats Z, Wiseman JM. Science. 2006;311:1566–1570. doi: 10.1126/science.1119426. [DOI] [PubMed] [Google Scholar]
- 6.Caprioli RM, Lin SN. Proc. Natl. Acad. Sci. U. S. A. 1990;87:240–243. doi: 10.1073/pnas.87.1.240. [DOI] [PMC free article] [PubMed] [Google Scholar]
- 7.Wong PSH, Yoshioka K, Xie F, Kissinger PT. Rapid Commun. Mass Spectrom. 1999;13:407–411. doi: 10.1002/(SICI)1097-0231(19990315)13:5<407::AID-RCM500>3.0.CO;2-I. [DOI] [PubMed] [Google Scholar]
- 8.Wang M, Roman GT, Schultz K, Jennings C, Kennedy RT. Anal. Chem. 2008;80:5607–5615. doi: 10.1021/ac800622s. [DOI] [PMC free article] [PubMed] [Google Scholar]
- 9.Wang M, Slaney T, Mabrouk O, Kennedy RT. J. Neurosci. Methods. 2010;190:39–48. doi: 10.1016/j.jneumeth.2010.04.023. [DOI] [PMC free article] [PubMed] [Google Scholar]
- 10.Li Q, Pei J, Song P, Kennedy RT. Anal. Chem. 2010;82:5260–5267. doi: 10.1021/ac100669z. [DOI] [PMC free article] [PubMed] [Google Scholar]
- 11.Fidalgo LM, Whyte G, Ruotolo BT, Benesch JLP, Stengel F, Abell C, Robinson CV, Huck WTS. Angew. Chem. Int. Ed. 2009;48:3665–3668. doi: 10.1002/anie.200806103. [DOI] [PubMed] [Google Scholar]
- 12.Baker CA, Roper MG. Anal. Chem. 2012;84:2955–2960. doi: 10.1021/ac300100b. [DOI] [PMC free article] [PubMed] [Google Scholar]
- 13.Zhu Y, Fang Q. Anal. Chem. 2010;82:8361–8366. doi: 10.1021/ac101902c. [DOI] [PubMed] [Google Scholar]
- 14.Kelly RT, Page JS, Marginean I, Tang K, Smith RD. Angew. Chem. Int. Ed. 2009;48:6832–6835. doi: 10.1002/anie.200902501. [DOI] [PMC free article] [PubMed] [Google Scholar]
- 15.Hasselmo ME, Sarter M. Neuropsychopharmacology. 2010;36:52–73. doi: 10.1038/npp.2010.104. [DOI] [PMC free article] [PubMed] [Google Scholar]
- 16.Van der Zee EA, Luiten PGM. Prog. Neurobiol. 1999;58:409–471. doi: 10.1016/s0301-0082(98)00092-6. [DOI] [PubMed] [Google Scholar]
- 17.Dani JA, Ji DY, Zhou FM. Neuron. 2001;31:349–352. doi: 10.1016/s0896-6273(01)00379-8. [DOI] [PubMed] [Google Scholar]
- 18.Day J, Damsma G, Fibiger HC. Pharmacol. Biochem. Behav. 1991;38:723–729. doi: 10.1016/0091-3057(91)90233-r. [DOI] [PubMed] [Google Scholar]
- 19.White KE, Cummings JL. Compr. Psychiat. 1996;37:188–195. doi: 10.1016/s0010-440x(96)90035-8. [DOI] [PubMed] [Google Scholar]
- 20.Felician O, Sandson TA. J. Neuropsychiatr. Clin. Neurosci. 1999;11:19–31. doi: 10.1176/jnp.11.1.19. [DOI] [PubMed] [Google Scholar]
- 21.Burmeister JJ, Pomerleau F, Huettl P, Gash CR, Wemer CE, Bruno JP, Gerhardt GA. Biosens. Bioelectron. 2008;23:1382–1389. doi: 10.1016/j.bios.2007.12.013. [DOI] [PubMed] [Google Scholar]
- 22.Mitchell KM. Anal. Chem. 2004;76:1098–1106. doi: 10.1021/ac034757v. [DOI] [PubMed] [Google Scholar]
- 23.Parikh V, Kozak R, Martinez V, Sarter M. Neuron. 2007;56:141–154. doi: 10.1016/j.neuron.2007.08.025. [DOI] [PMC free article] [PubMed] [Google Scholar]
- 24.Perry M, Li Q, Kennedy RT. Anal. Chim. Acta. 2009;653:1–22. doi: 10.1016/j.aca.2009.08.038. [DOI] [PMC free article] [PubMed] [Google Scholar]
- 25.Zhu YX, Wong PSH, Cregor M, Gitzen JF, Coury LA, Kissinger PT. Rapid Commun. Mass Spectrom. 2000;14:1695–1700. doi: 10.1002/1097-0231(20000930)14:18<1695::AID-RCM79>3.0.CO;2-5. [DOI] [PubMed] [Google Scholar]
- 26.Hows MEP, Organ AJ, Murray S, Dawson LA, Foxton R, Heidbreder C, Hughes ZA, Lacroix L, Shah AJ. J. Neurosci. Methods. 2002;121:33–39. doi: 10.1016/s0165-0270(02)00228-5. [DOI] [PubMed] [Google Scholar]
- 27.Zhang MY, Hughes ZA, Kerns EH, Lin Q, Beyer CE. J. Pharm. Biomed. Anal. 2007;44:586–593. doi: 10.1016/j.jpba.2007.02.024. [DOI] [PubMed] [Google Scholar]
- 28.Shackman HM, Shou M, Cellar NA, Watson CJ, Kennedy RT. J. Neurosci. Methods. 2007;159:86–92. doi: 10.1016/j.jneumeth.2006.06.020. [DOI] [PubMed] [Google Scholar]
- 29.Huang TH, Yang L, Gitzen J, Kissinger PT, Vreeke M, Heller A. J. Chromatogr. BBiomed. Appl. 1995;670:323–327. doi: 10.1016/0378-4347(95)00181-6. [DOI] [PubMed] [Google Scholar]
- 30.Persike M, Zimmermann M, Klein J, Karas M. Anal. Chem. 2010;82:922–929. doi: 10.1021/ac902130h. [DOI] [PubMed] [Google Scholar]
- 31.Church WH, Justice JB. Anal. Chem. 1987;59:712–716. doi: 10.1021/ac00132a007. [DOI] [PubMed] [Google Scholar]
- 32.Song P, Mabrouk OS, Hershey ND, Kennedy RT. Anal. Chem. 2012;84:412–419. doi: 10.1021/ac202794q. [DOI] [PMC free article] [PubMed] [Google Scholar]
- 33.Paxinos G, Watson C. The rat brain in stereotaxic coordinates. 6 ed. Elsevier; Amsterdam, Netherlands: 2007. [Google Scholar]
- 34.Chen D, Du W, Liu Y, Liu W, Kuznetsov A, Mendez FE, Philipson LH, Ismagilov RF. Proc. Natl. Acad. Sci. U. S. A. 2008;105:16843–16848. doi: 10.1073/pnas.0807916105. [DOI] [PMC free article] [PubMed] [Google Scholar]
- 35.Slaney TR, Nie J, Hershey ND, Thwar PK, Linderman J, Burns MA, Kennedy RT. Anal. Chem. 2011;83:5207–5213. doi: 10.1021/ac2003938. [DOI] [PMC free article] [PubMed] [Google Scholar]
- 36.Uutela P, Reinila R, Piepponen P, Ketola RA, Kostiainen R. Rapid Commun. Mass Spectrom. 2005;19:2950–2956. doi: 10.1002/rcm.2160. [DOI] [PubMed] [Google Scholar]
- 37.Benveniste H, Hansen AJ, Ottosen NS. J. Neurochem. 1989;52:1741–1750. doi: 10.1111/j.1471-4159.1989.tb07252.x. [DOI] [PubMed] [Google Scholar]
Associated Data
This section collects any data citations, data availability statements, or supplementary materials included in this article.


