Abstract
Objectives
To study the effects of reduced lipoic acid gene expression on diabetic atherosclerosis in apolipoprotein E null mice (Apoe−/−).
Methods and Results
Heterozygous lipoic acid synthase gene knockout mice (Lias+/−) crossed with Apoe−/− mice were used to evaluate the diabetic effect induced by streptozotocin on atherosclerosis in the aortic sinus of the heart. While diabetes markedly increased atherosclerotic plaque size in Apoe−/− mice, a small but significant effect of reduced expression of lipoic acid gene was observed in diabetic Lias+/−Apoe−/− mice. In the aortic lesion area, the Lias+/−Apoe−/− mice exhibited significantly increased macrophage accumulation and cellular apoptosis than diabetic Lias+/+Apoe−/− littermates. Plasma glucose, cholesterol, and interleukin-6 were also higher. These abnormalities were accompanied with increased oxidative stress including a decreased ratio of reduced glutathione/oxidized glutathione in erythrocytes, increased systemic lipid peroxidation, and increased Gpx1 and MCP1 gene expression in the aorta.
Conclusions
Decreased endogenous lipoic acid gene expression plays a role in development of diabetic atherosclerosis. These findings extend our understanding of the role of antioxidant in diabetic atherosclerosis.
Keywords: lipoic acid, Lias mouse model, atherosclerosis, diabetes, and apolipoprotein E null mice
1. Introduction
Although type I diabetes is well recognized as a prevalent risk factor for cardiovascular disease and atherosclerosis [1–3], the mechanism by which diabetes accelerates atherosclerosis has not been clarified [4]. Accumulated evidence suggests that increased production of reactive oxygen species (ROS) is a factor in diabetes associated atherosclerosis in murine models [2]. In addition, defective antioxidant defense has been proposed as one of the mechanisms associated with type 1 diabetes [5].
Alpha-lipoic acid (1, 2-dithiolane-3-pentanoic acid; LA), generated by lipoic acid synthase (Lias) in mitochondria, is an antioxidant and a cofactor for several mitochondrial enzymes involved in glucose oxidation and ATP generation [6]. Lias homozygous embryos die in utero, suggesting that LA is essential for energy metabolism in addition to its antioxidant activity [7]. Lias+/− mice with around 50% Lias gene expression showed reduced antioxidant defense against external stress [8]. We previously showed that dietary LA supplementation in Apoe−/− mice decreased atherosclerotic lesion size [9] whereas genetic reduction of Lias gene expression increased lesion size in Lias+/−Apoe−/− mice [10]. In the present study, we expanded the previous studies by examining how a deficient antioxidant defence in Lias+/−Apoe−/− mice contributed to atherosclerosis associated with type 1 diabetes. We aimed at further delineating the role of decreased endogenous antioxidant capacity in the development of diabetic atherosclerosis. Our results show that diabetic Lias+/−Apoe−/− mice with enhanced oxidative stress have increased atherosclerotic plaque size and increased macrophage accumulation and cellular apoptosis in the lesion area.
2. Methods
Animals and experimental design
Apoe−/− mice on 129/SvEv background [11] were mated with Lias+/− mice on the same background [7]. Mice were maintained on normal chow and on a twelve-hour light–dark cycle in microisolator cages. Animal care and experimental protocols were approved by the Institutional Animal Care and Use Committee of the University of North Carolina, Chapel Hill. Two-month-old Lias+/−Apoe−/− (n=15) and Lias+/+Apoe−/− (n=17) male mice were made diabetic by 5 daily intraperitoneal (i.p.) injections of streptozotocin (STZ, Sigma, St. Louis) (40 mg/kg body weight) in 0.05 M sodium citrate buffer, pH 4.5. Control mice (n=10, per genotype) received the citrate buffer alone. Animals with blood glucose levels >300 mg/dL on day 2 after injection were included in this study. Blood glucose was monitored for 4 months. The animals were sacrificed at 6 months of age.
Plasma analysis
After mice were fasted for 5 h, blood was collected from the retro-orbital sinus under anesthesia. Plasma glucose, cholesterol and triglycerides were measured using the commercial kits from Wako (Richmond, VA) according to the manufacturer’s protocols. Plasma IL-6 was measured by ELISA (R&D Systems, Minneapolis, MN). Plasma lipoproteins were fractionated using equal volumes of pooled plasma from each group of animals on a Superose 6 fast protein liquid chromatography (FPLC) column (Amersham Biosciences Biotech, Piscataway, NJ). The content of cholesterol in the eluted fractions was measured with a microplate assay using enzymatic assay reagent kits obtained from Waco (Richmond, VA).
Quantitation of atherosclerotic lesions
Mice were perfused with PBS containing heparin, followed by 4% buffered (pH 7.4) paraformaldehyde under physiological pressure for routine histological analysis and by buffered formalin (pH. 7.4) for immunohistochemical staining. The heart was then removed and embedded in OCT compound. Cryosections (10 μm thick) were stained with Sudan IV and counterstained with hematoxylin. The average lesion area from four anatomically defined positions in sections was taken as the lesion size of each animal. The quantitative morphometric analysis of lesion area using NIH 1.59 Imaging Software was carried out by a histologist blinded to the sample groups. For analysis of lesion composition; fibrous caps and mast cells were stained with Masson’s trichrome and toluidine blue, respectively.
Oxidative stress biomarkers
The oxidative stress status of the whole body was determined by the ratio of GSH to GSSG in erythrocytes using an assay kit (Calbiochem, San Diego, CA). Plasma lipid peroxide content was determined using the thiobarbituric acid reactive substances (TBARS) assay with malondialdehydeas as the standard [9]. 4-hydroxynonenal (4-HNE), a lipid peroxidation marker, was assayed by using an ELISA Kit following the manufacturer’s protocol (Cell Biolabs. Inc. San Diego, CA).
Measurement of apoptosis in aortic plaques
Apoptotic cells were identified by the terminal deoxynucleotidyl transferase dUTP nick end labeling (TUNEL) method using a commercially available kit (Chemicon International Inc. Billerica, MA) according to the manufacturer’s instructions, as previously described [10]. Samples in the absence of the TdT enzyme were used as negative controls. Slides were sealed by cover slips with a DAPI-impregnated mounting medium (Southern Biotech; Birmingham, AL).
Immunohistochemistry
Immunohistochemical analyses were performed on 10 μm frozen sections of aortic root. Macrophages were detected using rat monoclonal anti-mouse MOMA-2 (Abcam, Cambridge, MA) and rat monoclonal anti-mouse Mac-2 (Cedarlane, Burlington, NC) with Cy5 conjugated to anti-rat IgG (Abcam). Sections were counterstained with DAPI. T-cells were detected using rabbit polyclonal anti-human CD3 (Dako Cytomation). Endogenous peroxidase activity was quenched with 3% H2O2/PBS. Secondary antibodies were biotinylated conjugates that were subsequently detected using streptavidin-horseradish peroxidase (HRP). Smooth muscle α-actin was detected using EPOS™ mouse anti-human smooth muscle actin antibody coupled with HRP (DAKO). Bound antibodies were visualized by incubation with 3, 3-diaminobenzidine tetrahydrochloride. Images were viewed under an Olympus BX61 fluorescence microscope.
RT-PCR
Thoracic aortas were dissected from 6-month-old mice. Total RNA was isolated using an ABI 6700 Automated Nucleic Acid Workstation following the manufacturer’s protocol (Applied Biosystems, Foster City, CA). Expression of the genes for copper/zinc superoxide dismutase (Sod1), manganese superoxide dismutase (Sod2), glutathione peroxidase (GPx1), monocyte chemotactic protein-1 (MCP1), Lias, CD36 and smooth muscle α-actin were determined by RT-PCR on an ABI prism 7700 sequence detection system (Applied Biosystems, Foster City, CA). Samples from diabetic and non-diabetic mice were assayed in the same 96-well plates for RT-PCR to compare relative expression levels. To analyze mitochondrial function, liver gene expression of pyruvate dehydrogenase, citrate synthase, cytochrome b and mitochondrial transcription factor A (mtTFA) were measured.
Urine albumin
Individual mice were housed in metabolic cages designed for mouse urine albumin excretion determination. Body weight, food and water intake, and urine volume were monitored in a 24 h period for 2 consecutive days. Urine albumin was measured with a mouse Albuwell ELISA kit (Exocell Inc. Philadelphia, PA).
Statistical analysis
Statistical analysis was carried out using JMP software (SAS, Cary, NC). The effect of diabetes and Lias gene expression and their interactions were analyzed using two-way ANOVA, and the Tukey-Kramer honestly significant difference was used for multiple comparisons. All data are represented as means ± standard error of means (SEM). P<0.05 values were considered to be statistically significant.
3. Results
Atherosclerosis in diabetic Lias+/−Apoe−/− mice
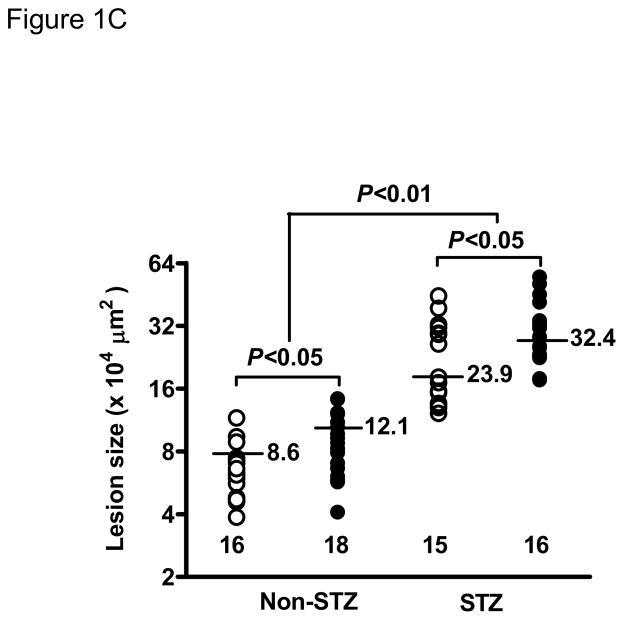
STZ-induced diabetes was associated with markedly increased atherosclerotic lesions compared with non-diabetic mice. Quantitative morphometric analysis showed that lesion size in diabetic Lias+/−Apoe−/− mice (32.4±26 x104μm2, n=16) was larger than that in the diabetic Lias+/+Apoe−/− mice (23.9±23 x104μm2, n=15, p<0.05). Lesion size approximated 2.7 and 2.8-fold in Lias+/−Apoe−/− and Lias+/−Apoe−/− mice, respectively, compared to their respective non-diabetic controls (Figure 1C). Lias heterozygosity also significantly contributed to increased plaque size (Figure 1A, 1B). Two-way ANOVA analysis indicates that diabetes and genotype were independent factors associated with increased lesion size (P<0.001 for effect of diabetes, P<0.05 for effect of genotype, P=0.3 for interaction of two variables).
Figure 1.
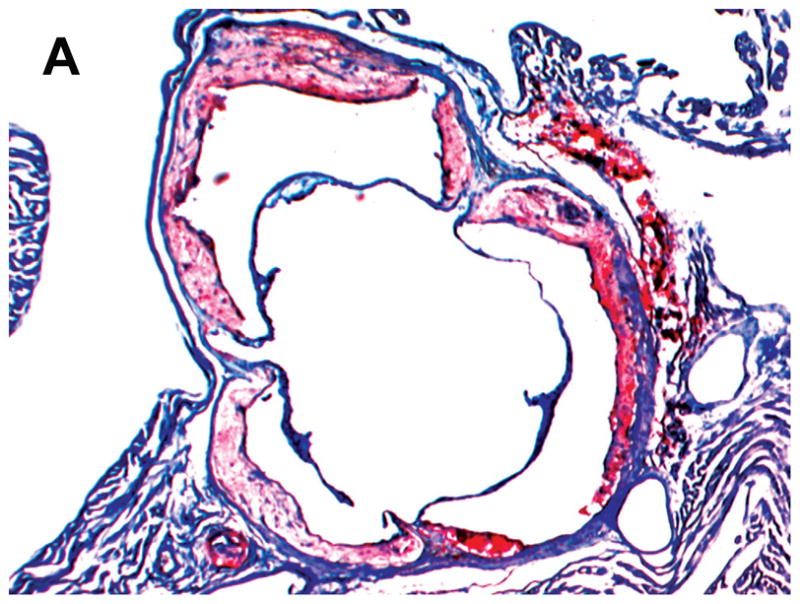
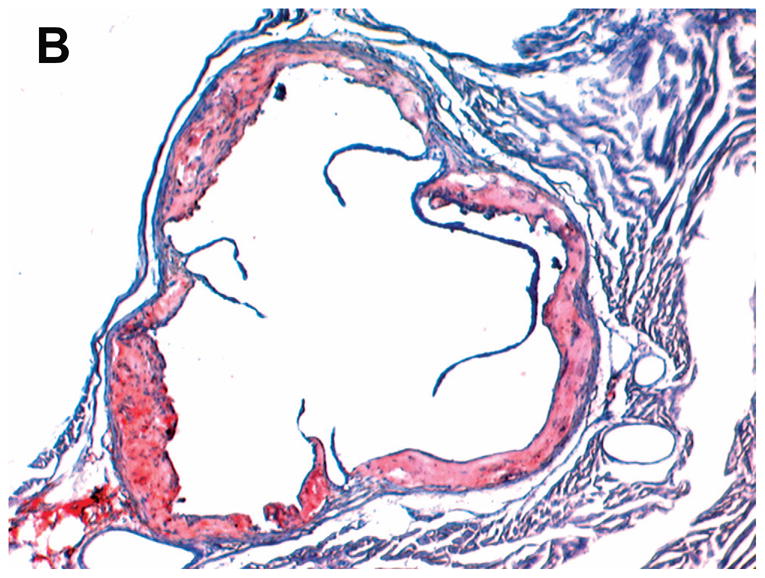
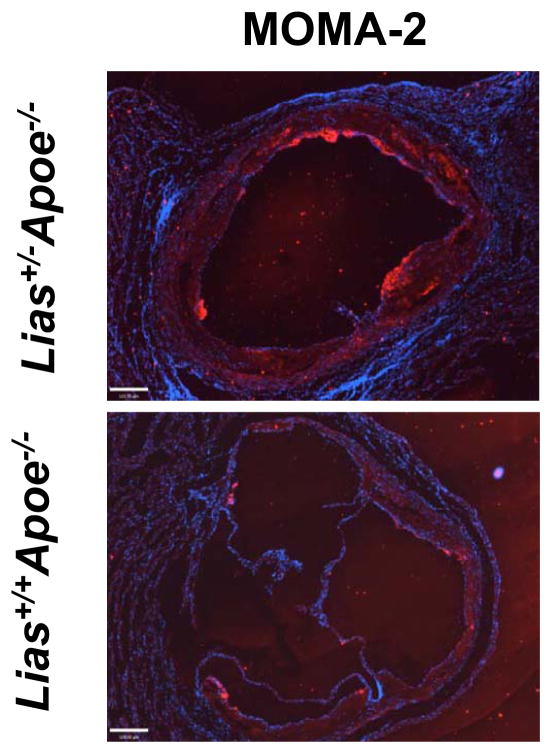
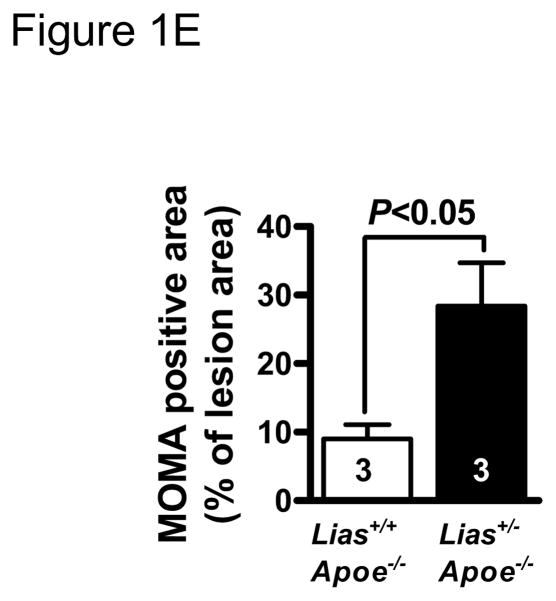
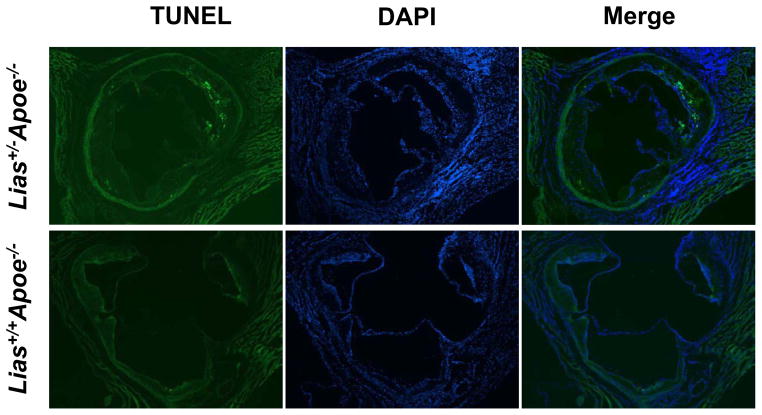
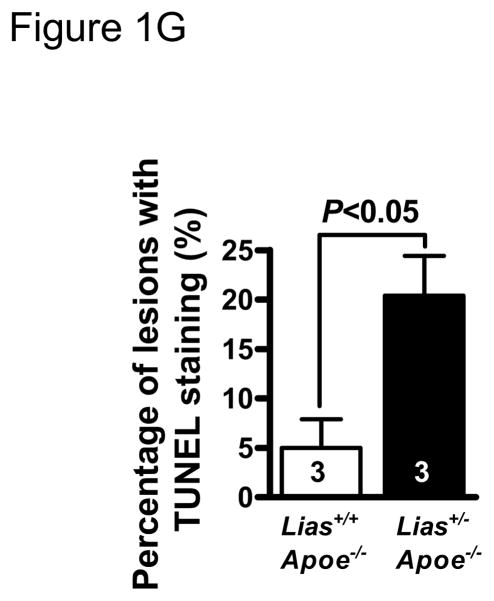
Representative photomicrographs of the aortic sinus plaque in Lias+/−Apoe−/− mice (A) and Lias+/+Apoe−/− mice (B) at 4 months after streptozotocin(STZ)-induced diabetes. Lesions are shown in red, after Sudan IV staining to detect lipids. Magnification X40. (C) Plaque area within the aortic sinus in Lias+/−Apoe−/− mice (black circles) and Lias+/+Apoe−/− mice (open circles) 6 months after streptozotocin induced diabetes. Each dot indicates the average lesion size of 4 sections in each mouse. Horizontal bars with numbers indicate logarithm. The number under the dots indicates animal numbers per group. (D) Macrophage infiltration into atherosclerotic lesions was increased in Lias+/−Apoe−/− mice. Representative photographs of MOMA-2 immunostaining of aortic root sections. Macrophages were stained with MOMA-2 antibody (red). Cell nuclei were stained with DAPI (blue). Two aortic sections were examined per mouse, three mice per group. Scale bar indicates 100 μm. (E) Quantification of MOMA-positive area relative to plaque area. Original magnification x40. (F) Terminal deoxynucleotidyl transferase dUTP nick end labeling (TUNEL) staining in aorta of Lias+/−Apoe−/− and Lias+/+Apoe−/− mice. The TUNEL stain was colocalized with or very close to nuclei stained with DAPI. (G) The percentage of aortic lesions that had TUNEL-positive regions. Scale bar indicates 100 μm. Original magnification x40.
We analyzed lesion composition because of its importance in the development and stability of atherosclerotic lesions. Macrophage accumulation in aortic plaque area was noticeably increased in diabetic Lias+/−Apoe−/− mice compared with diabetic Lias+/+Apoe−/− mice (Figure 1D). Quantitative analysis of fluorescently stained Mac-2 or Moma-2 area relative to total plaque area was significantly more in Lias+/−Apoe−/− mice (28.4±6.3%) than Lias+/+Apoe−/− mice (9.0±2.1%) (P<0.05) (Figure 1E). T-lymphocytes, the major inflammatory cells, also increased in diabetic Lias+/−Apoe−/− plaques (30±12%) compared to Lias+/+Apoe−/− plaques (18±8%) although the difference was not statistically significant P=0.09). Smooth muscle cell staining in the plaques was similar (diabetic; 15±4% for Lias+/−Apoe−/− mice and 13±3% for Lias+/+Apoe−/− mice, P=0.12) (Supplemental Figure 1). The thinnest part of fibrous caps (6.4±0.8 μm in diabetic Lias+/−Apoe−/− mice and 7.9±1.1 μm in diabetic Lias+/+Apoe−/− mice, P=0.23) and was measured following the method by Teruyoshi Kume, et al., 2006 [12] and not significantly different. Degranulated mast cells were only sparsely distributed in both diabetic genotypes (Supplemental Figure 1).
Apoptosis in aortic lesions
More than 90% of TUNEL-positive cells were located within macrophage-rich areas of the intima. Lesions from diabetic Lias+/−Apoe−/− mice (Figure 1F) exhibited a significant increase in intimal TUNEL positive cells relative to lesions from diabetic Lias+/+Apoe−/− mice (Figure 1G).
Metabolic changes
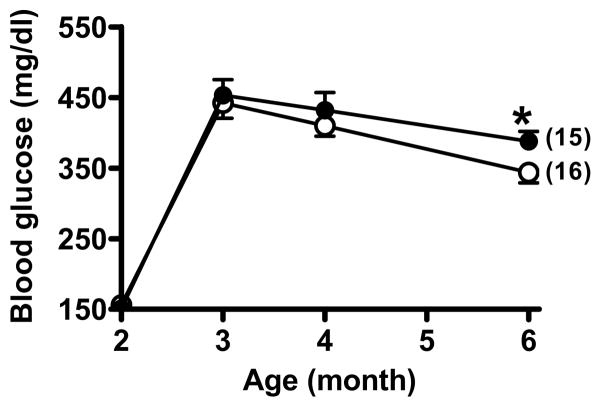
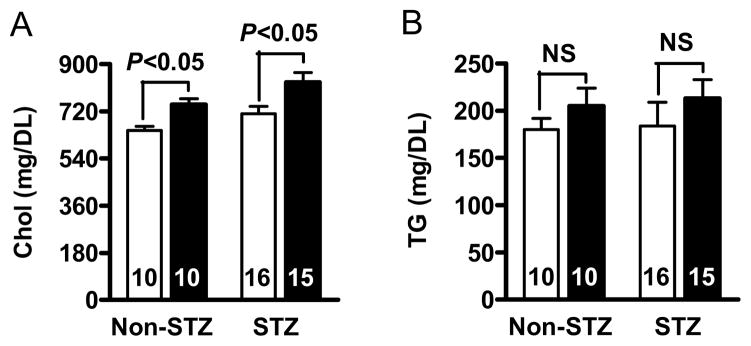
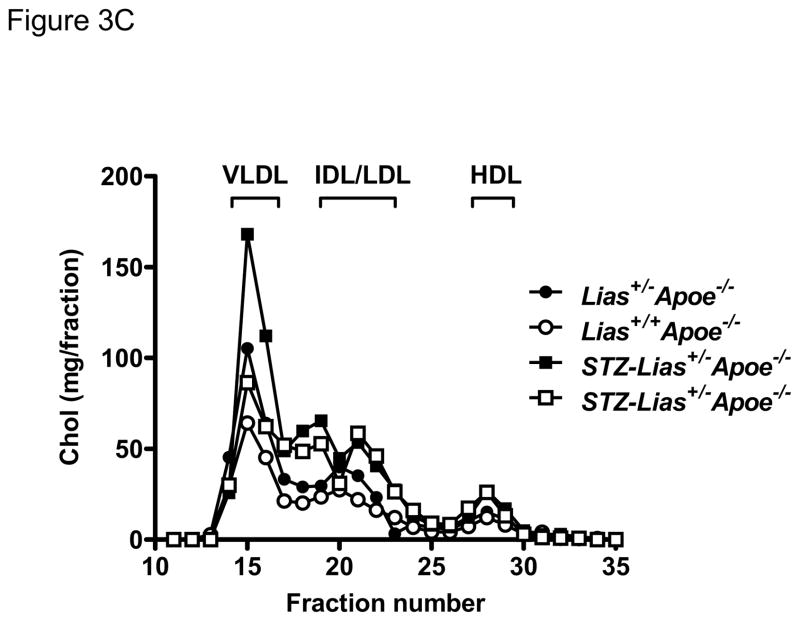
Body weight and food intake markedly increased in diabetic mice but they did not significantly differ between the two Lias genotypes (Table 1). To explore the mechanism by which reduced Lias gene expression enhances atherosclerosis, we measured plasma glucose and cholesterol content. In diabetic mice, the glucose levels of Lias+/−Apoe−/− mice (388±13 mg/dL) were significantly higher than those of Lias+/+Apoe−/− mice (344±15 mg/dL) at 6 months of age (For diabetic effect, P<0.001; for genotype effect, P<0.01; for interaction, P=0.14) (Figure 2). Likewise, the cholesterol levels of Lias+/−Apoe−/− mice (831±30 mg/dL) were significantly higher than those of Lias+/+Apoe−/− mice (712±27 mg/dL), P<0.01 for diabetic effect, P<0.001 for genotype effect, and P=0.83 for interaction (Figure 3A and Table 1). Plasma triglyceride levels sho wed similar trends, but neither diabetic nor genotypic effects were significant (Figure 3B and Table 1). The increase in plasma cholesterol observed in diabetic mice was confined to VLDL, IDL and LDL fractions of FPLC. VLDL and IDL cholesterol fractions increased in diabetic Lias+/−Apoe−/− compared to diabetic Lias+/+Apoe−/− mice (Figure 3C). Although STZ treated animals displayed higher HDL level, they were not significantly different from non-STZ groups.
Table 1.
General features of diabetic Lias+/−Apoe−/− and Lias+/+Apoe−/− mice at 4 months after initiation of diabetes
| Lias+/+ApoE−/− mice | Lias+/−ApoE−/− mice | P (ANOVA) | |||||
|---|---|---|---|---|---|---|---|
| Non-STZ (n=10) | STZ (n=15) | Non-STZ (n=10) | STZ (n=17) | STZ | Genotype | Interaction | |
| Plasma | |||||||
| Glucose (mg/ml) | 116±3 | 344±15 | 123±5 | 388±13 | <0.001 | <0.01 | 0.14 |
| Cholesterol (mg/dl) | 712±27 | 647±15 | 746±23 | 821±30 | <0.01 | <0.001 | 0.83 |
| Triglyceride (mg/dl) | 205±519 | 213±20 | 180±12 | 184±25 | 0.69 | 0.81 | 0.91 |
| TBARS(nmol/ml) | 13.1±1.9 | 24.3±1.7 | 16.1±1.9 | 28.7±1.8 | <0.01 | 0.055 | 0.72 |
| Interleukin-6 (pg/ml) | 64±11 | 255±19 | 97±18 | 361±21 | <0.001 | <0.05 | 0.25 |
| Erythrocytes | |||||||
| GSH/GSSG | 17.5±1.6 | 13.2±0.9 | 13.2±0.6 | 8.3±1.6 | <0.05 | <0.05 | 0.71 |
| Urine | |||||||
| Albumin (μg/d) | 13±1.1 | 60±7.8 | 15±0.6 | 95±9.0 | <0.05 | 0.85 | 0.44 |
| Volume (ml) | 1.8±0.4 | 8.2±0.8 | 1.5±0.3 | 9.1±1.0 | <0.001 | 0.18 | 0.23 |
| Body weight (g) | 30±1.3 | 27.9±0.6 | 32.4±0.5 | 26.8±0.8 | <0.01 | 0.17 | 0.07 |
| Food intake (g) | 4.4±0.3 | 6.3±0.3 | 5.0±0.5 | 7.6±0.3 | <0.01 | 0.26 | 0.35 |
Note: The numbers in parentheses are number of animals.
Figure 2.
Blood glucose changes in Lias+/−Apoe−/− mice (black circles) and Lias+/+Apoe−/− mice (open circles) during the study period. All mice were injected with STZ at 2 months of age. The number of animals in each group is in the parentheses. Data are the mean ± SEM. * indicates P<0.05.
Figure 3.
Plasma cholesterol (A) and triglyceride levels (B) in diabetic Lias+/+Apoe−/− mice (open bars) and diabetic Lias+/−Apoe−/− mice (black bars). Results are expressed as means ± SEM. (C) FPLC of plasma from diabetic and non-diabetic Lias+/−Apoe−/− and Lias+/+Apoe−/− mice. Equal volumes of plasma from the mice at 6 months old were pooled and subjected to gel filtration chromatography. Eluted fractions (0.5 ml) were collected, and cholesterol concentrations were measured as described in methods. VLDL, very-low-density lipoproteins; IDL, intermediate density lipoprotein; LDL, low-density lipoproteins; HDL, high-density lipoproteins.
Oxidative stress
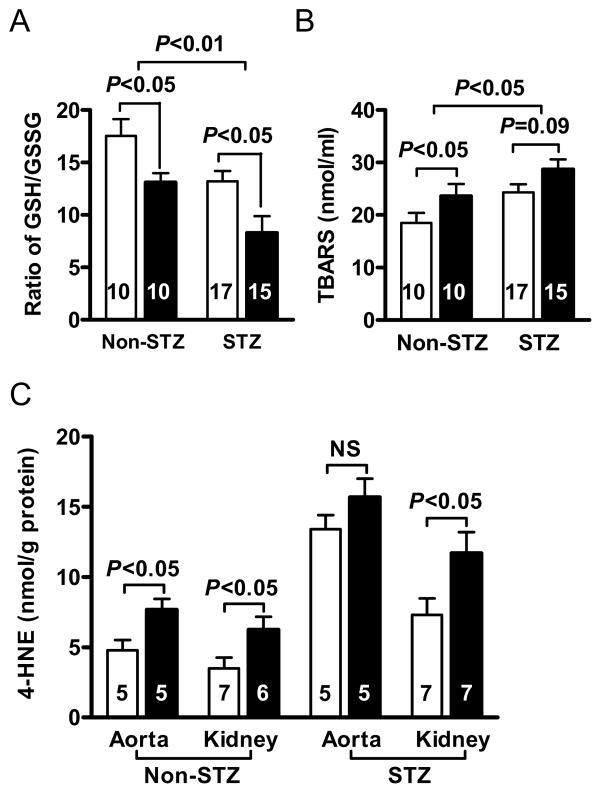
We next examined whether the increased atherosclerotic lesion size is accompanied by a changed redox balance. The ratio of GSH to GSSH in erythrocytes in diabetic Lias+/−Apoe−/− mice was significantly lower than the ratio in diabetic Lias+/+Apoe−/− mice (P<0.05) (Figure 4 and table 1). This suggests that diabetic Lias+/−Apoe−/− mice experienced increased oxidative stress. Two-way ANOVA analysis indicates that diabetes and genotype serve as mutually independent factors to decrease the ratios of GSH to GSSH (P<0.05 for diabetes effect, P<0.05 for genotype effect, and P=0.7 for interaction). Plasma TBARs in non-diabetic mice was significantly higher in Lias+/−Apoe−/− than in Lias+/+Apoe−/− mice. Diabetes increased TBARs levels in both genotypes, but TBARs increased more in diabetic Lias+/+Apoe−/− mice leading to no significant difference between two diabetic groups (P=0.055). In non-diabetic mice, 4-hydroxynonenal (4-HNE) in both aortic and renal tissues showed significantly higher levels in Lias+/−Apoe−/− genotype. 4-HNE levels increased by about 2 fold in the diabetic tissues. However, 4-HNE increased less in Lias+/−Apoe−/− aorta than Lias+/+Apoe−/− aorta, resulting in a non-significant difference between the two genotypes (Figure 4). In contrast, 4-HNE was significantly higher in diabetic Lias+/−Apoe−/− kidney (P<0.05).
Figure 4.
(A) Ratios of reduced/oxidized glutathione (GSH/GSSG) of erythrocytes. (B) Plasma thiobarbituric acid reactive substances (TBARS). (C) 4-hydroxynonenal (4-HNE) in aorta and kidney cortex in Lias+/−Apoe−/− (black bars) and Lias+/+Apoe−/− mice (open bars). The numbers inside bars indicate number of animals. Results are expressed as mean ± SEM.
Aortic and liver gene expression
Lias gene expression was significantly lower in Lias+/− heterozygote (P<0.01) and diabetes decreased further (P<0.01) (Table 2). The effect of the two factor was independent (interaction, P=0.55) but Lias+/−Apoe−/− mice had only 20% of Lias gene expression compared to that in diabetic Lias+/+Apoe−/− mice. Diabetes increased GPx1 gene expression significantly (P<0.001) in both diabetic Lias+/−Apoe−/− and Lias+/+Apoe−/− mice (Table 2A) (diabetic effect, P<0.001 and genotype effect, P<0.05). In contrast, both Sod1 and Sod2 gene expression were lower in Lias+/+Apoe−/− mice than in Lias+/−Apoe−/− mice, and diabetes affected their expressions only slightly. MCP-1 gene expression was higher in Lias+/−Apoe−/− aortas (P<0.05) and diabetes further increased in both genotypes (P<0.05) (Table 2A). CD36 and smooth muscle α-actin gene expression were elevated in diabetic Lias+/−Apoe−/− mice compared to diabetic Lias+/+Apoe−/− mice but they were not statistically different (Table 2A). To examine mitochondrial function, we analyzed expression of mitochondrial enzymes and mtTFA in the livers of diabetic mice. Pyruvate dehydrogenase and citrate synthase gene expression were significantly lower in diabetic Lias+/−Apoe−/− mice than diabetic Lias+/+Apoe−/− mice. Cytochrome b and mtTFA expression showed no significance between the two genotypes (Table 2B).
Table 2A.
Gene expression in aorta
| Gene | Lias+/+Apoe−/− mice | Lias+/−Apoe−/− mice | P (ANOVA) | ||||
|---|---|---|---|---|---|---|---|
|
| |||||||
| Non-STZ | STZ | Non-STZ | STZ | STZ | Genotype | Interaction | |
|
| |||||||
| Gpx1 | 1.00±0.13(10) | 1.38±0.17(11) | 0.79±0.09(10) | 1.86±0.18(12) | <0.001 | <0.05 | 0.28 |
| Sod1 | 1.00±0.16(10) | 0.75±0.06(11) | 0.64±0.09(10) | 0.59±0.06(12) | 0.09 | <0.05 | 0.32 |
| Sod2 | 1.00±0.16(10) | 0.69±0.16(11) | 0.40±0.13(10) | 0.51±0.13(12) | 0.21 | 0.12 | 0.42 |
| MCP1 | 1.00±0.09(10) | 1.24±0.18(11) | 1.30±0.14(10) | 1.74±0.15 (12) | <0.05 | <0.05 | 0.36 |
| Lias | 1.00±0.13(10) | 0.71±0.16(6) | 0.40±0.07(10) | 0.20±0.11 (5) | <0.01 | <0.01 | 0.55 |
| CD36 | NA | 1.00±0.28(6) | NA | 1.55±0.31(5) | NA | NA | NA |
| α-actin | NA | 1.00±0.21(6) | NA | 1.37±0.29(5) | NA | NA | NA |
Table 2B.
Gene expression in liver
| Gene | Lias+/+Apoe−/− mice | Lias+/−Apoe−/− mice | P value |
|---|---|---|---|
|
| |||
| STZ | STZ | ||
| Pyruvate dehydrogenase | 1.00±0.12(6) | 0.55±0.13 (5) | <0.05 |
| Citrate Synthase | 1.00±0.14(6) | 0.47±0.15 (5) | <0.05 |
| Cytochrome b | 1.00±0.20(6) | 1.59±0.32(5) | 0.08 |
| mtTFA | 1.00±0.29(6) | 0.81±0.27(5) | 0.40 |
Samples were taken at 6 months of age. Data shown are mean values ±SEM. mRNA levels of non-STZ treated Lias+/+Apoe−/− mice were used as references and set to 1.00 for genes GPX1, Sod1, Sod2 and MCP1. For CD36 and actin in aorta and all genes in liver, STZ-treated Lias+/+Apoe−/− /− mice as a control and are set to 1.00. NA: not available.
Inflammation
In non-diabetic mice, serum IL-6 in Lias+/−Apoe−/− was slightly higher than Lias+/+Apoe−/− mice although the difference was not significant. However, IL-6 levels in diabetic mice were significantly elevated (P<0.001). P<0.05 for interaction of two variables by two-way ANOVA indicates that the diabetic effect was more pronounced in Lias+/−Apoe−/− mice than in Lias+/+Apoe−/− mice (Figure 5).
Figure 5.
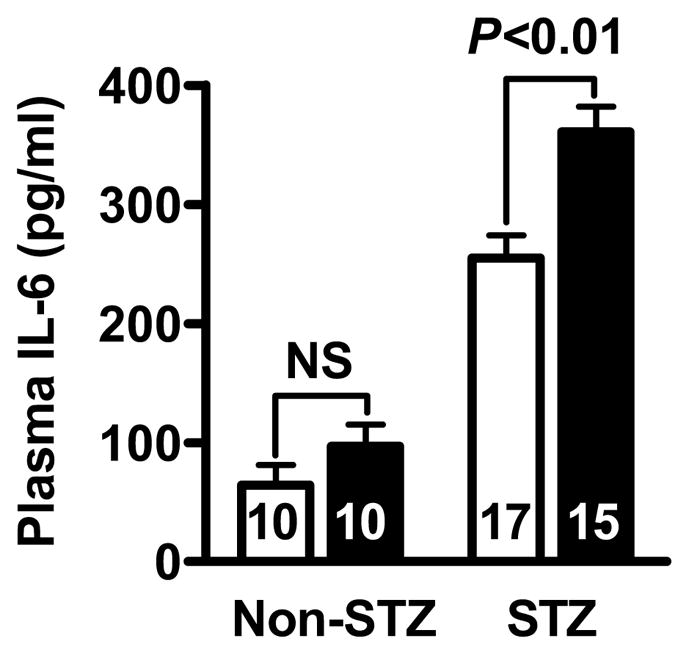
Plasma IL-6 measured by ELISA in Lias+/−Apoe−/− mice (black bars) and Lias+/−Apoe−/+mice (open bars). Values are expressed as mean ± SEM.
Kidney damage by oxidative stress
To determine susceptibility of the aorta and the kidney to oxidative stress and whether diabetic atherosclerosis was correlated with diabetic kidney disease, we examined daily urine albumin excretion in 6-month-old diabetic mice. Albuminuria was significantly higher in Lias+/−Apoe−/− mice than in Lias+/+Apoe−/− mice (Table 1). However, although urine albumin and atherosclerotic lesion size were increased in diabetes, there was no correlation between them in individual animals (data not shown).
4. Discussion
Our previous results have demonstrated that Lias+/− mice with 50% Lias gene expression developed ~1.5-fold enhanced atherosclerotic lesion size with a concomitant significant increase in plasma and tissue oxidative stress in non-diabetic male Lias+/−Apoe−/− mice [10]. Current studies show that induction of diabetes in mice by STZ treatment increased atherosclerotic lesion size in both genotypic groups, and diabetes and Lias heterozygosity contributed additively.
The genotypic effect may involve the following events: First, oxidative stress was involved in enhanced diabetic atherosclerotic development. Our data show that antioxidant capacity indicated by the ratio of erythrocyte GSH to GSSG in diabetic mice declined compared with the non-diabetic mice. In addition, Lias gene expression in diabetic Lias+/−Apoe−/− mice dropped to 20% of non-diabetic Lias+/+Apoe−/− controls. Furthermore, aortic Gpx-1 gene expression was up-regulated in the diabetic mice, and significantly enhanced in diabetic Lias+/−Apoe−/− mice as a physiological response to oxidation [13]. Moreover, the number of macrophages co-localizing with apoptotic cells were increased in the plaques of diabetic Lias+/−Apoe−/− mice as compared to diabetic Lias+/+Apoe−/− mice. The result suggests that LA may target macrophage directly as a recent paper shows that LA inhibited foam cell formation [14]. On the other hand, the antioxidant capacity was limited. The endogenous antioxidant capacity is likely exhausted after being stressed by a combination of both atherosclerosis and diabetes in diabetic Lias+/+Apoe−/− mice. This possibility is supported by the observation that plasma TBARs and gene expression of two important aortic antioxidant enzymes, Sod1 and Sod2, was reduced further in diabetic Lias+/+Apoe−/− mice than in diabetic Lias+/−Apoe−/− mice.
Second, the metabolic effect and potential mitochondrial protection of lipoic acid deficiency likely exacerbates atherosclerosis. It is very likely that LA, as a cofactor for several mitochondrial enzyme complexes, participates in metabolic reactions that contribute to reduce plasma cholesterol [9, 15], triglyceride [16] and body weight [17]. In addition, we previously showed that the dietary LA supplementation may accelerate the recovery of pancreatic beta-cells after STZ treatment [9]. Higher plasma glucose levels at 6 months in Lias+/−Apoe−/− mice than in Lias+/+Apoe−/− mice may therefore indicate increased recovery from diabetes. This is also consistent with the previous data that diabetic Lias+/−Apoe−/− mice had significantly higher plasma cholesterol than diabetic Lias+/+Apoe−/− mice [10]. On the other hand, our RT-PCR data results showed a significant reduction in the expression of two mitochondrial enzymes, pyruvate dehydrogenase and citrate synthase in diabetic Lias+/−Apoe−/− mice compared to diabetic Lias+/+Apoe−/− mice. The result implies that mitochondrial function was impaired. However, two other mitochondrial genes, cytochrome b and mtTFA, were not significantly different between the two genotypic mice, suggesting that the number of mitochondria and biogenesis are likely unaffected.
Finally, higher inflammation levels in the diabetic Lias heterozygotes likely exacerbate atherosclerosis. Studies have shown that type 1 diabetes is pro-inflammatory [18, 19], and inflammation is a major pathogenic factor contributing to the development of atherosclerosis [20]. Recent studies demonstrate association of increased systemic IL-6 levels with incidents of coronary heart disease [21]. We found that the pro-inflammatory cytokine, IL-6, was significantly increased in diabetic mice, especially Lias+/−Apoe−/− mice, compared to Lias+/+Apoe−/− mice (P<0.01). Increased inflammatory response of Lias+/− mice is consistent with our previous observation that Lias+/− mice have a markedly enhanced inflammatory response after administration of lipopolysaccharide [8]. Zhang et al., [16] described that LA inhibits atherosclerosis in Apoe−/− mice through its anti-inflammatory effect. IL-6 can induce expression of MCP-1 [22] that plays a pivotal role in trafficking of monocytes into aortic walls. Our data showed increased gene expression of aortic MCP-1, which may be responsible for increased macrophage in the plaques.
In conclusion, we have used genetic techniques to demonstrate that decreased antioxidant capacity exacerbates diabetes-associated atherosclerosis. These findings extend our understanding of the role of antioxidants in diabetic atherosclerosis.
Highlights.
We evaluate effects of reduced lipoic acid synthase gene expression on diabetic atherosclerosis.
Apolipoiprotein E null mice were crossed with Lias antioxidant model and then induced to diabetes.
Reduced endogenous lipoic acid capacity plays a role in development of diabetic atherosclerosis.
These findings extend our understanding of the role of antioxidant in diabetic atherosclerosis.
Acknowledgments
We thank Shinja Kim for technical help, and John Hagaman and Taylor Nipp for proof reading this manuscript. This work was supported by NIH grants, HL042630 and HL087946.
Footnotes
Conflict of interest
The authors have no conflicts of interest to disclose.
Publisher's Disclaimer: This is a PDF file of an unedited manuscript that has been accepted for publication. As a service to our customers we are providing this early version of the manuscript. The manuscript will undergo copyediting, typesetting, and review of the resulting proof before it is published in its final citable form. Please note that during the production process errors may be discovered which could affect the content, and all legal disclaimers that apply to the journal pertain.
References
- 1.Libby P. The forgotten majority: unfinished business in cardiovascular risk reduction. J Am Coll Cardiol. 2005;46(7):1225–8. doi: 10.1016/j.jacc.2005.07.006. [DOI] [PubMed] [Google Scholar]
- 2.Candido R, et al. Prevention of accelerated atherosclerosis by angiotensin-converting enzyme inhibition in diabetic apolipoprotein E-deficient mice. Circulation. 2002;106(2):246–53. doi: 10.1161/01.cir.0000021122.63813.32. [DOI] [PubMed] [Google Scholar]
- 3.Howard BV, et al. Prevention Conference VI: Diabetes and Cardiovascular disease: Writing Group I: epidemiology. Circulation. 2002;105(18):e132–7. doi: 10.1161/01.cir.0000013953.41667.09. [DOI] [PubMed] [Google Scholar]
- 4.Goldberg IJ. Why does diabetes increase atherosclerosis? I don't know! J Clin Invest. 2004;114(5):613–5. doi: 10.1172/JCI22826. [DOI] [PMC free article] [PubMed] [Google Scholar]
- 5.Santini SA, et al. Defective plasma antioxidant defenses and enhanced susceptibility to lipid peroxidation in uncomplicated IDDM. Diabetes. 1997;46(11):1853–8. doi: 10.2337/diab.46.11.1853. [DOI] [PubMed] [Google Scholar]
- 6.Reed LJ. From lipoic acid to multi-enzyme complexes. Protein Sci. 1998;7(1):220–4. doi: 10.1002/pro.5560070125. [DOI] [PMC free article] [PubMed] [Google Scholar]
- 7.Yi X, Maeda N. Endogenous production of lipoic acid is essential for mouse development. Mol Cell Biol. 2005;25(18):8387–92. doi: 10.1128/MCB.25.18.8387-8392.2005. [DOI] [PMC free article] [PubMed] [Google Scholar]
- 8.Yi X, et al. Mice with heterozygous deficiency of lipoic acid synthase have an increased sensitivity to lipopolysaccharide-induced tissue injury. J Leukoc Biol. 2009;85(1):146–53. doi: 10.1189/jlb.0308161. [DOI] [PMC free article] [PubMed] [Google Scholar]
- 9.Yi X, Maeda N. alpha-Lipoic acid prevents the increase in atherosclerosis induced by diabetes in apolipoprotein E-deficient mice fed high-fat/low-cholesterol diet. Diabetes. 2006;55(8):2238–44. doi: 10.2337/db06-0251. [DOI] [PubMed] [Google Scholar]
- 10.Yi X, et al. Genetic reduction of lipoic acid synthase expression modestly increases atherosclerosis in male, but not in female, apolipoprotein E-deficient mice. Atherosclerosis. 2010;211(2):424–30. doi: 10.1016/j.atherosclerosis.2010.03.009. [DOI] [PMC free article] [PubMed] [Google Scholar]
- 11.Maeda N, et al. Anatomical differences and atherosclerosis in apolipoprotein E-deficient mice with 129/SvEv and C57BL/6 genetic backgrounds. Atherosclerosis. 2007;195(1):75–82. doi: 10.1016/j.atherosclerosis.2006.12.006. [DOI] [PMC free article] [PubMed] [Google Scholar]
- 12.Kume T, et al. Measurement of the thickness of the fibrous cap by optical coherence tomography. Am Heart J. 2006;152(4):755, e1–4. doi: 10.1016/j.ahj.2006.06.030. [DOI] [PubMed] [Google Scholar]
- 13.Raes M, Michiels C, Remacle J. Comparative study of the enzymatic defense systems against oxygen-derived free radicals: the key role of glutathione peroxidase. Free Radic Biol Med. 1987;3(1):3–7. doi: 10.1016/0891-5849(87)90032-3. [DOI] [PubMed] [Google Scholar]
- 14.Cheng LC, et al. alpha-Lipoic acid ameliorates foam cell formation via liver X receptor alpha-dependent upregulation of ATP-binding cassette transporters A1 and G1. Free Radic Biol Med. 2011;50(1):47–54. doi: 10.1016/j.freeradbiomed.2010.10.706. [DOI] [PubMed] [Google Scholar]
- 15.Yang RL, et al. Lipoic acid prevents high-fat diet-induced dyslipidemia and oxidative stress: a microarray analysis. Nutrition. 2008;24(6):582–8. doi: 10.1016/j.nut.2008.02.002. [DOI] [PubMed] [Google Scholar]
- 16.Zhang WJ, et al. Dietary alpha-lipoic acid supplementation inhibits atherosclerotic lesion development in apolipoprotein E-deficient and apolipoprotein E/low-density lipoprotein receptor-deficient mice. Circulation. 2008;117(3):421–8. doi: 10.1161/CIRCULATIONAHA.107.725275. [DOI] [PubMed] [Google Scholar]
- 17.Lee WJ, et al. Obesity: the role of hypothalamic AMP-activated protein kinase in body weight regulation. Int J Biochem Cell Biol. 2005;37(11):2254–9. doi: 10.1016/j.biocel.2005.06.019. [DOI] [PubMed] [Google Scholar]
- 18.Devaraj S, Dasu MR, Jialal I. Diabetes is a proinflammatory state: a translational perspective. Expert Rev Endocrinol Metab. 2010;5(1):19–28. doi: 10.1586/eem.09.44. [DOI] [PMC free article] [PubMed] [Google Scholar]
- 19.Schram MT, et al. Markers of inflammation are cross-sectionally associated with microvascular complications and cardiovascular disease in type 1 diabetes--the EURODIAB Prospective Complications Study. Diabetologia. 2005;48(2):370–8. doi: 10.1007/s00125-004-1628-8. [DOI] [PubMed] [Google Scholar]
- 20.Wedrychowicz A, Dziatkowiak H, Sztefko K. Interleukin-6 (IL-6) and IGF-IGFBP system in children and adolescents with type 1 diabetes mellitus. Exp Clin Endocrinol Diabetes. 2004;112(8):435–9. doi: 10.1055/s-2004-821189. [DOI] [PubMed] [Google Scholar]
- 21.Danesh J, et al. Long-term interleukin-6 levels and subsequent risk of coronary heart disease: two new prospective studies and a systematic review. PLoS Med. 2008;5(4):e78. doi: 10.1371/journal.pmed.0050078. [DOI] [PMC free article] [PubMed] [Google Scholar]
- 22.Rott D, et al. IL-6 is produced by splenocytes derived from CMV-infected mice in response to CMV antigens, and induces MCP-1 production by endothelial cells: a new mechanistic paradigm for infection-induced atherogenesis. Atherosclerosis. 2003;170(2):223–8. doi: 10.1016/s0021-9150(03)00295-8. [DOI] [PubMed] [Google Scholar]


