

Abstract
FMR1 premutation (PM) alleles have 55–200 CGG·CCG-repeats in their 5′ UTR. PM carriers are at risk of fragile X–associated tremor and ataxia syndrome (FXTAS). Females are also at risk for FX primary ovarian insufficiency (FXPOI). PM pathology is generally attributed to deleterious properties of transcripts with long CGG-tracts. For FXPOI, hormone changes suggest a reduced residual follicle pool. Whether this is due to a smaller than normal original follicle pool or an increased rate of follicle depletion is unclear. A FX-PM mouse the authors generated with 130 CGG·CCG-repeats in the endogenous Fmr1 gene recapitulates features of FXTAS. Here the authors demonstrate that the gross development of the ovary and the establishment of the primordial follicle pool is normal in these mice. However, these animals show a faster loss of follicles of all follicle classes, suggesting that the problem is intrinsic to the ovary. In addition, many oocytes show aberrant nuclear accumulation of FMRP and elevated levels of ubiquitination. Furthermore, PM follicles are smaller and have fewer granulosa cells (GCs) than normal. Thus, these animals have ovarian abnormalities involving both the oocytes and GCs that may shed light on the molecular basis of FXPOI in humans.
Keywords: knockin, immunocytochemistry, ovarian follicles, gene expression, oocyte, granulosa cells
The X-linked FMR1 gene has an expansion-prone CGG·CCG-repeat in its 5′ untranslated region (UTR) (Kremer et al. 1991; Verkerk et al. 1991). There are two pathological allele size classes seen in the human population. Full-mutation (FM) alleles have >200 repeats and are associated with gene silencing and a developmental disorder known as fragile X syndrome. In contrast, alleles with 55 to 200 repeats, so-called premutation (PM) alleles, are associated with a risk for a neurodegenerative disorder, fragile X– associated tremor and ataxia syndrome (FXTAS) (Hagerman and Hagerman 2001), and a form of ovarian dysfunction known as fragile X–associated primary ovarian insufficiency (FXPOI) (Vianna-Morgante et al. 1996; Murray 2000; Sherman 2000). FXPOI involves infertility, irregular menses, and an early menopause. This is accompanied by an increased rate of twinning (Vianna-Morgante 1999), elevated levels of follicle-stimulating hormone (FSH), and reduced levels of anti-Mullerian hormone (AMH), progesterone, and inhibins A and B (Murray et al. 1999; Welt et al. 2004; Gleicher et al. 2010), similar to what is seen in normal premenopause. It is thought that FXPOI accounts for ~11.5% of familial cases of ovarian insufficiency and ~3.2% of sporadic cases (Murray et al. 1998; Marozzi et al. 2000; Mallolas et al. 2001; Bussani et al. 2004). Even in the absence of FXPOI, PM carriers as a group enter menopause on average five years earlier than do their siblings without the PM (Sherman 2000).
Because the PM carrier frequency is between 1:115 and 1:259 (Toledano-Alhadef et al. 2001; Hagerman et al. 2008; Hantash et al. 2011), understanding the basis of the ovarian dysfunction is important because the ramifications of being a PM carrier extend beyond the issue of childbearing to an increased risk for conditions associated with the postmenopausal years, such as coronary heart disease and osteoporosis. Because early menopause can result in a doubling of the age-related mortality risk (Snowdon et al. 1989), this is a significant public health issue.
The molecular basis of the ovarian and brain pathology in PM carriers is unknown. Because the repeat expansion mutation responsible for disease pathology occurs outside of the open reading frame, the amino acid sequence of the FMR1 gene product, FMRP, is not affected. Furthermore, the levels of FMRP are much higher (although slightly below normal levels) in PM carriers than in FM carriers who do not show such symptoms. This, together with the fact that ectopic expression of RNA containing a long CGG-repeat tract is deleterious to a variety of cells and causes neurodegeneration in both flies and mice (Handa et al. 2003; Jin et al. 2003; Arocena et al. 2005; Hashem et al. 2009), has led to the suggestion that it is the long repeat tract in the RNA that is responsible for disease pathology. By analogy with myotonic dystrophy type 1 and 2, two other repeat expansion diseases, it has been suggested that PM symptoms could arise from the sequestering of key protein factors by the long CGG-RNA tract (Jin et al. 2007; Sofola et al. 2007; Sellier et al. 2010). However, despite the large body of work published in the area of FXTAS, the mechanism of disease pathology remains the subject of much debate. The situation with FXPOI is even less clear, with relatively few studies having been published, all of which have focused on the epidemiology and clinical description of the condition. Not only have no mechanistic studies been done, but no tissue culture or mouse model that may be useful to understand the mechanism has thus far been described.
Previously, we described the generation of a mouse with a targeted insertion of ~130 CGG repeats in the murine Fmr1 gene (Entezam et al. 2007); the offspring of these mice had elevated levels of Fmr1 mRNA in the brain like human PM carriers, and FMRP levels were lower than in normal mice. These mice also showed clear neuropathological changes in many brain regions similar to those reported in postmortem samples from humans with FXTAS (Greco et al. 2002; Willemsen et al. 2003). However, no detailed study has yet been published on the ovaries of these animals.
We describe here the results of our characterization of PM ovaries at the molecular and cellular level. We show that PM mice have a normal initial primordial follicle pool but show a more rapid depletion of this follicular reserve than do wild-type (WT) mice. Furthermore, these animals showed other differences from WT animals that may reflect the underlying pathology, including a smaller than normal number of granulosa cells (GCs) per follicle, a higher frequency of coronal abnormalities, and an increased rate of follicular atresia. Oocytes also show an abnormal distribution of FMRP and high levels of ubiquitination. Our data suggest that the FX PM mouse we have generated may be a good model for FXPOI and thus be able to provide useful insights into the ovarian dysfunction seen in human PM carriers.
Materials and Methods
Mice
All animal protocols for this study were approved by the National Institutes of Health (NIH) Institutional Animal Care and Use Committee. PM and WT mice were bred at the NIH as described previously (Entezam et al. 2007). The PM mice had all been backcrossed to C57BL/6 for at least 15 generations, and where possible, WT littermates were used as controls. All mice used in this study had ~130 repeats unless otherwise specified. In some cohorts studied, such alleles are associated with the highest risk of FXPOI (Spath et al. 2011). Even in cohorts where such alleles are not associated with the very highest risk, the risk of FXPOI remains high (Spath et al. 2010). Thus, although 130 repeat alleles are less prevalent than smaller alleles, this allele size might allow us to see pathology in animals with a much shorter reproductive life span than humans. Mice from all stages of the reproductive life span were examined, from shortly after the onset of puberty at 7 to 10 weeks to long after reproductive senescence at 2.5 to 3 years of age. However, most analyses involved mice at three different stages of reproductive competence in C57BL/6J mice: at 4 months of age, a time where reproductive maturity has been reached but regular cyclicity has not yet been established; at 7 to 9 months, the peak of reproductive competence in this strain of mice; and at 10 to 12 months, when WT mice of this strain have entered a peri-menopausal-like stage where litter size has begun to decrease and FSH levels have begun to rise precipitously (Nelson et al. 1982).
Fmr1 mRNA analysis
Total RNA was prepared from the brains and ovaries of WT and PM mice at 6, 12, and 18 months of age as previously described. Three mice were used for each genotype at each time point. The levels of Fmr1 mRNA and glyceraldehyde-3-phosphate dehydrogenase (GAPDH) were determined by real-time PCR using the appropriate Taqman primers and Taqman Fast Universal PCR mix (Applied Biosystems; Carlsbad, CA) according to the supplier’s instructions. Levels of GAPDH were shown to be similar in both brain and ovaries at all ages. Fmr1 levels were then expressed relative to GAPDH.
In situ hybridization was carried out with a biotinylated riboprobe corresponding to the Fmr1 ORF. The riboprobe was generated from a cDNA clone by PCR and labeled with 16-biotinylated-dUTP (Roche Diagnostics Corp.; Indianapolis, IN). Hybridization to sections of mouse ovary was carried out as described previously (Berghorn et al. 2001; Koban et al. 2006; Carlson et al. 2009). Briefly, 25-µm sections from the ovaries of mice perfused with 2.5% acrolein in 4% buffered paraformaldehyde were maintained in cryoprotectant at −20C. The sections were rinsed in 0.05 M potassium phosphate-buffered saline (KPBS) and placed into 1% sodium borohydride in KPBS to remove the fixative. Sections were then rinsed and maintained overnight in KPBS with 0.5% Triton-X-100 at 4C. The next day, they were rinsed twice in 0.1 M triethanolamine buffer (pH 8.0) and three times in 2× SSC before being incubated overnight at 50C with heat-denatured riboprobe (600 ng/kb/ml) and 0.25 mg/ml yeast RNA (Ambion; Foster City, CA) in hybridization buffer (1.4 ml per well made with 750 µl deionized formamide, 300 µl 50% dextran sulfate, 90 µl 5 M NaCl, 12 µl 1M Tris [pH 8.0], 2.4 µl 0.5 M EDTA, 30 µl 50× Denhardt’s solution, and 250 µl of H2O). Sections were rinsed in 4× SSC, then in RNase buffer (10 mM Tris [pH 8.0], 500 mM NaCl, 0.75 mM EDTA), and then incubated in 20 mg/ml RNAase (Qiagen; Valencia, CA) in the RNase buffer for 30 min at 37C. After being washed in 2× SSC and then in 1× SSC, the sections were incubated in 0.1× SSC for 1 hr at 55C. They were rinsed multiple times with KPBS and then incubated with a goat antibody against biotin at a concentration of 1:100,000 for 48 hr at 4C. The sections were then processed for chromagen deposition using a standard ABC immunoperoxidase method with 3,3′-diaminobenzidine tetrahydrochloride (DAB) solution (1 mg DAB plus 125 mg nickel [II] sulfate with 4.2 µl 3% H2O2 per 10 ml of 175 mM sodium acetate) to yield a black reaction product. Staining was allowed to proceed for 20 min, after which time the sections were rinsed in acetate solution and then in KBPS, placed into normal saline, and mounted onto subbed slides. Sections were dried overnight, dehydrated in ascending alcohols, cleared in xylenes, and coverslipped with Histomount. Fmr1 mRNA was detected as black clusters within the cells, and the numbers or optical densities of the clusters reflected accurately the levels of mRNA expression (Berghorn et al. 2001).
FMRP analysis
Five PM and two WT mice, 8 to 10 weeks of age, and nine PM and nine WT mice, 7 months of age, were administered an overdose of pentobarbital (100 mg/kg, intraperitoneally), injected with 10 units of heparin, and perfused transcardially with 4% paraformaldehyde buffered to pH 6.8 that contained 2.5% acrolein added just prior to perfusion. The ovaries were then removed, placed into egg yolk gelatin (Winans and Powers 1977), postfixed in buffered 4% paraformaldehyde overnight, sunk in 30% aqueous sucrose solution made in 1% paraformaldehyde for one to two days until the block sunk, and cut at 25 microns on a Richard Allen freezing microtome (Richard-Allan MICROM HM 450 Sliding Microtome, Fisher Scientific, Pittsburgh, PA). The sections were then placed into antifreeze solution (Watson et al. 1986) and stored at −20C until staining was initiated. Immunocytochemical staining for FMRP was conducted on every 12th section throughout the ovary using a standard ABC immunoperoxidase approach and nickel DAB as the chromagen as described previously (Entezam et al. 2007). If blood was present in the tissue, the sections were pretreated with 1% hydrogen peroxide for 5 min and rinsed in PBS prior to application of the primary antiserum. Rabbit anti-FMRP (#17722; Abcam, Cambridge, MA) was used at a concentration of 1:12,000. Chromagen staining was carried out for 15 min. No staining was seen in the absence of primary antibody or when normal rabbit serum was substituted for the primary antiserum (Fig. 1A,B). Analysis of the FMRP intensity in somatic follicle cells of antral and preantral follicles was performed by capturing sections under 2× magnification, manually selecting the GCs (excluding the oocyte), and acquiring the mean gray levels for the cells in each follicle. A region of tissue that did not contain granulosa or luteal cells was used for background levels and was subtracted from that of the GCs. Average gray levels from follicles in WT and PM mice were compared using analysis of variance (ANOVA).
Figure 1.

Negative controls for FMRP localization. (A) No primary antibody and (B) substitution of normal rabbit serum in place of the primary antibody. The arrows in both figures show follicles. Bars = 100 µm.
For the seven-month-old ovaries, analysis of FMRP levels was not easily compared using the same strategy as applied to the ovaries from younger mice, because what differed in the two genotypes was where the protein was expressed. Thus, the analysis focused on whether in oocytes, the FMRP was predominantly cytoplasmic or nuclear. Numbers of oocytes in these two categories were compared with ANOVA.
Ubiquitin analysis
Every sixth section from the ovaries from the seven-month-old PM and WT mice, including those adjacent to the sections that were used to localize FMRP, were stained for ubiquitin using rabbit anti-ubiquitin (Dako rabbit anti-ubiquitin at a concentration of 1:50,000). The ABC immunocytochemical procedure was identical to that for FMRP (discussed earlier). Tissue was analyzed for the number of ubiquitin-immunoreactive in oocytes, the general intensity of staining, and whether the ubiquitin was present throughout the cell cytoplasm and nucleoplasm or concentrated in nuclear/perinuclear zones within the oocyte. Numbers of oocytes that had evenly dispersed ubiquitin mainly in the cytoplasm or had high concentrations of ubiquitin throughout the cells or concentrated within the nuclear/perinuclear zone were compared with ANOVA.
Follicle analysis
Twenty-four WT and 36 PM mice between 4 and 12 months of age and 14 animals (3 WT and 9 PM) 22 to 30 months of age were euthanized by cervical dislocation, and ovaries were excised and placed into Kahle’s solution (4% formalin, 28% ethanol, and 0.34 M glacial acetic acid) for at least 24 hr. The tissue was then placed into an ascending series of alcohols, cleared in xylenes, and embedded in paraffin. Serial 10-µm sections were cut on a rotary microtome and stained with hematoxylin and eosin (H&E). Slides were coded so the examiner was blind to the age and genotype of the animal. A Nikon Eclipse 800 microscope (Nikon; Melville, NY) and a Retiga EX digital camera (Retiga, Biovision Technologies, Exton, PA) were used for image acquisition, and images were acquired and processed on a Macintosh G4 computer using iVision software (Biovision Technologies, Exton, PA).
Ovarian volumes were determined based on every 20th section using the disector method (Mouton 2002) in which the area of the ovarian tissue was obtained for each section (spaces and outside tissues were excluded) and the areas (mm2) were multiplied by the section intervals in mm. Values are expressed as µl (mm3). Follicle counts were made using a modification by Flaws et al. (2001). Slides were coded so the counter was blind to the genotype of the animal. Follicles from every 10th section from the paraffin series were categorized as to whether they were primordial, primary, preantral, or antral. Only follicles in which the oocyte nucleus (germinal vesicle) was visible were counted. To determine the total numbers of follicles in each class, the oocyte diameters were determined for each follicle class by sampling a random subset of animals in both genotypes at each age range. Numbers of follicles were adjusted for section thickness and interval between counted sections using the formula devised by Hirshfield (1988). The numbers were then adjusted for double-counting errors using the Abercrombie correction factor (follicle number = (interval correction × N × (T/T + D)), where N is the counted number, 10 is the section interval correction, T is the section thickness (10 µm), and D is the calculated mean diameter of the oocyte in that follicle class (Abercrombie 1946). For the large corpora lutea (CLs), a 1 in 10 series corrected by the Abercrombie formula could not be conducted because they have no well-demarcated center. Rather, CLs were counted by following them through all the serial sections. The sizes of the pools of follicles and CLs were analyzed with two-way ANOVA using standard least squares, grouping the data by age group and genotype. Pairwise post hoc comparisons were made using t-tests or Tukey honestly significant difference (HSD) test. In some instances, associations of two measurement variables were tested using linear regression. Analyses used both JMP (Macintosh) and SAS software from the SAS Institute (Cary, NC). A detailed analysis of the GCs in antral follicles of four-month-old mice (12 WT and 11 PM mice) was carried out by determining the maximal cross-sectional area of all antral follicles and the area occupied by GCs. Using the average size of individual GCs, an approximation of granulosa cell numbers at the follicle’s maximal area could be calculated (Hirshfield 1984). In the course of this analysis, a number of the oocytes within antral follicles were found to have lost prophase I arrest and thus lacked a nuclear membrane. Because the initial count of antral follicles in every 10th section did not include oocytes lacking a nuclear membrane, we reexamined all sections to determine more accurately the numbers of oocytes that had escaped meiotic arrest. Statistical tests for this phase used one-way ANOVA.
Atretic follicles were first counted in six-week-old PM mice in which the animals were homozygous for the PM. The ovaries were fixed in 10% neutral formalin, embedded in paraffin, and every 10th section was stained with hematoxylin and picric methyl blue. An ovarian follicle was considered atretic when the oocyte nucleus was visible and more than three GCs were karyopyknotic, an indicator of apoptosis. The number of atretic follicles was then plotted as a function of the sum of the repeats in the two alleles. Similar results were obtained when the data were plotted as a function of the number of repeats in the larger of the two alleles. Additional analyses of atresia in older mice (22 WT and 33 PM in the 4- to 12-month age group) used counts from every section and combined classic measures of advanced follicle atresia (losses of GCs and replacement by macrophages or interstitial tissue, multiple pyknotic cells) and those follicles with escape from meiotic arrest that lacked other markers. Because rates of atresia are elevated shortly after ovulation, markers of recent ovulation (newly forming CLs and, when the uterus was present, oocytes in the fallopian tubes or uterine antra) were applied to distinguish recent ovulation from other stages. For analysis of these data, two-way ANOVAs were conducted to determine effects of genotype and ovulatory status followed by pairwise analyses.
Cyst analysis
Paraffin-embedded ovaries were scored for presence, number, and maximal diameter of cysts. Chi-square analyses were conducted to determine effects of genotype.
Results
Fmr1 is highly expressed in the ovary and oocytes of PM mice
FMRP levels are known to be high in the brain of WT mice and humans. However, early reports suggested that FMRP expression in the ovary was low (Bakker et al. 2000). Using immunocytochemistry, we found that FMRP was in fact well expressed in the cytoplasm of granulosa and luteal cells of the ovaries of WT mice (Fig. 2A,B). It was also very highly expressed in the oocytes of mice of all ages, being particularly high in primordial, primary, and early preantral follicles (Fig. 2B). Little or no FMRP was found in the interstitial cells. In one- to two-month-old PM animals with ~130 repeats, FMRP levels (mean gray levels) were lower in the somatic granulosa and luteal cells than in WT mice (Fig. 2C,D, Fig. 3A). The reduced level of FMRP is reminiscent of what we have previously observed in the PM mouse brain (Entezam et al. 2007). A similar reduced level of FMRP relative to mRNA levels is also seen in blood, lymphoblastoid cells, and brains of human PM carriers (Tassone et al. 2000; Kenneson et al. 2001; Primerano et al. 2002). The reduced level of FMRP in PM carriers is thought to reflect the inhibitory effect of long CGG-repeats on translation (Feng et al. 1995). In human and murine carriers of PM alleles, intranuclear inclusions containing FMR1 mRNA are seen in a number of non-ovarian cell types, including those of the brain and adrenal glands (Brouwer et al. 2008). However, we observed only one acidophilic nuclear inclusion in an oocyte of 1 of 45 PM mice examined and no inclusions at all in other ovarian cells.
Figure 2.

FMRP immunoreactivity in the ovaries of wild-type (WT) and premutation (PM) mice. FMRP immunoreactivity in WT (A, B) and PM (C, D) ovaries from animals five to seven weeks of age. A and C, bars = 500 µm; B and D, bars = 10 µm.
Figure 3.

Changes in FMRP and Fmr1 expression. (A) Intensity measures of FMRP in somatic cells of the ovaries of five- to seven-week-old mice. Wild-type (WT), black bar; premutation (PM), open bar (*p<0.05, analysis of variance [ANOVA]). (B) Total ovarian Fmr1 mRNA (mean ± SEM) normalized to glyceraldehyde-3-phosphate dehydrogenase (GAPDH) in WT (white bars) and PM mice (black bars) at 6, 12, and 18 months of age. Bars with different letters are significantly different by two-way ANOVA.
Consistent with the finding of high levels of FMRP in the ovary, at six months of age, Fmr1 mRNA is expressed in WT mouse ovaries at levels ~40% of that of GAPDH, a well-expressed housekeeping gene (Fig. 3B). This is significantly higher relative to GAPDH than it is in brain, where the Fmr1 gene product is crucial for normal learning and memory (data not shown). This suggests that there may be an important role for FMRP in ovarian development that may be masked by compensation by one or both of the autosomal homologs of FMR1, FXR1, and FXR2. One consequence of the high level of Fmr1 expression in ovary is that any deleterious effect of the CGG-containing RNA may be intrinsic to the ovary rather than arising elsewhere in the hypothalamic-pituitary-gonadal (HPG) axis.
As we previously found in brain, real-time PCR showed that the Fmr1 mRNA levels in ovaries of PM mice were significantly higher than WT at all ages (Fig. 3B) and that in both WT and PM mice, there was a significant effect of age (p<0.0007), a significant effect of genotype such that PM > WT at all ages (p<0.0001), and an interaction of genotype and age (p=0.0104). At six months, mRNA levels in PM mice were 3-fold higher than their age-matched WT controls (p=0.0133). Interestingly, the expression of Fmr1 increased 2.4-fold in WT and 3.5-fold in PM ovaries at 12 months of age, then dropped slightly but not significantly in both WT and PM mice at 18 months of age (Fig. 3B). At any of the ages examined, Fmr1 mRNA was at least 2.7-fold higher in PM animals than in WT animals across the age range. In situ hybridization with a probe for Fmr1 mRNA showed elevated levels of Fmr1 RNA in the oocytes and GCs in seven-month-old PM mice compared with WT mice (WT: Fig. 4A,B,F; PM: Fig. 4C–E,G).
Figure 4.

(A) In situ Fmr1 mRNA hybridization in eight-month-old wild-type (WT) (A, B, and F) and premutation (PM) (C, D, E, and G) mice, showing primordial oocytes (A–E) and the oocytes and granulosa cells (GCs) of early antral follicles (F, G). The mRNA is visible as black spots that are predominantly cytoplasmic. Bars = 10 µm.
PM mice at seven months of age have abnormal distribution of FMRP and elevated levels of ubiquitination
At seven months of age, patterns of FMRP expression in WT mice were quite similar to those in younger WT mice (Fig. 5A–D). Notably, despite markedly higher levels of Fmr1 mRNA expression, these mice did not show increased protein expression in any of the ovarian cells. However, although WT oocytes showed a predominant cytoplasmic localization of FMRP (Fig. 5A–D), in PM oocytes, FMRP levels were much higher in the nucleus than in the cytoplasm (Fig. 5E–H). PM mice had over eight times more oocytes with high nuclear concentrations of FMRP than did WT mice (Fig. 6; p<0.0001). Because FMRP is involved in the transport of the mRNAs whose translation it regulates, one potential consequence of a maldistribution of FMRP could be problems with the expression of a variety of other genes.
Figure 5.

FMRP expression in oocytes of mice seven months of age. (A–D) Examples of FMRP staining (black stain) in wild-type (WT) oocytes from animals seven months of age. Sections are counterstained with Neutral Red. Bars = 10 µm. (E–H) Follicles from seven-month-old premutation (PM) mice. The micrographs show primordial (A, E), primary (B, F) and preantral follicles (C, D, G, and H). Bars = 10 µm.
Figure 6.

Bar graph showing the mean number of oocytes with nuclear concentrations of FMRP (± SEM) in every sixth section from each ovary in nine wild-type (WT) mice (open bars) and nine premutation (PM) mice (black bars). *p=0.0001.
Because abnormal ubiquitination is seen in the brains of PM mice and humans (Entezam et al. 2007; Greco et al. 2002), we also examined ubiquitination in the ovaries of PM mice. PM mice showed much higher levels of ubiquitin (Ub) in oocytes than did WT animals. The Ub in WT mice was evenly distributed throughout both the cytoplasm and nucleoplasm (Fig. 7A); PM oocytes not only had greater numbers of oocytes with elevated ubiquitin (Fig. 7B, Fig. 8A), but some oocytes had a pronounced nuclear/perinuclear concentration of the protein (Fig. 7C,D). Interestingly, animals with the greatest number of oocytes with nuclear FMRP had the highest number of oocytes with abnormally high concentrations of Ub (Fig. 8B).
Figure 7.

Changes in ubiquitin. Staining for ubiquitin in wild-type (A) and premutation (B–D) oocytes. Bars = 100 µm.
Figure 8.
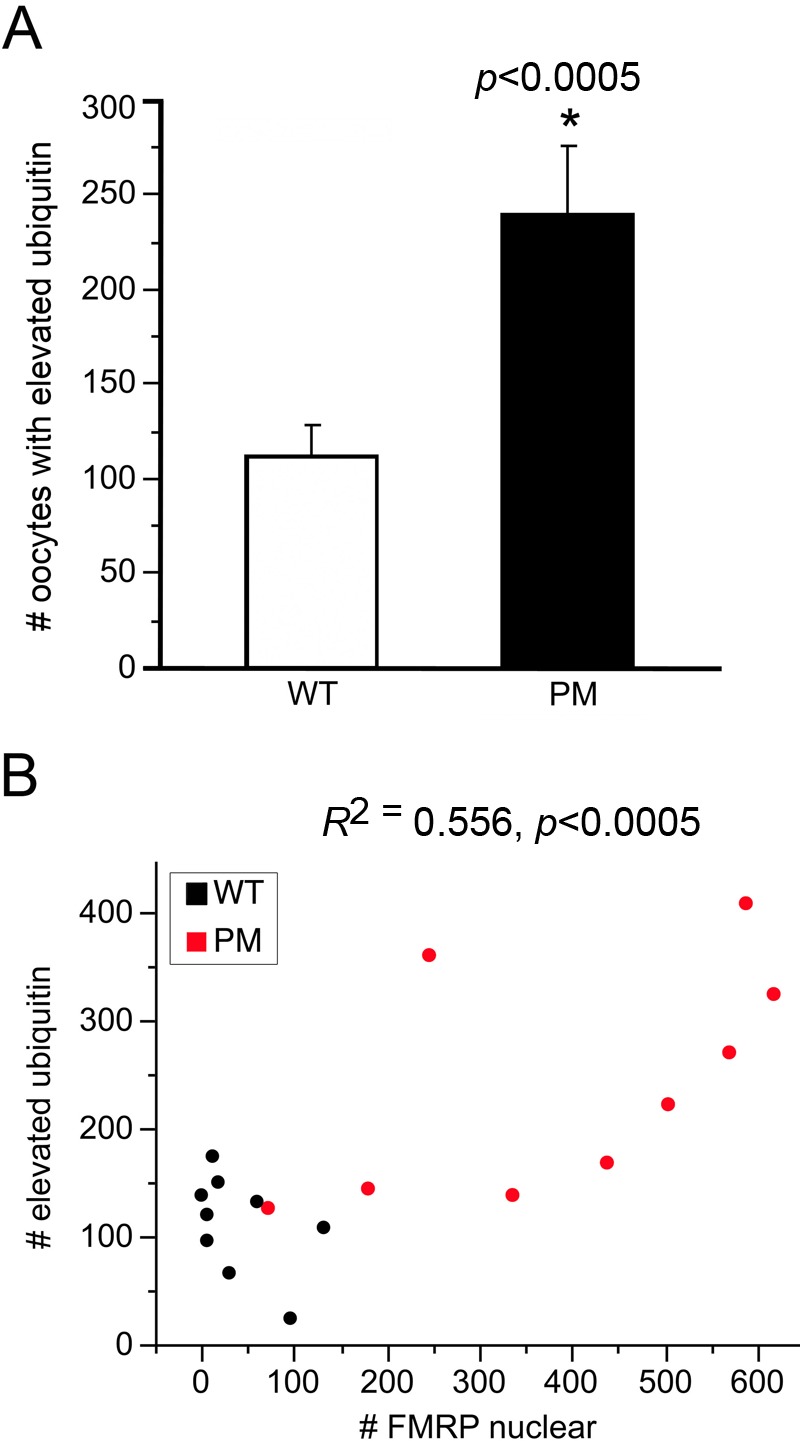
(A) Numbers of follicles in wild-type (WT) and premutation (PM) mice that expressed elevated or abnormally distributed ubiquitin. Numbers of oocytes in WT (open bar) and PM (black bar) mice had either visibly increased ubiquitin throughout the cytoplasm or high nuclear or perinuclear concentrations of ubiquitin. *p<0.005. (B) Relationship between numbers of oocytes with nuclear concentrations of FMRP and oocytes with elevated ubiquitin immunoreactivity (WT, black dots; PM, red dots).
PM mice show a more rapid depletion of advancing follicles
The total follicle numbers (Fig. 9A) and profiles of each of the constituent follicle classes (Fig. 9B–E) were very similar in WT and PM animals at four months, indicating that the PM does not affect the establishment of the primordial follicle pool or the wave of atresia that occurs postnatally in mice. However, after four months of age, PM mice showed significantly fewer follicles than did WT mice (two-way ANOVA, effect of genotype: p=0.013). Moreover, for all subclasses of follicles, PM mice showed a significant reduction in follicle numbers earlier than did WT mice.
Figure 9.

Follicle changes in wild-type (WT) and premutation (PM) ovaries with age. Bar graphs illustrating (A) the changes in total follicle numbers with age in WT (white bars) and PM (black bars) mice. (B–E) Changes in follicle numbers with age for (B) primordial, (C) primary, (D) preantral, and (E) antral follicles. Values represent the average total counts/ovary ± SEM. A two-way analysis of variance was first conducted followed by post hoc analyses. Bars with different letters are significantly different by Tukey honestly significant difference (HSD) post hoc comparisons (p<0.05).
In both WT and PM mice, the size of the primordial pool was correlated with the numbers of subsequent advancing classes of follicles (r2 = 0.430, p<0.0001) and with each of the subclasses of follicles: primary follicles (r2 = 0.348, p<0.0001), preantral follicles (r2 = 0.256, p<0.0001), and antral follicles (r2 = 0.305, p<0.0001). A lack of difference between WT and PM mice in the ratios of primary, preantral, or antral follicles to the numbers of primordial follicles (Table 1) suggests that that the PM does not affect follicle maturation per se and does not result in a blockade at any one stage of follicle progression.
Table 1.
Ratio of Each Advancing Follicle Class to Primordial Follicle Numbers Shows Age but Not Genotype Effects in WT or PM Mice
| Primary: Primordiala | Preantral: Primordialb | Antral: Primordialc | ||||
|---|---|---|---|---|---|---|
| Age | WT | PM | WT | PM | WT | PM |
| 4 months | 0.435 ± 0.157 | 0.528 ± 0.163 | 0.260 ± 0.143 | 0.384 ± 0.149 | 0.019 ± 0.009 | 0.033 ± 0.010 |
| 7–9 months | 0.378 ± 0.339 | 0.889 ± 0.196 | 0.181 ± 0.309 | 0.278 ± 0.179 | 0.019 ± 0.020 | 0.032 ± 0.012 |
| 10–12 months | 1.575 ± 0.222 | 0.956 ± 0.169 | 0.834 ± 0.202 | 0.760 ± 0.155 | 0.042 ± 0.013 | 0.040 ± 0.010 |
PM, premutation; WT, wild-type.
Effect of genotype p=0.672, NS. Effect of age p=0.001 (4 vs 10–12 months).
Effect of genotype p=0.710, NS. Effect of age p=0.007 (4 vs 10–12 months).
Effect of genotype p=0.379, NS. Effect of age p=0.388, NS.
If follicle depletion in PM mice were the result of elevated levels of recruitment, then numbers of CL, the transient progesterone-secreting structures required for pregnancy maintenance that arise from postovulatory follicles, should be elevated in the PM mice. However, the PM mice had a smaller numbers of CL than did WT mice (Fig. 10A; p=0.039). Thus, increased recruitment does not seem to account for the increased rate of follicle depletion. In fact, WT and PM mice had similar ratios of CL to advancing follicles, and in both genotypes, this ratio increased at the 10- to 12-month age group (Fig. 10B). Reduced CL numbers in the absence of altered CL/advanced follicle ratios would be consistent with there being a lower number of follicles available for ovulation.
Figure 10.

Corpora lutea (CL) numbers in wild-type (WT) and premutation (PM) mice. (A) Bar graphs illustrating the CL number/ovary at 4, 7 to 9, and 10 to 12 months of age in WT (white bars) and PM mice (black bars). Effect of genotype in a two-way analysis of variance (ANOVA; indicated by different letters) was significant. (B) Expression of the CL numbers relative to the number of advanced follicles (preantral + antral) in each ovary. Bars with different letters are significantly different by two-way ANOVA and paired t-test post hoc comparisons (p<0.05).
PM ovaries also show altered morphology
Although the morphology of the ovaries of PM mice at four months of age was grossly normal (compare right and left panels of Fig. 11A), the PM ovaries were on average 15% smaller (Fig. 12A; 35 PM and 21 WT; p=0.03). Furthermore, although in WT mice, the ovarian volume declined linearly as the animals aged as expected (WT: r2 = 0.343; p=0.0053), in PM mice, the ovarian volume did not change significantly over the 4- to 12-month period (Fig. 12A; p=0.171). Consistent with this observation, we found that although ovarian volume in WT mice was correlated with the total of all follicles and CL and declined as animals aged (WT: r2 = 0.329; p=0.007), no correlation was noted for PM mice (p=0.458).
Figure 11.

Histological changes in the ovaries with age in wild-type (WT) and premutation (PM) mice. (A) Hematoxylin and eosin (H&E)–stained sections from the ovaries of a four-month-old WT mouse and (B) a four-month-old PM mouse. The asterisk in the PM ovary marks a small cyst. A large fat deposit just outside the ovary of the PM mouse would not be counted as ovarian parenchyma. (C) H&E staining of the ovary of a one-year-old WT mouse and (D) a one-year-old PM mouse. CL, corpora lutea; AF, atretic follicle, Bars = 500 µm. (E) H&E-stained section of an ovary of an 8.5-month-old PM mouse showing an example of the ovarian cysts that occur more commonly in PM mice. Asterisks indicate the cysts. Bar = 500 µm. (F) Ovarian atrophy and tubulostromal hypertrophy in a 12-month-old PM mouse. An asterisk indicates a large cyst. Bar = 500 µm.
Figure 12.

Changes in the size of the ovary and its follicles. (A) Bar graph depicting the changes in ovarian volume with age in wild-type (WT) mice (white bars) and premutation (PM) mice (black bars). Bars with different letters are significant at p<0.05 by analysis of variance (ANOVA) followed by t-test post hoc. (B) Antral follicle area in four-month-old WT and PM mice (ANOVA, p<0.003). Antral follicle areas were measured at each follicle’s maximal diameter. (C) Granulosa cell (GC) number in these follicles (ANOVA, p<0.002). (D) The relationship between antral follicle area and GC number. Values for WT mice are represented by black dots; values for PM mice are represented by red dots.
Two phenomena could account for the preservation of ovarian volume in PM mice in the face of declining follicle numbers. First, PM mice showed an obvious increase in the ovarian interstitium with age (cf. Fig. 11C and 11D). In young WT and PM mice, interstitial hypertrophy was rare (1 of 16 PM mice and 1 of 17 WT). In contrast, 52.4% (12/21) of the 8- to 12-month-old PM mice showed increases in interstitial cells often with macrophage infiltration compared with 28.8% of 8- to 12-month-old WT mice (2/7); p=0.0006. Interstitial expansion was accompanied by tubulostromal hyperplasia in 10 of 48 PM animals examined (21%) (Fig. 11E). No such changes were seen in 34 WT animals.
Second, PM mice had twice the incidence of ovarian cysts as WT animals (67% vs. 29%; p=0.0115) (see Fig. 11F for an example). Furthermore, although most WT mice had no more than one cyst/ovary, many PM mice had multiple cysts (p=0.0001). The cysts were also significantly larger in PM mice (p=0.0079) and, unlike those in WT animals, cyst size increased with age (PM, p=0.005; WT, p=0.492). Although our measurements of the cellular volume excluded fluid compartments and the cells lining cysts when both were apparent, some tangential sections of cyst epithelium would have been included in ovary cell volume determinations. The details of these cysts in relation to those seen in human premutation carriers will be described elsewhere (manuscript in preparation).
PM follicles show granulosa cell abnormalities
Follicle size is a major determinant of the overall volume of the young ovary, with the large antral follicles making the largest contribution to ovarian volume. Thus, it may be that the reduced ovary size seen in young PM animals results from a smaller than normal size of the antral follicles. We found that the cross-sectional areas of antral follicles of four-month-old PM mice were 12% smaller than those of age-matched WT mice (Fig. 12A,B; p=0.003). Because the fluid-filled antral areas showed no significant effect of genotype (p=0.274), this suggests that there are a smaller than normal number of GC cells in the antral follicles of PM mice. Indeed, estimates of GC numbers derived from analysis of the areas occupied by these cells at the site of maximal follicle diameter (Hirshfield 1988) indicated that PM follicles had 15% fewer GCs than did WT mice (Fig. 12C; p=0.002). The relationship between GC numbers and antral follicle areas is strongly linear (Fig. 12D; r2 = 0.733; p<0.0001).
In addition to a smaller number of GCs/follicle, PM mice had significantly more antral follicles in which the corona, the GC-derived cells that surround the oocyte in more mature follicles and that are essential for oocyte viability and quality, was partial or missing (cf. Fig. 12A and 12B; Fig. 13A; p=0.01). This would be consistent with a problem with GC viability or ability to proliferate normally. Because GCs play an important role in maintaining prophase I arrest, one consequence of this might be an increase in the number of oocytes that show premature meiotic progression. In the four-month-old group, PM mice had twice the number of oocytes in antral follicles in advanced meiosis than did WT mice (Fig. 12C and Fig. 13B; p=0.04). Follicles in WT mice advancing in meiosis more frequently had a normal corona, whereas almost all such follicles in PM mice showed coronal abnormalities (Fig. 13C).
Figure 13.

Coronal abnormalities and premature loss of prophase I arrest in wild-type (WT) and premutation (PM) mice. (A) Hematoxylin and eosin (H&E) staining of a follicle from a four-month-old WT mouse shows a normal graafian follicle. Bar = 100 µm. (B) PM follicle with a partial corona (insert) or absent corona typical of atresia. Bar = 100 µm. (C) Example of a PM antral follicle with an incomplete corona that has a spindle and chromosomes in anaphase.
Not surprisingly, given the GC abnormalities, many of these advanced PM follicles showed signs of being atretic. Atresia immediately following the preovulatory gonadotropin surge is normal, and WT mice showed high levels of atretic follicles (normalized to the total advancing follicle pool) at this time, whereas at other times of the cycle, atretic follicles were rare. In contrast, PM mice showed a high ratio of atretic follicles to advancing follicles irrespective of where they were in their estrus cycle (Fig. 13D). Furthermore, mice homozygous for PM alleles that had a combined repeat number of 325–375 showed twice as many atretic follicles as mice with a total of 270–300 repeats at six weeks of age (Fig. 13E; p<0.05), suggesting that atresia is related to total repeat number. However, not all oocytes with abnormal coronas die prior to ovulation. although only 6% of WT eggs (1/17) detected in the fallopian tubes or uterus lacked a cumulus cloud, 67% of PM eggs did (29/43; p=0.032; Figs. 14 and 15).
Figure 14.

Coronal abnormalities, loss of prophase arrest, and atresia in wild-type (WT) and premutation (PM) mice. (A) Bar graph showing the number of follicles/ovary with either partial or absent corona (one-way analysis of variance [ANOVA], p=0.01). (B) Follicles in four-month-old WT (white bar) and PM mice (black bar) that have escaped meiotic arrest (one-way ANOVA, p=0.04). (C) Relationship between numbers of follicles with coronal abnormalities and those with signs of advancing meiosis in WT (black dots) and PM (red dots) mice. The diagonal lines in the figures represent the condition where all the follicles with abnormal coronas escaped meiotic arrest. (D) Atretic follicles in mice that have (+) and have not (–) recently ovulated. Bars with different letters are significantly different (p<0.05; two-way ANOVA, t-test pairwise comparison). (E) The relationship between repeat number and atresia. The number of atretic follicles in six-week-old mice homozygous for a PM allele were determined as described in the Materials and Methods and plotted as a function of the total number of repeats in both alleles. Different letters indicate clusters of animals whose values are statistically different (ANOVA, p<0.05).
Figure 15.

Fallopian tubes showing two wild-type (WT) eggs with a normal cumulus cloud (left panel) and a premutation (PM) egg without such a cloud (right panel). Bars = 100 µm.
Discussion
In this study, we have shown that fragile X PM mice show signs of ovarian dysfunction that resembles at least superficially what may be happening in FXPOI. Although in principle, FXPOI could arise from the presence of a smaller than normal primordial follicle pool at birth, our data show that the PM mice have an initial normal primordial reserve but show a more rapid decline in follicle number with age than do WT mice (Fig. 8). Using a formula adopted from Gosden et al. (1983), for calculating depletion of follicles (log Follicle number = intercept + [slope × age]), our PM mice would be expected to have 100 oocytes remaining (the number associated with impaired fertility) at 21 months of age compared to 33 months for WT animals. The follicular decline affects each advancing follicle class equally, as reflected by the constant ratio of advancing follicles to primordial follicles at all ages examined. This is different from what is seen in many mutant mice with impaired fertility that frequently show losses or gains in specific follicle classes (Jagarlamudi et al. 2010). For example, mice with mutations in the gene encoding AMH, which negatively regulates follicular recruitment, show initially higher numbers of small secondary follicles than do WT mice (Durlinger et al. 2002), whereas FSH receptor knockout mice show little or no follicular development beyond the small antral stage (Dierich et al. 1998). Because patterns of follicle loss are similar in the gonadotropin-independent and the gonadotropin-dependent follicles, this pathology may be intrinsic to the ovary, rather than a secondary effect of pathology elsewhere in the HPG axis. Because Fmr1 mRNA is expressed so highly in the mouse ovary (Fig. 2), an ovarian source of the pathology is certainly possible.
The fact that CL numbers/ovary are lower in PM mice and that CL numbers decline in parallel to the numbers of healthy advanced follicles (Fig. 9) suggests that reduced follicle survival rather than increased follicle recruitment is responsible for the more rapid depletion of the follicle pool seen in PM animals. This possibility is supported by the increased rates of atresia in the PM mice. Continued follicle losses were accompanied by interstitial hypertrophy and tubulostromal hypertrophy in the 7- to 12-month-old PM mice. Because these atrophic features are hallmarks of aging ovaries (Maronpot 1999), their presence at earlier ages in PM mice would be consistent with the idea that the ovaries in PM mice are showing signs of early decline.
Our data also show that PM mice have an increased incidence of serous cysts, as well as increased numbers of cysts and larger cyst sizes (Fig. 10). Ovarian cysts are associated with reduced fertility in both humans and animals (Fakhr et al. 1986; Kaneko et al. 2002; Kubar and Jalakas 2002). There is to date only one mention in the literature of a woman with 180 CGG repeats with cysts. Although 180 repeats is in the PM range, this allele was fully methylated and thus may have behaved more like a full mutation (Tassone et al. 2000). However, our group has now identified three FXPOI patients who underwent ovariectomy because of the presence of ovarian cysts. The histopathology of these cysts is currently under investigation. We found that in the PM mice, the presence of visibly large serous cysts in animals older than 15 months is diagnostic of the PM in our colony (unpublished observations). Our data suggest that cysts may be a useful diagnostic feature of the PM in humans. The basis of the increased cyst incidence is unclear.
The GC numerical abnormalities in PM follicles suggest one source of the reduced follicle viability. Because normal GC function is essential for oocyte viability, the reduced GC number may contribute to the elevated level of follicle atresia seen in PM animals and, because GC number affects the likelihood of ovulation (Robker and Richards 1998), the reduced number of CL formed as well. Furthermore, the reduced proliferation of the oocyte’s corona and the frequent absence of a properly formed cumulus cloud surrounding ovulated eggs might be expected to affect their quality. Thus, GC abnormalities could account for not only a more rapid decline in follicle number and reduced likelihood of ovulation but also the reduced rate of fertilization and implantation of these eggs that is seen in women with the PM (Gleicher et al. 2010; David Keefe, 2008 personal communication). However, other sources of pathology, including the zona pellucida, are also possible (Rankin and Dean 2000).
By analogy with myotonic dystrophy type I and II, repeat expansion diseases caused by sequestering of splicing factors by RNA with long CUG and CCUG-repeats, respectively, the CGG-repeats could sequester factors important for normal cell function. One potential candidate is the splicing factor Sam68, whose sequestration has been suggested to be responsible for the splicing defects seen in FXTAS patients (Sellier et al. 2010). However, Sam68-deficient mice show a specific decrease in the number of secondary and early antral follicles (Bianchi et al. 2010) rather than the more rapid decline in primordial follicles seen in the fragile X PM mice. Thus, if protein sequestration is responsible for FXPOI, it presumably involves a different protein. It is also possible that the repeats act via their ability to enter the RNA interference pathway and thus affect the expression of CGG·CCG-repeat containing genes (Handa et al. 2003) or via their ability to activate the DNA damage response pathway (Hoem et al. 2011).
The deleterious effects of the PM mRNA may arise in the GC itself. However, the observation that the oocytes of PM mice show aberrant FMRP localization and elevated Ub raises the possibility that the oocytes may also be implicated in the PM pathology. It has been suggested that FMRP may have a normal (as yet unknown) function in the nucleus (Bagni and Greenough 2005). The increased residence time of FMRP in the nucleus in PM oocytes may be deleterious if it led to dysregulation of this function. Alternatively, because FMRP has a number of protein-binding partners, it may be that the localization of FMRP in the nucleus leads to the mislocalization of other proteins.
The elevated levels of Ub may provide clues as to what the net effect of all these changes may be. Elevated levels of Ub may reflect the reduced efficiency of the proteasomal system of protein degradation or an increased accumulation of abnormal proteins that are targeted by Ub for degradation. Because a reduced proteasome efficiency is often associated with oxidative stress, neurodegeneration, and aging (Carrard et al. 2002; Keller et al. 2004; Shang and Taylor 2011), it is tempting to speculate that the elevated Ub in PM oocytes reflects some sort of related process. However, the accumulation of abnormal proteins, perhaps a consequence of repeat-mediated sequestering of splicing factors such as Sam68, is also possible. Elevated Ub can also indicate a problem with cell signaling or DNA repair (for recent review, see Al-Hakim et al. 2010). Which scenario best describes what is happening in FXPOI remains to be seen.
In conclusion, our data suggest that FXPOI may arise from events intrinsic to the ovary that do not affect the normal establishment of the primordial follicle pool but do affect postnatal follicle viability. The problem does not seem to be at the level of specific steps in the maturation of the oocyte but may be related instead to aberrations in normal cellular metabolism that reduces overall follicle survival. Because the health of GCs is dependent on the health of oocytes and vice versa, our data raise the possibility that events in either the GCs or the oocyte, or some combination of the two, may be responsible for this reduced viability, perhaps via aberrant FMRP accumulation and/or protein folding/degradation. The fragile X PM mice we have generated should provide a useful model system for addressing these possibilities.
Acknowledgments
The authors thank Mr. Ziqiang Zhang for his technical assistance.
Footnotes
The authors declared no potential conflicts of interest with respect to the research, authorship, and/or publication of this article.
The authors disclosed receipt of the following financial support for the research, authorship, and/or publication of this article: Institutional grants to support research: Funding for this work came in part from a grant to KU from the Intramural program of the NIDDK (NIH).
References
- Abercrombie M. 1946. Estimation of nuclear population from microtome sections. Anat Rec. 94:239–247 [DOI] [PubMed] [Google Scholar]
- Al-Hakim A, Escribano-Diaz C, Landry MC, O’Donnell L, Panier S, Szilard RK, Durocher D. 2010. The ubiquitous role of ubiquitin in the DNA damage response. DNA Repair (Amst). 9:1229–1240 [DOI] [PMC free article] [PubMed] [Google Scholar]
- Arocena DG, Iwahashi CK, Won N, Beilina A, Ludwig AL, Tassone F, Schwartz PH, Hagerman PJ. 2005. Induction of inclusion formation and disruption of lamin A/C structure by premutation CGG-repeat RNA in human cultured neural cells. Hum Mol Genet. 14:3661–3671 [DOI] [PubMed] [Google Scholar]
- Bagni C, Greenough WT. 2005. From mRNP trafficking to spine dysmorphogenesis: the roots of fragile X syndrome. Nat Rev Neurosci. 6:376–387 [DOI] [PubMed] [Google Scholar]
- Bakker CE, de Diego Otero Y, Bontekoe C, Raghoe P, Luteijn T, Hoogeveen AT, Oostra BA, Willemsen R. 2000. Immunocytochemical and biochemical characterization of FMRP, FXR1P, and FXR2P in the mouse. Exp Cell Res. 258:162–170 [DOI] [PubMed] [Google Scholar]
- Berghorn KA, Le WW, Sherman TG, Hoffman GE. 2001. Suckling stimulus suppresses messenger RNA for tyrosine hydroxylase in arcuate neurons during lactation. J Comp Neurol. 438:423–432 [DOI] [PubMed] [Google Scholar]
- Bianchi E, Barbagallo F, Valeri C, Geremia R, Salustri A, De Felici M, Sette C. 2010. Ablation of the Sam68 gene impairs female fertility and gonadotropin-dependent follicle development. Hum Mol Genet. 19:4866–4894 [DOI] [PubMed] [Google Scholar]
- Brouwer JR, Severijnen E, de Jong FH, Hessl D, Hagerman RJ, Oostra BA, Willemsen R. 2008. Altered hypothalamus- pituitary-adrenal gland axis regulation in the expanded CGG-repeat mouse model for fragile X–associated tremor/ataxia syndrome. Psychoneuroendocrinology. 33:863–873 [DOI] [PMC free article] [PubMed] [Google Scholar]
- Bussani C, Papi L, Sestini R, Baldinotti F, Bucciantini S, Bruni V, Scarselli G. 2004. Premature ovarian failure and fragile X premutation: a study on 45 women. Eur J Obstet Gynecol Reprod Biol. 112:189–191 [DOI] [PubMed] [Google Scholar]
- Carlson DE, Le W, Chiu WC, Hoffman GE. 2009. Messenger RNA for neuropeptide Y in the arcuate nucleus increases in parallel with plasma adrenocorticotropin during sepsis in the rat. Neurosci Lett. 452:146–150 [DOI] [PMC free article] [PubMed] [Google Scholar]
- Carrard G, Bulteau AL, Petropoulos I, Friguet B. 2002. Impairment of proteasome structure and function in aging. Int J Biochem Cell Biol. 34:1461–1474 [DOI] [PubMed] [Google Scholar]
- Dierich A, Sairam MR, Monaco L, Fimia GM, Gansmuller A, LeMeur M, Sassone-Corsi P. 1998. Impairing follicle-stimulating hormone (FSH) signaling in vivo: targeted disruption of the FSH receptor leads to aberrant gametogenesis and hormonal imbalance. Proc Natl Acad Sci U S A. 95:13612–13617 [DOI] [PMC free article] [PubMed] [Google Scholar]
- Durlinger AL, Gruijters MJ, Kramer P, Karels B, Ingraham HA, Nachtigal MW, Uilenbroek JT, Grootegoed JA, Themmen AP. 2002. Anti-Mullerian hormone inhibits initiation of primordial follicle growth in the mouse ovary. Endocrinology. 143:1076–1084 [DOI] [PubMed] [Google Scholar]
- Entezam A, Biacsi R, Orrison B, Saha T, Hoffman GE, Grabczyk E, Nussbaum RL, Usdin K. 2007. Regional FMRP deficits and large repeat expansions into the full mutation range in a new fragile X premutation mouse model. Gene. 395:125–134 [DOI] [PMC free article] [PubMed] [Google Scholar]
- Fakhr M, Abou-salem AM, El Sayed L, El Hakim S, El Sokkary MB, El Sokkary F. 1986. Ovarian structure in cases of primary and secondary infertility. Med J Cairo Univ. 54:423–428 [PubMed] [Google Scholar]
- Feng Y, Lakkis L, Devys D, Warren ST. 1995. Quantitative comparison of FMR1 gene expression in normal and premutation alleles. Am J Hum Genet. 56:106–113 [PMC free article] [PubMed] [Google Scholar]
- Flaws JA, Hirshfield AN, Hewitt JA, Babus JK, Furth PA. 2001. Effect of bcl-2 on the primordial follicle endowment in the mouse ovary. Biol Reprod. 64:1153–1159 [DOI] [PubMed] [Google Scholar]
- Gleicher N, Weghofer A, Barad DH. 2010. Ovarian reserve determinations suggest new function of FMR1 (fragile X gene) in regulating ovarian ageing. Reprod Biomed Online. 20:768–775 [DOI] [PubMed] [Google Scholar]
- Gosden RG, Laing SC, Felicio LS, Nelson JF, Finch CE. 1983. Imminent oocyte exhaustion and reduced follicular recruitment mark the transition to acyclicity in aging C57BL/6J mice. Biol Reprod. 28:255–260 [DOI] [PubMed] [Google Scholar]
- Greco CM, Hagerman RJ, Tassone F, Chudley AE, Del Bigio MR, Jacquemont S, Leehey M, Hagerman PJ. 2002. Neuronal intranuclear inclusions in a new cerebellar tremor/ataxia syndrome among fragile X carriers. Brain. 125:1760–1771 [DOI] [PubMed] [Google Scholar]
- Hagerman RJ, Hagerman PJ. 2001. Fragile X syndrome: a model of gene-brain-behavior relationships. Mol Genet Metab. 74:89–97 [DOI] [PubMed] [Google Scholar]
- Hagerman RJ, Hall DA, Coffey S, Leehey M, Bourgeois J, Gould J, Zhang L, Seritan A, Berry-Kravis E, Olichney J, et al. 2008. Treatment of fragile X–associated tremor ataxia syndrome (FXTAS) and related neurological problems. Clin Interv Aging. 3:251–262 [DOI] [PMC free article] [PubMed] [Google Scholar]
- Handa V, Saha T, Usdin K. 2003. The fragile X syndrome repeats form RNA hairpins that do not activate the interferon-inducible protein kinase, PKR, but are cut by Dicer. Nucleic Acids Res. 31:6243–6248 [DOI] [PMC free article] [PubMed] [Google Scholar]
- Hantash FM, Goos DM, Crossley B, Anderson B, Zhang K, Sun W, Strom CM. 2011. FMR1 premutation carrier frequency in patients undergoing routine population-based carrier screening: insights into the prevalence of fragile X syndrome, fragile X– associated tremor/ataxia syndrome, and fragile X–associated primary ovarian insufficiency in the United States. Genet Med. 13:39–45 [DOI] [PubMed] [Google Scholar]
- Hashem V, Galloway JN, Mori M, Willemsen R, Oostra BA, Paylor R, Nelson DL. 2009. Ectopic expression of CGG containing mRNA is neurotoxic in mammals. Hum Mol Genet. 18:2443–2451 [DOI] [PMC free article] [PubMed] [Google Scholar]
- Hirshfield AN. 1984. Stathmokinetic analysis of granulosa cell proliferation in antral follicles of cyclic rats. Biol Reprod. 31:52–58 [DOI] [PubMed] [Google Scholar]
- Hirshfield AN. 1988. Size-frequency analysis of atresia in cycling rats. Biol Reprod. 38:1181–1188 [DOI] [PubMed] [Google Scholar]
- Hoem G, Raske CR, Garcia-Arocena D, Tassone F, Sanchez E, Ludwig AL, Iwahashi CK, Kumar M, Yang JE, Hagerman PJ. 2011. CGG-repeat length threshold for FMR1 RNA pathogenesis in a cellular model for FXTAS. Hum Mol Genet. 20:2161–2170 [DOI] [PMC free article] [PubMed] [Google Scholar]
- Jagarlamudi K, Reddy P, Adhikari D, Liu K. 2010. Genetically modified mouse models for premature ovarian failure (POF). Mol Cell Endocrinol. 315:1–10 [DOI] [PubMed] [Google Scholar]
- Jin P, Duan R, Qurashi A, Qin Y, Tian D, Rosser TC, Liu H, Feng Y, Warren ST. 2007. Pur alpha binds to rCGG repeats and modulates repeat-mediated neurodegeneration in a Drosophila model of fragile X tremor/ataxia syndrome. Neuron. 55:556–564 [DOI] [PMC free article] [PubMed] [Google Scholar]
- Jin P, Zarnescu DC, Zhang F, Pearson CE, Lucchesi JC, Moses K, Warren ST. 2003. RNA-mediated neurodegeneration caused by the fragile X premutation rCGG repeats in Drosophila. Neuron. 39:739–747 [DOI] [PubMed] [Google Scholar]
- Kaneko H, Noguchi J, Kikuchi K, Todoroki J, Hasegawa Y. 2002. Alterations in peripheral concentrations of inhibin A in cattle studied using a time-resolved immunofluorometric assay: relationship with estradiol and follicle-stimulating hormone in various reproductive conditions. Biol Reprod. 67:38–45 [DOI] [PubMed] [Google Scholar]
- Keller JN, Dimayuga E, Chen Q, Thorpe J, Gee J, Ding Q. 2004. Autophagy, proteasomes, lipofuscin, and oxidative stress in the aging brain. Int J Biochem Cell Biol. 36:2376–2391 [DOI] [PubMed] [Google Scholar]
- Kenneson A, Zhang F, Hagedorn CH, Warren ST. 2001. Reduced FMRP and increased FMR1 transcription is proportionally associated with CGG repeat number in intermediate-length and premutation carriers. Hum Mol Genet. 10:1449–1454 [DOI] [PubMed] [Google Scholar]
- Koban M, Le WW, Hoffman GE. 2006. Changes in hypothalamic corticotropin-releasing hormone, neuropeptide Y, and proopiomelanocortin gene expression during chronic rapid eye movement sleep deprivation of rats. Endocrinology. 147:421–431 [DOI] [PubMed] [Google Scholar]
- Kremer EJ, Yu S, Pritchard M, Nagaraja R, Heitz D, Lynch M, Baker E, Hyland VJ, Little RD, Wada M, et al. 1991. Isolation of a human DNA sequence which spans the fragile X. Am J Hum Genet. 49:656–661 [PMC free article] [PubMed] [Google Scholar]
- Kubar H, Jalakas M. 2002. Pathological changes in the reproductive organs of cows and heifers culled because of infertility. J Vet Med A Physiol Pathol Clin Med. 49:365–372 [DOI] [PubMed] [Google Scholar]
- Mallolas J, Duran M, Sanchez A, Jimenez D, Castellvi-Bel S, Rife M, Mila M. 2001. Implications of the FMR1 gene in menopause: study of 147 Spanish women. Menopause. 8:106–110 [DOI] [PubMed] [Google Scholar]
- Maronpot RR. 1999. Pathology of the mouse. In: Boorman G, Gaul B, eds. Ovary, Oviduct, Uterus, Cervix and Vagina. St. Louis, MO: Cache River Press [Google Scholar]
- Marozzi A, Vegetti W, Manfredini E, Tibiletti MG, Testa G, Crosignani PG, Ginelli E, Meneveri R, Dalpra L. 2000. Association between idiopathic premature ovarian failure and fragile X premutation. Hum Reprod. 15:197–202 [DOI] [PubMed] [Google Scholar]
- Mouton PR. 2002. Principles and Practices of Unbiased Stereology. Baltimore, MD: Johns Hopkins University Press [Google Scholar]
- Murray A. 2000. Premature ovarian failure and the FMR1 gene. Semin Reprod Med. 18:59–66 [DOI] [PubMed] [Google Scholar]
- Murray A, Webb J, Grimley S, Conway G, Jacobs P. 1998. Studies of FRAXA and FRAXE in women with premature ovarian failure. J Med Genet. 35:637–640 [DOI] [PMC free article] [PubMed] [Google Scholar]
- Murray A, Webb J, MacSwiney F, Shipley EL, Morton NE, Conway GS. 1999. Serum concentrations of follicle stimulating hormone May predict premature ovarian failure in FRAXA premutation women. Hum Reprod. 14:1217–1218 [DOI] [PMC free article] [PubMed] [Google Scholar]
- Nelson JF, Felicio LS, Randall PK, Sims C, Finch CE. 1982. A longitudinal study of estrous cyclicity in aging C57BL/6J mice: I. Cycle frequency, length and vaginal cytology. Biol Reprod. 27:327–339 [DOI] [PubMed] [Google Scholar]
- Primerano B, Tassone F, Hagerman RJ, Hagerman P, Amaldi F, Bagni C. 2002. Reduced FMR1 mRNA translation efficiency in fragile X patients with premutations. RNA. 8:1482–1488 [PMC free article] [PubMed] [Google Scholar]
- Rankin T, Dean J. 2000. The zona pellucida: using molecular genetics to study the mammalian egg coat. Rev Reprod. 5:114–121 [DOI] [PubMed] [Google Scholar]
- Robker RL, Richards JS. 1998. Hormone-induced proliferation and differentiation of granulosa cells: a coordinated balance of the cell cycle regulators cyclin D2 and p27Kip1. Mol Endocrinol. 12:924–940 [DOI] [PubMed] [Google Scholar]
- Sellier C, Rau F, Liu Y, Tassone F, Hukema RK, Gattoni R, Schneider A, Richard S, Willemsen R, Elliott DJ, et al. 2010. Sam68 sequestration and partial loss of function are associated with splicing alterations in FXTAS patients. EMBO J. 29:1248–1261 [DOI] [PMC free article] [PubMed] [Google Scholar]
- Shang F, Taylor A. 2011. Ubiquitin-proteasome pathway and cellular responses to oxidative stress. Free Radic Biol Med. 51:5–16 [DOI] [PMC free article] [PubMed] [Google Scholar]
- Sherman SL. 2000. Premature ovarian failure in the fragile X syndrome. Am J Med Genet. 97:189–194 [DOI] [PubMed] [Google Scholar]
- Sofola OA, Jin P, Qin Y, Duan R, Liu H, de Haro M, Nelson DL, Botas J. 2007. RNA-binding proteins hnRNP A2/B1 and CUGBP1 suppress fragile X CGG premutation repeat-induced neurodegeneration in a Drosophila model of FXTAS. Neuron. 55:565–571 [DOI] [PMC free article] [PubMed] [Google Scholar]
- Snowdon DA, Kane RL, Beeson WL, Burke GL, Sprafka JM, Potter J, Iso H, Jacobs DR, Jr, Phillips RL. 1989. Is early natural menopause a biologic marker of health and aging? Am J Public Health. 79:709–714 [DOI] [PMC free article] [PubMed] [Google Scholar]
- Spath MA, Feuth TB, Smits AP, Yntema HG, Braat DD, Thomas CM, van Kessel AG, Sherman SL, Allen EG. 2011. Predictors and risk model development for menopausal age in fragile X premutation carriers. Genet Med. 13:643–650 [DOI] [PMC free article] [PubMed] [Google Scholar]
- Spath MA, Nillesen WN, Smits AP, Feuth TB, Braat DD, van Kessel AG, Yntema HG. 2010. X chromosome inactivation does not define the development of premature ovarian failure in fragile X premutation carriers. Am J Med Genet A. 152A: 387–393 [DOI] [PubMed] [Google Scholar]
- Tassone F, Hagerman RJ, Taylor AK, Mills JB, Harris SW, Gane LW, Hagerman PJ. 2000. Clinical involvement and protein expression in individuals with the FMR1 premutation. Am J Med Genet. 91:144–152 [DOI] [PubMed] [Google Scholar]
- Toledano-Alhadef H, Basel-Vanagaite L, Magal N, Davidov B, Ehrlich S, Drasinover V, Taub E, Halpern GJ, Ginott N, Shohat M. 2001. Fragile-X carrier screening and the prevalence of premutation and full-mutation carriers in Israel. Am J Hum Genet. 69:351–360 [DOI] [PMC free article] [PubMed] [Google Scholar]
- Verkerk AJ, Pieretti M, Sutcliffe JS, Fu YH, Kuhl DP, Pizzuti A, Reiner O, Richards S, Victoria MF, Zhang FP, et al. 1991. Identification of a gene (FMR-1) containing a CGG repeat coincident with a breakpoint cluster region exhibiting length variation in fragile X syndrome. Cell. 65:905–914 [DOI] [PubMed] [Google Scholar]
- Vianna-Morgante AM. 1999. Twinning and premature ovarian failure in premutation fragile X carriers. Am J Med Genet. 83:326. [DOI] [PubMed] [Google Scholar]
- Vianna-Morgante AM, Costa SS, Pares AS, Verreschi IT. 1996. FRAXA premutation associated with premature ovarian failure. Am J Med Genet. 64:373–375 [DOI] [PubMed] [Google Scholar]
- Watson RE, Wiegand SJ, Clough RW, Hoffman GE. 1986. Use of cryoprotectant to maintain long-term peptide immunoreactivity and tissue morphology. Peptides. 7:155–159 [DOI] [PubMed] [Google Scholar]
- Welt CK, Smith PC, Taylor AE. 2004. Evidence of early ovarian aging in fragile X premutation carriers. J Clin Endocrinol Metab. 89:4569–4574 [DOI] [PubMed] [Google Scholar]
- Willemsen R, Hoogeveen-Westerveld M, Reis S, Holstege J, Severijnen LA, Nieuwenhuizen IM, Schrier M, van Unen L, Tassone F, Hoogeveen AT, et al. 2003. The FMR1 CGG repeat mouse displays ubiquitin-positive intranuclear neuronal inclusions; implications for the cerebellar tremor/ataxia syndrome. Hum Mol Genet. 12:949–959 [DOI] [PubMed] [Google Scholar]
- Winans SS, Powers JB. 1977. Olfactory and vomeronasal deafferentation of male hamsters: histological and behavioral analyses. Brain Res. 126:325–344 [DOI] [PubMed] [Google Scholar]