


Abstract
We have developed a web server, PRince, which analyzes the structural features and physicochemical properties of the protein–RNA interface. Users need to submit a PDB file containing the atomic coordinates of both the protein and the RNA molecules in complex form (in ‘.pdb’ format). They should also mention the chain identifiers of interacting protein and RNA molecules. The size of the protein–RNA interface is estimated by measuring the solvent accessible surface area buried in contact. For a given protein–RNA complex, PRince calculates structural, physicochemical and hydration properties of the interacting surfaces. All these parameters generated by the server are presented in a tabular format. The interacting surfaces can also be visualized with software plug-in like Jmol. In addition, the output files containing the list of the atomic coordinates of the interacting protein, RNA and interface water molecules can be downloaded. The parameters generated by PRince are novel, and users can correlate them with the experimentally determined biophysical and biochemical parameters for better understanding the specificity of the protein–RNA recognition process. This server will be continuously upgraded to include more parameters. PRince is publicly accessible and free for use. Available at http://www.facweb.iitkgp.ernet.in/~rbahadur/prince/home.html.
INTRODUCTION
Protein–RNA interaction is ubiquitous in many cellular processes. The interaction is specific in nature, and non-specific interaction can lead to malfunction of the cell. Interfaces formed by interactions between protein and RNA molecules provide context for understanding the principles of molecular recognition in vivo. Over the last few decades, remarkable progress has been made in understanding the structural and the functional aspect of the protein–RNA interactions from their three-dimensional atomic structures (1–8). The ever expanding Protein Data Bank (PDB) (9), which is the central repository of structural information of the macromolecules and their complexes, also helps in such understanding. Concurrently, there have been attempts to analyze the structural geometry and physicochemical properties of the interfaces using a number of parameters based on the features of the interacting surfaces (10–20). These analyses have been further extended to develop softwares or web servers or both for automatic calculations of these parameters (21–23). Some of these softwares and web servers are used in the prediction of RNA binding sites in proteins (24–29). Nevertheless, in spite of all these developments, our understanding of the protein–RNA recognition process is still not adequate enough to explain the structural basis of the conformational changes during the recognition processes (30), mechanism of sequence specific recognition (31–33), as well as the prediction of protein–RNA complexes through the docking methods (34–36).
In recent years, we have developed several parameters based on the geometric structure and physicochemical properties of the interacting surfaces in biomolecules (37). We have also studied the hydration pattern of the interfaces, and developed parameters to investigate the role of interface water molecules in the recognition process (38). All these parameters are useful in understanding the structural specificity of the recognition process in protein–protein complexes, and are extensively used in discriminating the specific protein–protein interfaces from the non-specific ones (39–42). They have also been successfully used to understand the specific recognition of the RNA molecules on the protein surface, suggesting that the protein–RNA recognition process involves elements of shape recognition as well as electrostatic interaction and the recognition of the base sequence (5,19). In order to calculate all these interface parameters for a given protein–RNA complex, we have automatized the method and implemented it into a web server named PRince (Protein-RNA interface; http://www.facweb.iitkgp.ernet.in/~rbahadur/prince/home.html). This article describes the development of the web server PRince.
PROGRAM DESCRIPTION
Input file and format
This server allows the users to submit a protein–RNA complex file or a dataset of protein–RNA complexes in the PDB format containing the protein and the RNA chains. Users must also indicate the chain identifiers for each of the protein and the RNA unit (a maximum of eight protein chains and eight RNA chains are allowed). The server can handle up to 20 000 atoms for each of the protein and the RNA chain. The detailed information about the user submitted PDB files and chain identifiers for the protein and the RNA will be displayed on the server page once the calculations are completed.
Output files and parameters
The server generates four types of output files in PDB format: (i) list of the interface amino acids with their atomic coordinates (1DFU_P.int); (ii) list of the interface nucleotides with their atomic coordinates (1DFU_R.int); (iii) list of the interface atoms on the surface of the interacting protein–RNA complex (1DFU_int.pdb); (iv) list of the interface water molecules along with the interface protein and RNA atoms (1DFU_wat.int). In all these files, 1DFU, the PDB identifier for a given protein–RNA complex, has been used as an example. These files do not contain occupancy factor and B-factor columns; instead they have three columns, in which the solvent accessible surface areas (SASAs) of the constituent atoms in the individual subunit, in the complex and their difference, are provided. Users can download these output files for further calculations; for example, to calculate the interface area contributed by individual residues, or to find out the important water molecules at the binding surface. In addition, they can also display these files by Jmol plugin. Figure 1 shows interface atoms, surface atoms and interface water molecules for the protein and the RNA subunits involved in a complex formed by ribosomal protein L25 and 5S rRNA fragment (PDB id 1DFU). Beside these downloadable files, the server also generates a downloadable table with the statistics of the interface parameters (1DFU_param.txt), which are discussed below.
Figure 1.

Graphical representation of the protein-RNA interface formed by ribosomal protein L25 and 5S rRNA fragment (PDB id, 1DFU). (A) Interface region along with the water molecules. Atoms belong to protein, RNA and interface water molecules are colored blue, red and cyan, respectively. (B) Surface region of the protein and RNA are colored in blue and red, respectively, while their interface region is colored in green.
Statistics of the interface parameters
The size of the protein-RNA interface is estimated by calculating the interface area (B). It is calculated in terms of the SASA of the protein and the RNA molecules and is given by the following equation
| (1) |
SASAprotein and SASARNA are the SASA of two interacting molecules and SASAcomplex is the same of the complex. The interface area B is the area of the protein and the RNA solvent accessible surfaces that becomes buried when two molecules associate. The SASA values are calculated from the atomic coordinates by rolling a solvent probe (with the radius of a water molecule) over the surfaces of the protein and the RNA molecules using the program NACCESS (43), which implements the Lee and Richards (44) algorithm. All the atoms (belongs to amino acid residues and nucleotides) that loose solvent accessibility in the complex and contribute to B are considered as interface atoms. The ratio of the interface area to the rest of the surface area is calculated for the individual protein and RNA molecules as well as for the whole complex.
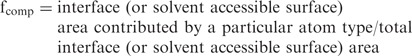
The chemical composition of the interface or the solvent accessible surface is estimated by measuring the contribution of the different atom types to the respective interface area and solvent accessible surface area (SASA), and is calculated by the following equation:
 |
(2) |
The composition is divided into four different types: (i) nonpolar, (ii) neutral polar, (iii) negatively charged and (iv) positively charged. At the protein surface, all the carbon-containing groups are considered as nonpolar; O, N and S are considered as neutral polar; N is positively charged in Arg/Lys side chains; O is negatively charged in Asp/Glu side chains. At the RNA surface, all the carbon-containing groups are considered as non-polar; N and O are neutral polar except O1P and O2P, which are considered as negatively charged (19).
Depending on their spatial distribution, the interface atoms can be divided into two different categories. Those which are not accessible by any solvent molecules are called fully buried interface atoms, and those which are partly accessible to solvent molecules are called partially buried interface atoms (39). The atomic packing of the interface is quantified by the following equation
| (3) |
This fraction will be higher for a closely packed interface compared to a loosely packed interface.
Local atomic density (LD) index is used to measure the overall density of the interface as described by Bahadur et al. (39). In brief, for each interface atom i, the number ni of the interface atoms that are within a distance 12 Å of atom i in the same subunit is counted. LD is the average of ni over all N interface atoms and is given by the following equation
| (4) |
LD measures the packing density at each point of the interface.
Polar interactions made by the amino acids and the nucleotides are expressed by the intermolecular hydrogen bonds (H-bonds) between protein and RNA. Water molecules at the interface play an important role in stabilizing the protein-RNA interface by making polar interactions. A water molecule is selected as interface water if it is within 4.5 Å distance from at least one atom of both protein and RNA chains (38). Direct protein–RNA intermolecular H-bonds as well as water mediated H-bonds across the interface are calculated by the program HBPLUS with default parameters (45). All these interface parameters generated by the server for a protein–RNA complex formed by ribosomal protein L25 and 5S rRNA fragment (PDB id, 1DFU) are given in Table 1.
Table 1.
Interface parameters for a protein–RNA complex formed by ribosomal protein L25 and 5S rRNA fragment (PDB id, 1DFU)
| Parameters | Protein | RNA | Complex |
|---|---|---|---|
| Interface area B (Å2) | 828.2 | 859.7 | 1687.9 |
| Surface area buried (%) | 14.0 | 12.0 | 14.8 |
| Number of interface | |||
| Atoms | 84 | 88 | 172 |
| Amino acids | 26 | – | 26 |
| Nucleotides | – | 19 | 19 |
| B (Å2) per | |||
| Amino acid | 31.9 | – | 31.9 |
| Nucleotide | – | 45.2 | 45.2 |
| Fraction of buried atoms | 0.30 | 0.32 | 0.31 |
| Local density | 41 | 39 | 40 |
| Interface compositiona | |||
| Nonpolar | 47.4 | 21.3 | 34.1 |
| Neutral polar | 23.2 | 45.1 | 34.4 |
| Negatively charged | 4.7 | 33.7 | 19.4 |
| Positively charged | 24.7 | – | 12.1 |
| Surface compositiona | |||
| Nonpolar | 55.3 | 28.7 | 40.5 |
| Neutral polar | 25.4 | 43.6 | 35.6 |
| Negatively charged | 9.7 | 27.7 | 19.7 |
| Positively charged | 9.5 | – | 4.2 |
| Water molecules | |||
| Number per interface | – | – | 49 |
| Number per 1000 Å2 | – | – | 29 |
| Bridging waterb | – | – | 10 |
| Hydrogen bonds | |||
| Protein–RNA | |||
| Number per interface | – | – | 17 |
| Number per 1000 Å2 | – | – | 10.1 |
| Water–Protein | |||
| Number per interface | – | – | 21 |
| Number per 1000 Å2 | – | – | 12.40 |
| Water–RNA | |||
| Number per interface | – | – | 71 |
| Number per 1000 Å2 | – | – | 42.1 |
aPercentage compositions are calculated using Equation (2) described in the text.
bThe bridging waters are identified as those interface waters making H-bond with both protein and RNA atoms.
PROGRAM IMPLEMENTATION
The server runs on a 3.0 GHz Xeon processor with Linux operating system. The programs for calculating the parameters are written in ‘C’ programming language and the web interface has been developed using Javascript and PHP. The server generally takes 30 s to print the output data for an average size protein–RNA complex, and it can take around a minute for a large complex. Users must install a java plugin or Java Runtime Environment (JRE) for the browser to view the 3D structures of the interfaces in Jmol. This web server is best viewed in Mozilla Firefox, Google Chrome, Safari or Opera, and it may run slow on the older versions of Internet Explorer. In addition, we have provided a non-redundant dataset of 81 protein–RNA complexes and their interfaces compiled by Bahadur et al. (19), which can be downloaded from this server website.
CONCLUSION
We have developed a web server PRince, to analyze the structural and physicochemical properties of the protein-RNA interfaces. Users can submit a protein–RNA complex file with a list of interacting protein and RNA chains. The server generates several parameters describing the structural specificity of the interaction. These parameters could be used for further analysis, and users can correlate them with the experimentally determined biophysical and biochemical parameters for better understanding the specificity of the protein–RNA recognition process. This server will be continuously upgraded to include more parameters. PRince is free and open to all and there is no login requirement for the users.
FUNDING
Sponsored Research and Industrial Consultancy (SRIC) of IIT Kharagpur, India. Funding for open access charge: Waived by Oxford University Press.
Conflict of interest statement. None declared.
ACKNOWLEDGEMENTS
A.B. is thankful to IIT Kharagpur for her fellowship. R.P.B. acknowledges a start up grant from ISIRD, SRIC, IIT Kharagpur. The web server is hosted at the Computer Information Center in IIT Kharagpur.
REFERENCES
- 1.Cusack S. RNA-protein complexes. Curr. Opin. Struct. Biol. 1999;9:66–73. doi: 10.1016/s0959-440x(99)80009-8. [DOI] [PubMed] [Google Scholar]
- 2.Draper DE. Themes in RNA-protein recognition. J. Mol. Biol. 1999;293:255–270. doi: 10.1006/jmbi.1999.2991. [DOI] [PubMed] [Google Scholar]
- 3.Jones S, Daley D, Luscombe N, Berman HM, Thornton JM. Protein–RNA interactions: a structural analysis. Nucleic Acids Res. 2001;29:943–954. doi: 10.1093/nar/29.4.943. [DOI] [PMC free article] [PubMed] [Google Scholar]
- 4.Chen Y, Varani G. Protein families and RNA recognition. FEBS J. 2005;272:2088–2097. doi: 10.1111/j.1742-4658.2005.04650.x. [DOI] [PubMed] [Google Scholar]
- 5.Janin J, Bahadur RP. The structural basis of protein-nucleic acid recognition. Cell. Mol. Bioeng. 2008;1:327–338. [Google Scholar]
- 6.Puton T, Kozlowski L, Tuszynska I, Rother K, Bujnicki JM. Computational methods for prediction of protein-RNA interactions. J. Struct. Biol. 2011 doi: 10.1016/j.jsb.2011.10.001. October 12 (doi:10.1016/j.jsb.2011.10.001; epub ahead of print) [DOI] [PubMed] [Google Scholar]
- 7.Zhao H, Yang Y, Zhou Y. Structure-based prediction of RNA-binding domains and RNA-binding sites and application to structural genomics targets. Nucleic Acids Res. 2011;39:3017–3025. doi: 10.1093/nar/gkq1266. [DOI] [PMC free article] [PubMed] [Google Scholar]
- 8.Iwakiri J, Tateishi H, Chakraborty A, Patil P, Kenmochi N. Dissecting the protein-RNA interface: the role of protein surface shapes and RNA secondary structures in protein-RNA recognition. Nucleic Acids Res. 2012;40:3299–3306. doi: 10.1093/nar/gkr1225. [DOI] [PMC free article] [PubMed] [Google Scholar]
- 9.Berman HM, Battistuz T, Bhat TN, Bluhm WF, Bourne PE, Burkhardt K, Feng Z, Gilliland GL, Iype L, Jain S, et al. The Protein Data Bank. Acta Crystallogr Sect. 2002;D58:899–907. doi: 10.1107/s0907444902003451. [DOI] [PubMed] [Google Scholar]
- 10.Lustig B, Arora S, Jernigan RL. RNA base–amino acid interaction strengths derived from structures and sequences. Nucleic Acids Res. 1997;25:2562–2565. doi: 10.1093/nar/25.13.2562. [DOI] [PMC free article] [PubMed] [Google Scholar]
- 11.Nadassy K, Wodak S, Janin J. Structural features of protein–nucleic acid recognition sites. Biochemistry. 1999;38:1999–2017. doi: 10.1021/bi982362d. [DOI] [PubMed] [Google Scholar]
- 12.Allers J, Shamoo Y. Structure-based analysis of protein-RNA interactions using the program ENTANGLE. J. Mol. Biol. 2001;311:75–86. doi: 10.1006/jmbi.2001.4857. [DOI] [PubMed] [Google Scholar]
- 13.Treger M, Westhof E. Statistical analysis of atomic contacts at RNA-protein interfaces. J. Mol. Recogn. 2001;14:199–214. doi: 10.1002/jmr.534. [DOI] [PubMed] [Google Scholar]
- 14.Chen Y, Kortemme T, Robertson T, Baker D, Varani G. A new hydrogen-bonding potential for the design of protein–RNA interactions predicts specific contacts and discriminates decoys. Nucleic Acids Res. 2004;32:5147–5162. doi: 10.1093/nar/gkh785. [DOI] [PMC free article] [PubMed] [Google Scholar]
- 15.Morozova N, Allers J, Myers J, Shamoo Y. Protein-RNA interactions: exploring binding patterns with a three-dimensional superposition analysis of high resolution structures. Bioinformatics. 2006;22:2746–2752. doi: 10.1093/bioinformatics/btl470. [DOI] [PubMed] [Google Scholar]
- 16.Baker CM, Grant GH. Role of aromatic amino acids in protein-nucleic acid recognition. Biopolymers. 2007;85:456–470. doi: 10.1002/bip.20682. [DOI] [PubMed] [Google Scholar]
- 17.Ellis JJ, Broom M, Jones S. Protein–RNA interactions: structural analysis and functional classes. Proteins. 2007;66:903–991. doi: 10.1002/prot.21211. [DOI] [PubMed] [Google Scholar]
- 18.Zheng S, Robertson TA, Varani G. A knowledge-based potential function predicts the specificity and relative binding energy of RNA-binding proteins. FEBS J. 2007;274:6378–6391. doi: 10.1111/j.1742-4658.2007.06155.x. [DOI] [PubMed] [Google Scholar]
- 19.Bahadur RP, Zacharias M, Janin J. Dissecting protein–RNA recognition sites. Nucleic Acids Res. 2008;36:2705–2716. doi: 10.1093/nar/gkn102. [DOI] [PMC free article] [PubMed] [Google Scholar]
- 20.Biswas S, Guharoy M, Chakrabarti P. Structural segments and residue propensities in protein-RNA interfaces: comparison with protein-protein and protein-DNA complexes. Bioinformation. 2008;2:422–427. doi: 10.6026/97320630002422. [DOI] [PMC free article] [PubMed] [Google Scholar]
- 21.Terribilini M, Sander JD, Lee JH, Zaback P, Jernigan RL, Honavar V, Dobbs D. RNABindR: a server for analyzing and predicting RNA-binding sites in proteins. Nucleic Acids Res. 2007;35:W578–W584. doi: 10.1093/nar/gkm294. [DOI] [PMC free article] [PubMed] [Google Scholar]
- 22.Shulman-Peleg A, Nussinov R, Wolfson HJ. RsiteDB: a database of protein binding pockets that interact with RNA nucleotide bases. Nucleic Acids Res. 2009;37:D369–D373. doi: 10.1093/nar/gkn759. [DOI] [PMC free article] [PubMed] [Google Scholar]
- 23.Murakami Y, Spriggs RV, Nakamura H, Jones S. PiRaNhA: a server for the computational prediction of RNA-binding residues in protein sequences. Nucleic Acids Res. 2010;38:W412–W416. doi: 10.1093/nar/gkq474. [DOI] [PMC free article] [PubMed] [Google Scholar]
- 24.Kim OT, Yura K, Go N. Amino acid residue doublet propensity in the protein-RNA interface and the application to RNA interface prediction. Nucleic Acids Res. 2006;34:6450–6460. doi: 10.1093/nar/gkl819. [DOI] [PMC free article] [PubMed] [Google Scholar]
- 25.Kumar M, Gromiha MM, Raghava GP. Prediction of RNA binding sites in a protein using SVM and PSSM profile. Proteins. 2008;71:189–194. doi: 10.1002/prot.21677. [DOI] [PubMed] [Google Scholar]
- 26.Shazman S, Mandel-Gutfreund Y. Classifying RNA-binding proteins based on electrostatic properties. PLoS Comp. Biol. 2008;4:e1000146. doi: 10.1371/journal.pcbi.1000146. [DOI] [PMC free article] [PubMed] [Google Scholar]
- 27.Shulman-Peleg A, Shatsky M, Nussinov R, Wolfson HJ. Prediction of interacting single-stranded RNA bases by protein binding patterns. J. Mol. Biol. 2008;379:299–316. doi: 10.1016/j.jmb.2008.03.043. [DOI] [PMC free article] [PubMed] [Google Scholar]
- 28.Spriggs RV, Jones S. RNA-binding residues in sequence space: Conservation and interaction patterns. Compu. Biol. Chem. 2009;33:397–403. doi: 10.1016/j.compbiolchem.2009.07.012. [DOI] [PubMed] [Google Scholar]
- 29.Perez-Cano L, Fernandez-Recio J. Optimal protein-RNA area, OPRA: a propensity-based method to identify RNA-binding sites on proteins. Proteins. 2010;78:25–35. doi: 10.1002/prot.22527. [DOI] [PubMed] [Google Scholar]
- 30.Ellis JJ, Jones S. Evaluating conformational changes in protein structures binding RNA. Proteins. 2008;70:1518–1526. doi: 10.1002/prot.21647. [DOI] [PubMed] [Google Scholar]
- 31.Seeman NC, Rosenberg JM, Rich A. Sequence-specific recognition of double helical nucleic acids by proteins. Proc. Natl Acad. Sci. USA. 1976;73:804–808. doi: 10.1073/pnas.73.3.804. [DOI] [PMC free article] [PubMed] [Google Scholar]
- 32.Auweter SD, Oberstrass FC, Allain FHT. Sequence-specific binding of single-stranded RNA: is there a code for recognition? Nucleic Acids Res. 2006;34:4943–4959. doi: 10.1093/nar/gkl620. [DOI] [PMC free article] [PubMed] [Google Scholar]
- 33.Gupta A, Gribskov M. The role of RNA sequence and structure in RNA–protein interactions. J. Mol. Biol. 2011;409:574–587. doi: 10.1016/j.jmb.2011.04.007. [DOI] [PubMed] [Google Scholar]
- 34.Janin J. The targets of CAPRI Rounds 13-19. Proteins. 2010;78:3067–3072. doi: 10.1002/prot.22774. [DOI] [PubMed] [Google Scholar]
- 35.Setny P, Zacharias M. A coarse-grained force field for protein-RNA docking. Nucleic Acids Res. 2011;39:9118–9129. doi: 10.1093/nar/gkr636. [DOI] [PMC free article] [PubMed] [Google Scholar]
- 36.Barik A, Nithin C, Manasa P, Bahadur RP. A protein-RNA docking benchmark (I): non-redundant cases. Proteins. 2012;80:1866–1871. doi: 10.1002/prot.24083. [DOI] [PubMed] [Google Scholar]
- 37.Janin J, Bahadur RP, Chakrabarti P. Protein-protein interaction and quaternary structure. Q. Rev. Biophys. 2008;41:133–180. doi: 10.1017/S0033583508004708. [DOI] [PubMed] [Google Scholar]
- 38.Rodier F, Bahadur RP, Chakrabarti P, Janin J. Hydration of protein-protein interfaces. Proteins. 2005;60:36–45. doi: 10.1002/prot.20478. [DOI] [PubMed] [Google Scholar]
- 39.Bahadur RP, Chakrabarti P, Rodier F, Janin J. A dissection of specific and non-specific protein-protein interfaces. J. Mol. Biol. 2004;336:943–955. doi: 10.1016/j.jmb.2003.12.073. [DOI] [PubMed] [Google Scholar]
- 40.Saha RP, Bahadur RP, Chakrabarti P. Interresidue contacts in proteins and protein-protein interfaces and their use in characterizing the homodimeric interface. J. Proteom. Res. 2005;4:1600–1609. doi: 10.1021/pr050118k. [DOI] [PubMed] [Google Scholar]
- 41.Bahadur RP, Zacharias M. The interface of protein-protein complexes: analysis of contacts and prediction of interactions. Cell. Mol. Life Sci. 2008;65:1059–1072. doi: 10.1007/s00018-007-7451-x. [DOI] [PMC free article] [PubMed] [Google Scholar]
- 42.Bernauer J, Bahadur RP, Rodier F, Janin J, Poupon A. DiMoVo: a Voronoi tessellation-based method for discriminating crystallographic and biological protein-protein interactions. Bioinformatics. 2008;24:652–658. doi: 10.1093/bioinformatics/btn022. [DOI] [PubMed] [Google Scholar]
- 43.Hubbard SJ. NACCESS: Program for Calculating Accessibilities. London, UK: Department of Biochemistry and Molecular Biology, University College of London; 1992. [Google Scholar]
- 44.Lee B, Richards FM. The interpretation of protein structures: estimation of static accessibility. J. Mol. Biol. 1971;55:379–400. doi: 10.1016/0022-2836(71)90324-x. [DOI] [PubMed] [Google Scholar]
- 45.McDonald I, Thornton JM. Satisfying hydrogen bonding potential in proteins. J. Mol. Biol. 1994;238:777–793. doi: 10.1006/jmbi.1994.1334. [DOI] [PubMed] [Google Scholar]