Abstract
Rationale
Bilins are metabolic products of hosts and bacteria on porphyrins, and are markers of health state and human waste contamination. Although bilin tandem mass spectrometry reports exist, their fragmentation behavior as a function of structure has not been compared, nor has fragmentation been examined as a function of collision energy. Methods: The fragmentation of bilins generated by positive ion mode electrospray ionization is examined by collision induced dissociation (CID). CID on a quadrupole ion trap and on a Fourier transform ion cyclotron resonance (FT-ICR) mass spectrometer as a function of collision energy is compared. Methyl esterification was used to deduce which product ions contain the inner pyrrole rings. FT-ICR high mass accuracy measurements were used to determine the formulas of the resultant product ions.
Results
The central carbon’s bonding to the inner pyrrole rings influences fragmentation. Bilirubin is unique because fragmentation adjacent to the central methylene group between innermost rings predominates, and loss of a terminal pyrrole is observed only with helium collision gas. The other bilins lose the terminal pyrroles first; as CID energy is increased, additional fragmentation due to neutral losses of small molecules such as H2O, CO, CO2, and methanol occurs.
Conclusions
Based on these observations, fragmentation schemes for the bilins are proposed that are strongly dependent on the molecular structure and collision energy; only bilirubin fragmentation is influenced significantly by the collision gas used. This report should have value in identification of this class of molecules for biomarker detection.
Bilins are a class of biological molecules found in numerous organisms, and consist of a linear arrangement of four pyrrole rings (tetrapyrroles). Bilins are metabolic products of porphyrins.[1] Bilirubin is perhaps the most well-known member of the bilin family. In humans, bilirubin is a product of the breakdown of heme.[1] Bilirubin has long been recognized for its clinical significance as a jaundice biomarker in newborns.[2] A thorough epidemiological study of all children born at term in Denmark between 1994 and 2004 associates increased risk of infantile autism with neonatal jaundice, suggesting a potential link between early bilirubin exposure and autism.[3] A systematic review recently supported this association between total serum bilirubin and development of autism in full-term infants.[4] Recent evidence has revealed that bilirubin is not only found in mammals, but in plant species as well.[5,6]
Interest in bilins has grown due to their possible utility as urinary biomarkers.[7]The tetrapyrroles D-urobilinogen, D-urobilin, mesobilirubinogen, i-urobilin, L-stercobilinogen, and L-stercobilin are natural products produced by action of gut flora [8,9] on bilirubin glucuronides. In addition to having diagnostic value in the health state of an individual, bilins can also serve as convenient markers to evaluate contamination in the environment. Since bilirubin and its metabolites are present in human excrement, their presence in water or soil samples is an indication of human waste contamination.[10] While bilin structures and natural synthesis have been determined[1,11,12,13],and electron ionization mass spectra recorded for several bilins[14,15], there are limited reports of tandem MS fragmentation behavior for any of the bilins, and only some of the product ions have been identified.[5,10]
Motivated by these factors and our own discovery that L-stercobilin depletion may be a metabolic marker of autistic spectrum disorders (ASD) [16], we conducted an investigation of the fragmentation behavior of bilins under collision induced dissociation (CID) conditions as a function of collision energy, collision gas, and mass analyzer. In our experiments, positive ions of several bilins were generated by electrospray ionization (ESI), and CID studies conducted on both quadrupole ion trap and Fourier transform ion cyclotron resonance (FT-ICR) mass analyzers. To deduce the structures of the product ions, two strategies were employed. One strategy utilized derivatization of the bilins’ carboxylic acid groups into methyl esters, thereby identifying which product ions contained the middle two pyrrole rings. The other strategy utilized the high mass accuracy of FT-ICR to deduce the elemental composition of the product ions generated. Using these approaches, fragmentation schemes are proposed for each of these bilin tetrapyrroles. This is the first tandem mass spectrometry study of bilins that has examined not only how subtle changes in tetrapyrrole connectivity alters fragmentation behavior, but also how collision energy, collision gas, and the features of two different trapping mass analyzers can be utilized to obtain detailed structural information, which will be valuable for future biomarker studies of these important metabolites.
EXPERIMENTAL
Materials
Urobilin and stercobilin were obtained as their hydrochloride salts (Frontier Scientific, Logan, UT), and they and their dimethyl esters were dissolved in 50/50 methanol/water (HPLC grade) for analysis byESI. Bilirubin (Sigma Aldrich, St. Louis, MO) was dissolved in pure acetonitrile or 1:1 acetonitrile/5 mM ammonium acetate in water prior to ESI. Urobilin, stercobilin, and their dimethyl esters were stored in water at 4oC; bilirubin was stored at room temperature. Acetyl chloride was obtained from Sigma Aldrich (St. Louis, MO) and was stored under nitrogen to prevent it from hydrolyzing.
Methyl-Esterification of Urobilin and Stercobilin
Methyl-esterification of the carboxyl groups on urobilin and stercobilin was achieved by dissolving 10μg in 500μL freshly made methanol HCl at room temperature for two hours.[17] Methanolic HCl was produced by combining 160μL acetyl chloride with 1mL of anhydrous methanol.
ESI Tandem Mass Spectrometry
ESI tandem mass spectrometry was conducted on two different instruments. At low resolution, ESI was performed at a flow rate of 2.5 μL/min followed by CID using a Thermo Electron LCQ Advantage mass spectrometer (San Jose, CA).Multiple collision induced dissociation (CID) spectra were obtained for each species over m/z 100-1000 at variable collision energies via use of helium as the collision gas (30-70% of the resonance ejection energy). For high-resolution studies, CID was performed in the external source of a 12 tesla Bruker Daltonics SolariX Fourier transform ion cyclotron resonance (FT-ICR) mass spectrometer (Billerica, MA). In this instrument, precursor ions generated by ESI (flow rate = 2 μL/min) were mass-selected in the front-end quadrupole, and then CID was performed in the adjacent RF-only hexapole in the presence of argon as the collision gas; variable collision energies were obtained by application of the corresponding DC voltage (10-50V for bilirubin, 30-70V for urobilin and stercobilin). For FT-ICR, mass spectra were collected over m/z 150-2000, and 2 MWord data sets were zero-filled once prior to Fourier transformation, then processed and displayed in magnitude-mode.
RESULTS AND DISCUSSION
ESI-MS/MS of Bilirubin
A full scan ESI ion trap mass spectrum of the unpurified bilirubin (C33H36N4O6) mixture indicates detection of (M+H)+ at 585 Da, and (M+Na)+ at 607 Da (Supplementary Data Figure S-1a). A number of other ions are also detected, mostly notably the peak at m/z 299 which is likely a fragment ion of bilirubin produced in the ESI source, as this peak has been observed in CID mass spectra of bilirubin and is observed in our CID results (discussed below).[5,6] The (M+H)+ of bilirubin was isolated and CID mass spectra were collected over a range of dissociation energies; CID mass spectra obtained at RF resonance ejection voltage settings of 30% and 70% are shown in Supplementary Figure S-1b and S-1c, respectively. In both cases, the most intense peak present is that at m/z 299, which was also reported in published CID mass spectra of bilirubin.[5,6] At 30% resonance ejection voltage, the other major product ions observed are at m/z 566, 462, and 297. Although the structural nature of these product ions has not been discussed in the literature,[5,6] the peaks at m/z 566 and 297 have been detected (and we believe m/z 462, based on inspection of the mass spectrum) in the CID mass spectra reported by Pirone et al.[5,6] Increasing the CID energy to 70% resonance ejection voltage produces almost exclusively the m/z 462, 299, and 297 ions.
With the availability of a high-resolution ESI FT-ICR, we posited that many of these product ions would be identified based on accurate mass measurements. Because of the low precursor ion signal yield in positive ion trap ESI for bilirubin, a 1:1 acetonitrile/water (5 mM ammonium acetate) was used for ESI FT-ICR in an effort improve overall precursor ion yield. The positive ion ESI FT-ICR mass spectrum (not shown) generates both the (M+H)+ and (M+Na)+ ions for bilirubin, confirmed by the measured exact masses of 585.270320 Da (theoretical 585.270761 Da, −0.8 ppm error) and 607.252077 Da (theoretical 607.252706 Da, −1.0 ppm error), respectively. In addition, the peak at 629.233859 Da was confirmed as the (M+2Na−H)+ ion for bilirubin (theoretical 629.234651, −1.3 ppm error).
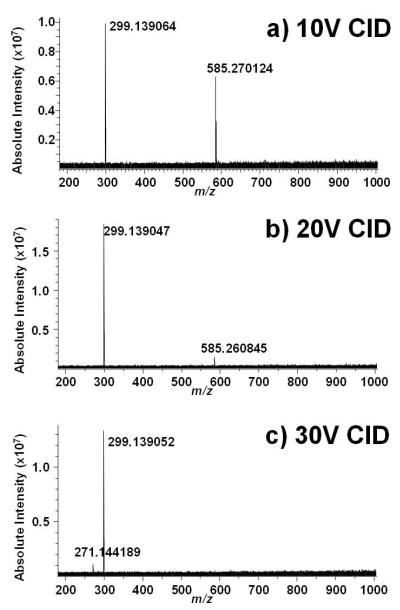
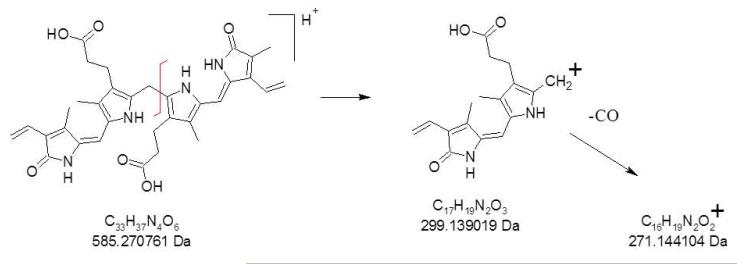
CID of bilirubin on the FT-ICR revealed some differences vs. the ion trap and helped identify the product ions. First, even at a collision energy of 10V, only a single product ion is produced at m/z 299.139064 (Figure 1a). Exact mass analysis confirms that this corresponds to the formula C17H19N2O3 (theoretical 299.139019 Da, 0.2 ppm error). This product ion is likely the result of dissociation of the C—C bond between the central bridge methylene carbon to either of the inner two pyrrole rings. Upon increasing the collision energy to 20V (Figure 1b), only one additional product ion is observed at m/z 271.144189, corresponding to C16H19N2O2 (271.144104 Da, 0.3 ppm mass error), clearly due to neutral loss of CO from the product ion at m/z 299; these two product ions are the only ones observed at a collision energy of 30V (Figure 1c). The lack of appearance of the product ions at m/z 566, 462, and 297 may indicate that even low energy CID with argon is too harsh to generate product ions that are generated under even higher energy CID with helium. Regardless, the m/z 299 dominates over a wide range of collision energies for both helium and argon collision gases. A fragmentation scheme that summarizes these FT-ICR CID findings is shown as Scheme 1.
Figure 1.
Positive ion ESI FT-ICR mass spectra of bilirubin.A) CID at 10V; B) CID at 20V; C) CID at 30V.
Scheme 1.
CID fragmentation of bilirubin.
Because of the higher yield of parent ions from the ESI source on the FT-ICR instrument, sufficient (M+Na)+ was available for conducting CID experiments. A summary of the CID results on (M+Na)+ from bilirubin over 10-30V energy is presented in Table 1. The product at nominal m/z 321 is analogous to the m/z 299 from protonated bilirubin, with the substitution of a sodium ion for a proton.
Table 1.
CID FT-ICR exact mass analysis of product ions generated from (M+Na)+ of bilirubin (nd = not detected).
| Exact masses, Da (mass error, ppm) | ||
|---|---|---|
| Formula | 10V | 30V |
| C17H18N2O3Na | 321.121004 (0.1) | nd |
| C16H18N2O3Na | 309.121013 (0.2) | 309.121408 (0.1) |
| C16H18N2ONa | 277.131189 (0.2) | nd |
ESI-MS/MS of Urobilin and its Dimethyl Ester
A full scan ESI ion trap mass spectrum of urobilin (or formally i-urobilin, C33H42N4O6) (Supplementary Data Figure S-2a) indicates the (M+H)+ and (M+Na)+ ions at m/z 591 and 613; the minor peak at m/z 343 is likely a fragment produced in the ion source based on our CID results (discussed below). Isolation of the urobilin precursor was performed utilizing a narrow enough mass window as to not obtain any isotope peaks in the CID mass spectra. Upon CID at 30% resonance ejection voltage energy, the major peaks are observed at m/z 466, 467 and 343 (Supplementary Data Figure S-2b). Additional peaks are observed at m/z 573, 468, and 344. CID at 70% resonance ejection voltage energy (Supplementary Data Figure S-2c) shows all of these peaks are still present and the appearance of m/z 283.
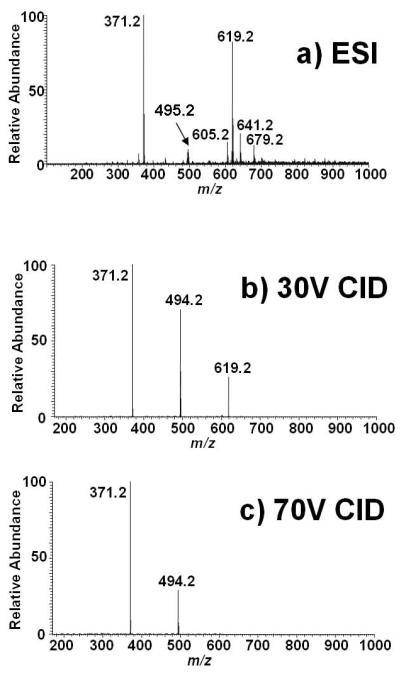
Because no CID mass spectra of i-urobilin have ever been published, we wished to first distinguish which of these product ions contained one or both of the inner two pyrrole rings. Inspired by a report which showed a straightforward procedure for creating methyl esters from the carboxylic acid groups in peptides using methanolic HCl,[17] we wished to test this approach for derivatizing tetrapyrroles. A full scan ESI ion trap mass spectrum of urobilin subjected to this procedure (Figure 2a) indicates that derivatization of the carboxylic acid groups into their methyl esters was complete, with strong precursor ions detected for the (M+H)+ and (M+Na)+ at m/z 619 and 641, respectively, and no peaks due to underivatized urobilin. Interestingly, two strong other ions are detected at m/z 495 and 371, which are likely fragments produced by dissociation of the precursors in the ESI source as these ions are produced by CID (see below). The precursor ion at m/z 619 was isolated and dissociated, and CID at 30% and 70% of the resonance ejection voltage are shown in Figure 2b and 2c. The product ion mass spectra are simple, with the only product ions at m/z 494 and 371. These are shifted by 28 Da from the product ions at m/z 466 and 343 due to the two methyl esters that were formed during derivatization. Therefore, it is clear that the product ions at m/z 466 and 343 contain both of the two inner pyrrole rings.
Figure 2.
Positive ion ESI ion trap mass spectra of the dimethyl ester of i-urobilin synthesized using methanolicHCl. A) Full scan; B) CID at 30% RF resonance ejection energy; C) CID at 70% RF resonance ejection energy.
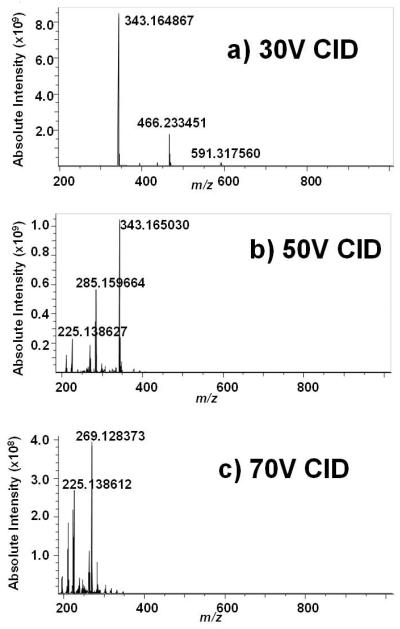
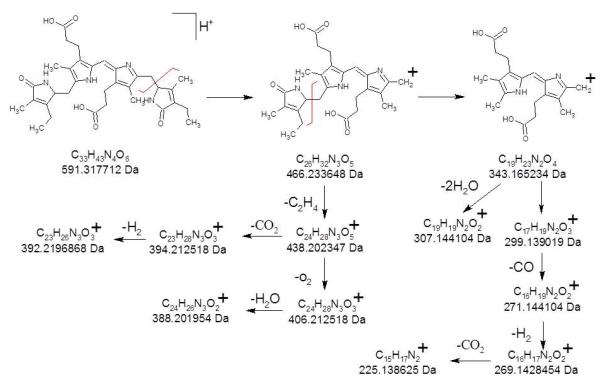
Positive ion ESI FT-ICR of urobilin standard (not shown) confirms (M+H)+ at 591.317455 Da (theoretical 591.317712 Da, −0.4 ppm error) and (M+Na)+ at 613.298790 (theoretical 613.299656 Da, −1.4 ppm error) by exact mass measurement. CID of urobilin over a range of collision energy (30-70V) on the FT-ICR is shown in Figure 3a-c. Because of the outstanding signal-to-noise ratios due to mass-selective accumulation of the precursor ions in the external quadrupole, not only are all of the product ions generated by CID on the ion trap observed, but so are many additional product ions. The high mass accuracy of FT-ICR enables deduction of their formulas. Exact mass analysis in Table 2 provides a summary of the product ions detected. Exact mass analysis reveals that the major product ions of urobilin at nominal m/z 466 and 343 are the result of consecutive losses of terminal pyrroles, first C7H11NO (−125 Da) at one terminus and C7H9NO (−123 Da) at the other. This also validates our earlier supposition based on the methyl esterification experiment that these two product ions contain both internal pyrrole rings, in contrast to bilirubin. Clearly, some sort of hydrogen rearrangement must be taking place because the each terminal pyrrole contains C7H10NO, a mass of 124 Da. The peak at m/z 573 is due to loss of neutral water from the precursor ion, and that at m/z 468 simply has two more hydrogens than that at m/z 466. Based on this data, we propose a fragmentation mechanism (Scheme 2) in which the primary dissociation channel is dictated by successive loss of the two terminal pyrroles; channels involving loss of small neutrals proceeds along relatively minor dissociation channels, subsequent to the loss of either terminal pyrrole ring.
Figure 3.
Positive ion CID ESI FT-ICR mass spectra of i-urobilin.A) CID at 30V; B) CID at 50V; C) CID at 70V.
Table 2.
CID FT-ICR exact mass analysis of product ions generated from (M+H)+ of urobilin (nd = not detected).
| Exact masses, Da(mass error, ppm) | |||
|---|---|---|---|
| Formula | 30 V | 50 V | 70 V |
| C33H41N4O6 | 573.306998 (−0.3) | nd | nd |
| C26H34N3O5 | 468.249148 (−0.4) | nd | nd |
| C26H33N3O5 | 467.241308 (−0.4) | nd | nd |
| C26H32N3O5 | 466.233451 (−0.4) | 466.233394 (−0.5) | nd |
| C25H30N3O5 | nd | 452.217639 (−0.8) | nd |
| C24H28N3O5 | 438.202159 (−0.4) | 438.202076 (−0.6) | nd |
| C24H28N3O3 | nd | 406.2122274 (−0.6) | nd |
| C23H28N3O3 | 394.212377 (−0.4) | 394.212207 (−0.8) | nd |
| C23H26N3O3 | nd | 392.196596 (−0.7) | nd |
| C24H26N3O2 | nd | 388.201781 (−0.4) | nd |
| C22H24N3O3 | nd | 378.180941 (−0.7) | nd |
| C22H26N3O | nd | nd | 348.206904 (−0.4) |
| C22H24N3O | nd | nd | 346.191232 (−0.5) |
| C19H24N2O4 | 344.173021 (−0.1) | 344.172879 (−0.5) | nd |
| C19H23N2O4 | 343.164867 (−1.1) | 343.165030 (−0.6) | 343.165128 (−0.3) |
| C21H22N3O | nd | nd | 332.175587 (−0.5) |
| C21H20N3O | nd | nd | 330.159940 (−0.5) |
| C18H19N2O4 | nd | nd | 327.133826 (−0.3) |
| C21H19N2O | nd | nd | 315.149090 (−0.3) |
| C20H17N3O | nd | nd | 315.136581 (−0.1) |
| C19H19N2O2 | nd | 307.144004 (−0.3) | nd |
| C19H17N3O | nd | nd | 303.136581 (−0.4) |
| C20H20N3 | nd | nd | 302.165061 (−0.4) |
| C19H16N3O | nd | nd | 302.128666 (−0.4) |
| C17H19N2O3 | nd | 299.138966 (−0.3) | nd |
| C18H16N3O | nd | nd | 290.128659 (−0.4) |
| C18H14N3O | nd | nd | 288.113025 (−0.4) |
| C17H21N2O2 | nd | 285.159664 (−0.3) | 285.159640 (−0.4) |
| C17H19N2O2 | nd | 283.144039 (−0.2) | 283.143998 (−0.4) |
| C16H19N2O2 | nd | 271.144054 (−0.2) | nd |
| C15H15N2O3 | nd | 271.107672 (−0.2) | nd |
| C16H17N2O2 | nd | 269.128438 (−0.1) | 269.128373 (−0.3) |
| C17H15N2O | nd | nd | 263.117826 (−0.2) |
| C18H17N2 | nd | nd | 261.138572 (−0.2) |
| C17H15N2 | nd | nd | 247.122934 (−0.2) |
| C16H19N2 | nd | nd | 239.154240 (−0.1) |
| C15H17N2 | nd | 225.138627 (0.0) | 225.138612 (−0.1) |
| C15H15N2 | nd | nd | 223.122959 (−0.1) |
| C14H15N2 | nd | 211.122983 (0.0) | 211.122978 (0.0) |
| C13H12N2 | nd | 196.099494 (0.0) | 196.099500 (0.0) |
| C10H14NO2 | nd | 180.101889 (−0.1) | nd |
| C12H10N | nd | nd | 168.080754 (−0.1) |
| C9H10NO2 | nd | 164.070584 (−0.1) | 164.070582 (−0.1) |
Scheme 2.
CID fragmentation of urobilin.
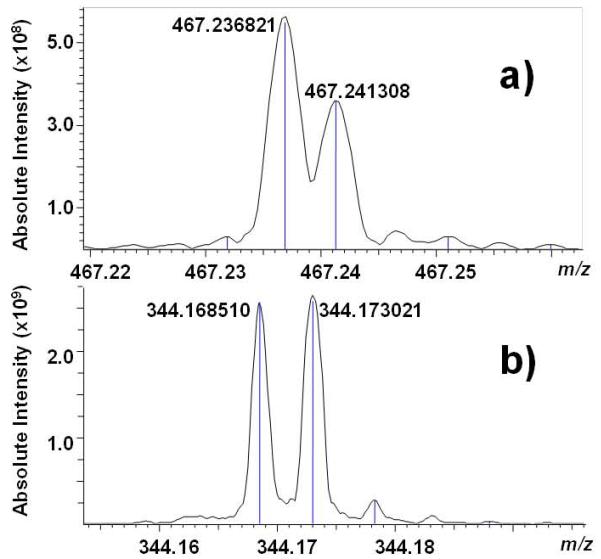
It is the analysis of the peaks near m/z 467.24 and 344.17 that accentuates the value of high mass accuracy. A number of key reports have shown how important the high mass accuracy of FT-ICR is to the identification of organic molecules[18-20] and fragment ions from small organic molecules.[21-22] Unlike the ion trap CID experiments, with the FT-ICR we intentionally retained both the all-12C and 13C1 isotopes prior to CID. At m/z 467.24, there are two clearly separated peaks (Figure 4a) at 467.236821 Da and 467.241308 Da. The former corresponds to the 13C isotope of C26H32N3O5 (theoretical mass 467.236961 Da, −0.3 ppm error), while the latter represents C26H33N3O5 (theoretical mass 467.241473 Da, −0.4 ppm error). Thus, based on the high resolution FT-ICR analysis of unlabeled urobilin, the peak at m/z 495 in dimethylated urobilin (Figure 2) is actually a combination of both the 13C isotope of C28H37N3O5 and C28H38N3O5.
Figure 4.
High-resolution insets of CID ESI FT-ICR mass spectra around A) m/z 467.24 and B) m/z 344.17.
Likewise, at m/z 344.17, there are two clearly separated peaks (Figure 4b) at 344.168510 Da and 344.173021 Da. The former corresponds to the 13C isotope of C19H23N2O4 (theoretical mass 344.168559 Da, −0.1 ppm error), while the latter represents C19H24N2O4 (theoretical mass 344.173059 Da, −0.1 ppm error). In both cases, the extra hydrogen atom in these structures likely is due to a methyl, and not a terminal methylene group.
ESI-MS/MS of Stercobilin and its Dimethyl Ester
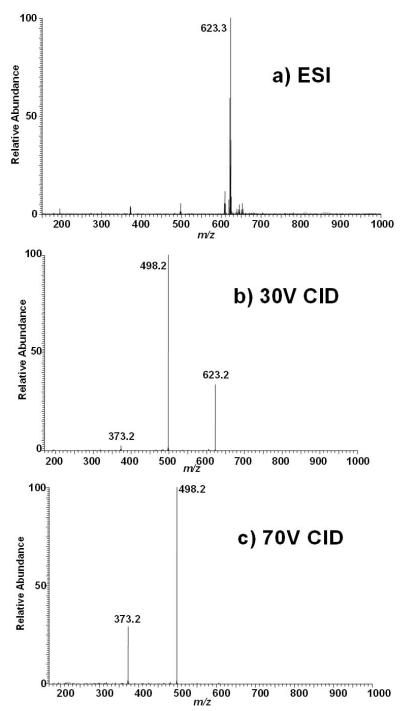
A full scan ESI ion trap mass spectrum of L-stercobilin (C33H48N4O6) is predominated by (M+H)+ at m/z 595; in addition, small intensities of (M+Na)+ and (M+K)+ are detected at m/z 617 and 633, respectively, as well as fragment ions at m/z 345 and 470 (Supplementary Data Figure S-3a). The (M+H)+ ion was isolated at unit mass resolution, and CID mass spectra were obtained at 30% and 70% of the RF resonance ejection energy (Supplementary Data Figures S-3b and S-3c). CID at 30% or 70% leads to only two major product ions; the first is at m/z 470 and dominates under both conditions, and second low intensity product ion is observed at m/z 345. These ions were also observed in the only published CID mass spectrum of stercobilin, which postulated that these ions were formed from successive losses of the terminal pyrroles;[10] based on the fragmentation behavior we observed for i-urobilin this seemed highly plausible. A minor product ion is observed at m/z 180. We wished to test whether the major product ions contain the inner pyrrole rings by derivatizing stercobilin to form the methyl esters. As shown in Figure 5a, the full scan ESI ion trap mass spectrum indicates that esterification is complete with a small intensity observed for the monomethyl ester at m/z 609 and the vast majority of stercobilin converted to the dimethyl ester at m/z 623. Isolation of the (M+H)+ for the dimethylester at m/z 623 followed by CID at 30% and 70% of the resonance ejection energy is displayed in Figures 5b and 5c, respectively. The resultant product ions are observed at m/z 498 and 373, shifted 28 Da higher than from stercobilin. Thus both product ions contain the inner two pyrrole rings, consistent with the earlier proposed fragmentation scheme.[10] In addition, a minor product ion at m/z 194 is observed, consistent with only a single methyl ester; hence, this product ion contains one of the two inner pyrrole rings.
Figure 5.
Positive ion ESI ion trap mass spectra of the dimethyl ester of stercobilin synthesized using methanolicHCl. A) Full scan; B) CID at 30% RF resonance ejection energy; C) CID at 70% RF resonance ejection energy.
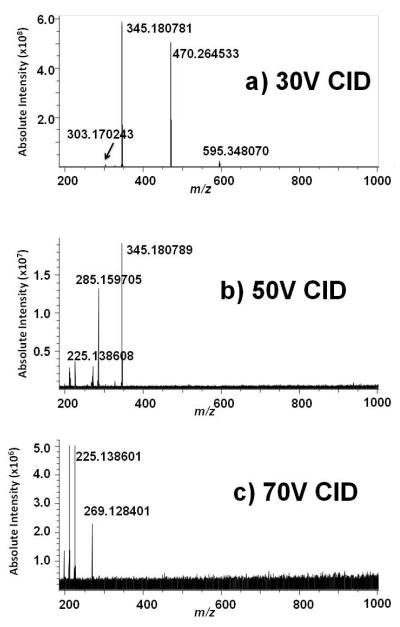
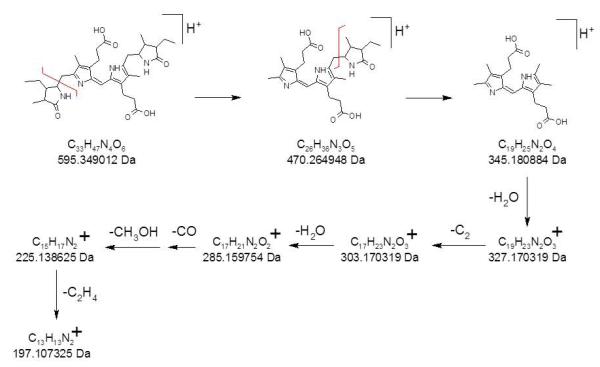
Positive ion ESI FT-ICR of stercobilin standard (not shown) confirms (M+H)+ at 595.348694 Da (theoretical 595.349012 Da, −0.5 ppm mass error) by exact mass measurement. CID of stercobilin over a range of collision energy (30-70V) on the FT-ICR is shown in Figure 6a-c. Again, because of the high signal-to-noise ratio due to selective ion accumulation of the precursor ion in the external quadrupole, CID on the FT-ICR reveals many additional fragment ions not detected by CID on the ion trap; the m/z values of the resultant product ions are listed in Table 3. The high mass accuracy enables identification of the formulas of each of the ions. Based on our data, a dissociation pathway for stercobilin is proposed in Scheme 3.
Figure 6.
Positive ion CID ESI FT-ICR mass spectra of stercobilin.A) CID at 30V; B) CID at 50V; C) CID at 70V.
Table 3.
CID FT-ICR exact mass analysis of product ions generated from (M+H)+ of stercobilin (nd = not detected).
| Exact masses, Da(mass error, ppm) | |||
|---|---|---|---|
| Formula | 30 V | 50 V | 70 V |
| C26H36N3O5 | 470.264533 (−0.3) | nd | nd |
| C19H25N2O4 | 345.180781 (−0.3) | 345.180789 (−0.3) | nd |
| C19H23N2O3 | nd | 327.170181 (−0.4) | nd |
| C17H23N2O3 | 303.170243 (−0.3) | 303.170310 (0.0) | nd |
| C17H21N2O2 | nd | 285.159705 (−0.2) | nd |
| C16H19N2O2 | nd | 271.144048 (−0.2) | nd |
| C16H17N2O2 | nd | nd | 269.128401 (−0.2) |
| C15H17N2 | nd | 225.138608 (−0.1) | 225.138601 (−0.1) |
| C14H15N2 | nd | 211.122948 (−0.1) | 211.122957 (−0.1) |
| C13H13N2 | nd | nd | 197.107314 (−0.1) |
Scheme 3.
CID fragmentation of stercobilin.
Comparison of Fragmentation Behavior Amongst the Bilins
Although all the bilins contain identical numbers of carbon, nitrogen, and oxygen atoms, they differ in the number of hydrogen atoms as well as in the location of degrees of unsaturation. This leads to some significant differences in the observed fragmentation behavior. Foremost is how dissociation occurs with respect to the pyrrole rings. For bilirubin, either of the two C—C bonds from the central bridging carbon to the inner pyrroles breaks, or the product ion generated from this bond dissociation is the major product, independent of collision energy or gas used. However, in urobilin and stercobilin the central bridging carbon has one C—C and one C==C bond to the inner pyrrole rings, causing dissociation to occur primarily from successive losses of the terminal pyrroles. It is interesting that despite the fact that the terminal pyrroles in urobilin are lighter than those in stercobilin by 2 Da, both bilins lose a unit of C7H11NO first (−125 Da), which is repeated in stercobilin while followed by loss of 123 Da in urobilin due to C7H9NO. Evidently, hydrogen-rearrangement is occurring during the activation process and it does not appear to be dependent on the collision gas and mass analyzer employed.
CONCLUSIONS
CID mass spectra have been obtained for a number of structurally-related tetrapyrrole bilins as a function of collision energy, collision gas, and mass analyzer. Using a strategy of methyl esterification to first identify which product ions contain the inner pyrrole rings and high mass accuracy FT-ICR, fragmentation schemes were elucidated for each of the tetrapyrroles. Bilirubin differs from urobilin and stercobilin in that fragmentation is dominated by C—C dissociation between the central bridging carbon and the inner pyrrole rings as opposed to successive losses of terminal pyrroles. This difference is likely due to the stability afforded the central bridging carbon in urobilin and stercobilin due to its C==C to one of the inner pyrrole rings. For bilirubin, it is notable that loss of a terminal pyrrole only occurs with the use of the lighter collision gas (helium) and not the heavier argon; nevertheless, independent of collision gas or energy, dissociation between the central methylene carbon and either inner pyrrole ring predominates to generate product ions containing either dipyrrole terminus. Urobilin and stercobilin dissociation is initiated from each terminus to produce product ions containing the inner two rings, as opposed to the terminal dipyrroles observed with bilirubin. Additional collision energy generates neutral losses of small molecules from the most intense product ions, whether helium or argon is used. The product ions generated for each bilin are very distinct, and hence CID is a very effective means of structurally distinguishing these metabolic species, which may play important roles in investigations of urinary biomarkers and in providing evidence of human waste contamination in the environment.
Supplementary Material
ACKNOWLEDGMENTS
We gratefully acknowledge Dr. Christopher L. Pennington and Prof. Yong Seok Choi, who detected stercobilin present in human urine specimens before this study was conducted. We gratefully acknowledge the financial support of the NIH through the National Center for Research Resources for providing the funding used to obtain the FT-ICR (Grant S10-RR029517-01).
REFERENCES
- [1].Pullman B, Perault AM. On the metabolic breakdown of hemoglobin and the electronic structure of the bile pigments. Proc. Natl. Acad. Sci. USA. 1959;45:1476–1480. doi: 10.1073/pnas.45.10.1476. [DOI] [PMC free article] [PubMed] [Google Scholar]
- [2].Maisels MJ, Baltz RD, Bhutani VK, Newman TB, Palmer H, Rosenfeld W, Stevenson DK, Weinblatt HB, Subcomm H. Management of hyperbilirubinemia in the newborn infant 35 or more weeks of gestation. Pediatrics. 2004;114:297. doi: 10.1542/peds.114.1.297. [DOI] [PubMed] [Google Scholar]
- [3].Maimburg RD, Bech BH, Vaeth M, Moller-Madsen B, Olsen J. Neonatal jaundice, autism, and other disorders of psychological development. Pediatrics. 2010;126:872. doi: 10.1542/peds.2010-0052. [DOI] [PubMed] [Google Scholar]
- [4].Amin SB, Smith T, Wang H. Is neonatal jaundice associated with autism spectrum disorders: a systematic review. J. Autism Dev. Disord. 2011;41:1455. doi: 10.1007/s10803-010-1169-6. [DOI] [PMC free article] [PubMed] [Google Scholar]
- [5].Pirone C, Johnson J, Quirke J, Priestap H, Lee D. The animal pigment bilirubin identified in strelitzia reginae, the bird of paradise flower. Hortscience. 2010;45:1411. [Google Scholar]
- [6].Pirone C, Quirke J, Priestap H, Lee D. Animal pigment bilirubin discovered in plants. J. Am. Chem. Soc. 2009;131:2830. doi: 10.1021/ja809065g. [DOI] [PMC free article] [PubMed] [Google Scholar]
- [7].Otani K, Shimizu S, Chijiiwa K, Yamaguchi K, Kuroki S, Tanaka M. Increased urinary excretion of bilirubin oxidative metabolites in septic patients: A new marker for oxidative stress in vivo. J. Surgical Res. 2001;96:44. doi: 10.1006/jsre.2000.6036. [DOI] [PubMed] [Google Scholar]
- [8].Fahmy K, Gray CH, Nicholson DC. Reduction of bile pigments by fecal and intestinal bacteria. Biochimica et Biophysica Acta. 1972;264:85. doi: 10.1016/0304-4165(72)90119-5. [DOI] [PubMed] [Google Scholar]
- [9].Moscowitz A, Weimer M, Lightner DA, Petryka ZJ, Davis E, Watson CJ. In vitro conversion of bile pigments to urobilinoids by a rat clostridia species as compared with human fecal flora. 3. natural d-urobilin, synthetic i-urobilin, synthetic i-urobilin, and synthetic i-urobilinogen. Biochem. Med. 1970;4:149. doi: 10.1016/0006-2944(70)90091-8. [DOI] [PubMed] [Google Scholar]
- [10].Jones-Lepp T. Chemical markers of human waste contamination: analysis of urobilin and pharmaceuticals in source waters. J. Environ. Monitoring. 2006:8472. doi: 10.1039/b512858g. [DOI] [PubMed] [Google Scholar]
- [11].Jackson AH, Smith KM, Gray CH, Nicholson DC. Molecular species of urobilins. Nature. 1966;209:81. doi: 10.1038/209581a0. [DOI] [PubMed] [Google Scholar]
- [12].Watson CJ, Moscowitz A, Lightner DA, Petryka ZJ, Davis E, Weimer M. On existence and structure of a new urobilin of molecular weight 592. Proc. Natl. Acad. Sci. USA. 1967;58:1957. doi: 10.1073/pnas.58.5.1957. [DOI] [PMC free article] [PubMed] [Google Scholar]
- [13].Stoll MS, Gray CH. Oxidation products of crude mesobilirubinogen. Biochem. J. 1970;117:271. doi: 10.1042/bj1170271. [DOI] [PMC free article] [PubMed] [Google Scholar]
- [14].Jackson AH, Kenner GW, Budzikiewicz HC, Djerassi C, Wilson JM. Pyrroles and related compounds. X. Mass spectrometry in structural and stereochemical problems. mass spectra of linear di- tri- and tetrapyrrolic compounds. Tetrahedron. 1967;23:603. [Google Scholar]
- [15].Jackson AH, Games DE, Cooper G. Intermediates in heme degradation. Biochem. Soc. Trans. 1976;4:214. doi: 10.1042/bst0040214. [DOI] [PubMed] [Google Scholar]
- [16].Wood TD, Pennington CL, Choi YS. Stercobilin: a possible biomarker for autism?. Proc. 55th ASMS Conf. on Mass Spectrometry & Allied Topics; Indianapolis, IN. 2007. [Google Scholar]
- [17].Mingming M, Kutz-Naber K, Li L. Methyl esterification assisted MALDI FTMS characterization of orcokinin neuropeptide family. Anal. Chem. 2007;79:673. doi: 10.1021/ac061536r. [DOI] [PubMed] [Google Scholar]
- [18].Marshall AG, Rogers RP. Petroleomics: chemistry of the underworld. Proc. Natl. Acad. Sci. USA. 2008;105:18090. doi: 10.1073/pnas.0805069105. [DOI] [PMC free article] [PubMed] [Google Scholar]
- [19].Sleighter RL, Hatcher PG. The application of electrospray ionization coupled to ultrahigh resolution mass spectrometry for the molecular characterization of natural organic matter. J. Mass Spectrom. 2007;42:559. doi: 10.1002/jms.1221. [DOI] [PubMed] [Google Scholar]
- [20].Szulejko JE, Hall SK, Jackson M, Solouki T. Differentiation between pure cultures of streptococcus pyogenes and pseudomonas aeruginosa by FT-ICR-MS volatile analysis. Open Spectroscopy J. 2009;3:21. [Google Scholar]
- [21].Shi SDH, Hendrickson CL, Marshall AG, Siegel MM, Kong F, Carter GT. Structural validation of saccharomicins by high resolution and high mass accuracy fourier transform-ion cyclotron resonance-mass spectrometry and infrared multiphoton dissociation tandem mass spectrometry. J. Am. Soc. Mass Spectrom. 1999;10:1285. [Google Scholar]
- [22].McDonald LA, Barbieri LR, Carter GT, Kruppa G, Feng X, Lotvin JA, Siegel MM. FTMS structure elucidation of natural products: application to muramycin antibioticvs using esi multi-chep sori-cid ftmsn the top-down/bottom-up approach and hplc esi capillary-skimmer cid ftms. Anal. Chem. 2003;75:2730. doi: 10.1021/ac0264731. [DOI] [PubMed] [Google Scholar]
Associated Data
This section collects any data citations, data availability statements, or supplementary materials included in this article.


