

Abstract
MicroRNAs (miRNAs) are small, noncoding RNAs that negatively regulate gene expression. As miRNAs are involved in a wide range of biological processes and diseases, much effort has been invested in identifying their mRNA targets. Here, we present a novel combinatorial approach, RIP-chip-SRM (RNA-binding protein immunopurification + microarray + targeted protein quantification via selected reaction monitoring), to identify de novo high-confidence miRNA targets in the nematode Caenorhabditis elegans. We used differential RIP-chip analysis of miRNA-induced silencing complexes from wild-type and miRNA mutant animals, followed by quantitative targeted proteomics via selected reaction monitoring to identify and validate mRNA targets of the C. elegans bantam homolog miR-58. Comparison of total mRNA and protein abundance changes in mir-58 mutant and wild-type animals indicated that the direct bantam/miR-58 targets identified here are mainly regulated at the level of protein abundance, not mRNA stability.
MicroRNAs (miRNAs) belong to an evolutionarily conserved class of ∼22-nt-long noncoding RNAs that negatively regulate gene expression and are involved in many biological processes and diseases (Bartel 2004; Jovanovic and Hengartner 2006; Stefani and Slack 2008; Croce 2009). Mature miRNAs form, together with a bound Argonaute family member and other proteins, a miRNA-induced silencing complex (miRISC), which the miRNA guides to target mRNAs via imperfect base-pairing (Filipowicz et al. 2008; Hutvagner and Simard 2008). The molecular mechanism of action of animal miRNAs is still under debate. Whereas some reports proposed that miRNAs predominantly inhibit translation with only minor effects on the mRNA levels (Lee et al. 1993; Wightman et al. 1993), other studies found a strong correlation between mRNA and protein abundance changes of primary miRNA targets, suggesting that miRNAs might repress gene expression mainly via mRNA degradation (Bagga et al. 2005; Baek et al. 2008; Hendrickson et al. 2009; Guo et al. 2010; Huntzinger and Izaurralde 2011). This debate is paralleled by an equally intense debate regarding the best approach to identify direct miRNA targets.
Computational approaches have been used extensively to predict miRNA target genes. However, in order to decrease the false positive rate, most programs need to apply very stringent selection criteria, such as conservation of the target site among closely related species and the “seed rule”—perfect or nearly perfect complementarity of the mRNA target site to the miRNA seed (nt 2–7 of the miRNA) (for review, see Bartel 2009). Because of these stringent restrictions, current prediction programs risk missing some true targets.
Much effort has also been invested in identifying miRNA targets experimentally, using quantitative transcriptomics and proteomics techniques. Global searches for miRNA-induced mRNA and/or protein changes have yielded many new miRNA candidate targets. However, these methods cannot distinguish direct from indirect targets (Krützfeldt et al. 2005; Lim et al. 2005; Vinther et al. 2006; Baek et al. 2008; Selbach et al. 2008). In principle, direct miRNA targets can be identified through coimmunopurification of miRISCs and their associated mRNAs (RIP, i.e., RNA binding protein [RBP]-immunopurification) and the subsequent identification of miRISC-associated mRNAs, either by microarrays (RIP-chip) (Beitzinger et al. 2007; Easow et al. 2007; Karginov et al. 2007; Zhang et al. 2007; Hendrickson et al. 2008; Landthaler et al. 2008; Zhang et al. 2009) or direct mRNA sequencing (CLIP-seq) (Chi et al. 2009; Hafner et al. 2010; Zisoulis et al. 2010). Although such RIP-chip and CLIP-seq studies clearly showed the successful enrichment for bona fide miRNA targets, it has been difficult to determine the biological relevance of the identified targets, as these approaches do not measure the effect of miRISC association on gene expression. To address this issue, Brown and colleagues recently combined RIP-chip and ribosomal density profiling to simultaneously measure mRNA and their respective ribosome density and occupancy (as a proxy to protein abundance) changes following miRNA overexpression (Hendrickson et al. 2009).
Here, we present an alternative combinatorial approach, RIP-chip-SRM (RBP-immunopurification + microarray + targeted protein quantification via selected reaction monitoring), to identify and validate miRNA targets. We applied this novel method to identify and characterize high-confidence mRNA targets of the C. elegans bantam homolog miR-58. First, in a discovery step, we performed a differential RIP-chip analysis of miRISCs isolated from wild-type and miRNA deletion mutant animals to identify, de novo, a population of potential direct miRNA targets. Second, in a validation step, we used quantitative targeted proteomics via selected reaction monitoring (Lange et al. 2008a,b; Picotti et al. 2008, 2009, 2010; Jovanovic et al. 2010) to directly compare the abundance in wild-type and miRNA mutant animals of the protein products of the candidate transcripts identified in the discovery step. The combined RIP-chip-SRM approach efficiently separated direct from indirect targets, highlighting the importance of independent experimental validation strategies downstream from a RIP-chip assay. Interestingly, the comparison of total mRNA changes to the protein changes upon bantam/mir-58 deletion indicated that the direct targets identified by our RIP-chip-SRM method are mainly regulated at the level of protein abundance, not by mRNA stability.
Results
TAP::ALG-1 RIP-chip in C. elegans enriches for bona fide miRNA targets
To discover new miRNA targets, we generated a C. elegans transgenic line expressing a functional, N-terminally tandem affinity purification (TAP)-tagged ALG-1 protein (TAP::ALG-1 strain) (see Methods for details). We next purified TAP::ALG-1 complexes from mixed-stage TAP::ALG-1 transgenic and wild-type animals (serving as a mock control) and hybridized the associated mRNAs to two-color microarrays (Supplemental Table S1). We observed a significant enrichment for ∼4000 out of a total of 15,000 detected mRNA species in pull-downs from TAP::ALG-1-expressing animals compared to mock pull-downs from the wild-type control animals (P-value < 0.05, two-sample Student’s t-test, equal variances, FDR < 6.5%) ( Fig. 1A; Supplemental Table S2; Storey and Tibshirani 2003).
Figure 1.

TAP::ALG-1 RIP enriches for miRNA targets. (A) RIP-chip of TAP::ALG-1-associated mRNAs. The log2 ratio profiles of the 4071 oligo probes (representing 3750 gene models, out of a total of 15,322 oligo probes, representing 12,890 gene models, detected) that were significantly changed (P-value < 0.05, two-sample t-test) in the TAP::ALG-1 RIP compared to the mock RIP are shown. Log2 ratios (RIP mRNA/total mRNA) were calculated for each measured oligo probe and normalized to the corresponding mock average log2 ratio for better visualization. A total of 99.7% of all features are enriched in the TAP::ALG-1 RIP. Three independent biological replicates were analyzed. Genotypes used: TAP::ALG1: alg-1(tm492); opIs205, wild type: N2 (= mock control). (B) The set of 3750 TAP::ALG-1-associated mRNAs identified here overlaps strongly (P-value < 3 × 10−59; hypergeometric distribution) with a previously published set of ALG-1-associated mRNAs identified by Clip-seq (Zisoulis et al. 2010). Only Clip-seq mRNAs that had also been detected on our microarrays (2560 out of 3093) were included in the analysis. The total number of expressed genes (12,890) on our microarray was used for the statistical analysis. (C) TAP::ALG-1 RIP enriches for mRNAs with seed binding sites for abundant miRNAs. miRNA seeds were arranged in groups of five based on their miRNA microarray expression values (see Supplemental Table S4). TOP1 includes the five most highly expressed miRNA seeds (including bantam/miR-58), TOP2 includes the next five most highly expressed seeds, etc. The CTL1, CTL2, and CTL3 groups each contained five miRNA seeds that were below the detection limit on the miRNA microarray (all seed groups are listed in Supplemental Table S13). Relative seed binding site enrichment in the 3′ UTRs of TAP::ALG-1-associated mRNAs compared to nonassociated mRNAs was determined for each group as described in Methods. Two different P-values and three different signal-to-noise ratio (SNR) cutoffs were applied to define the TAP::ALG-1 associated mRNAs.
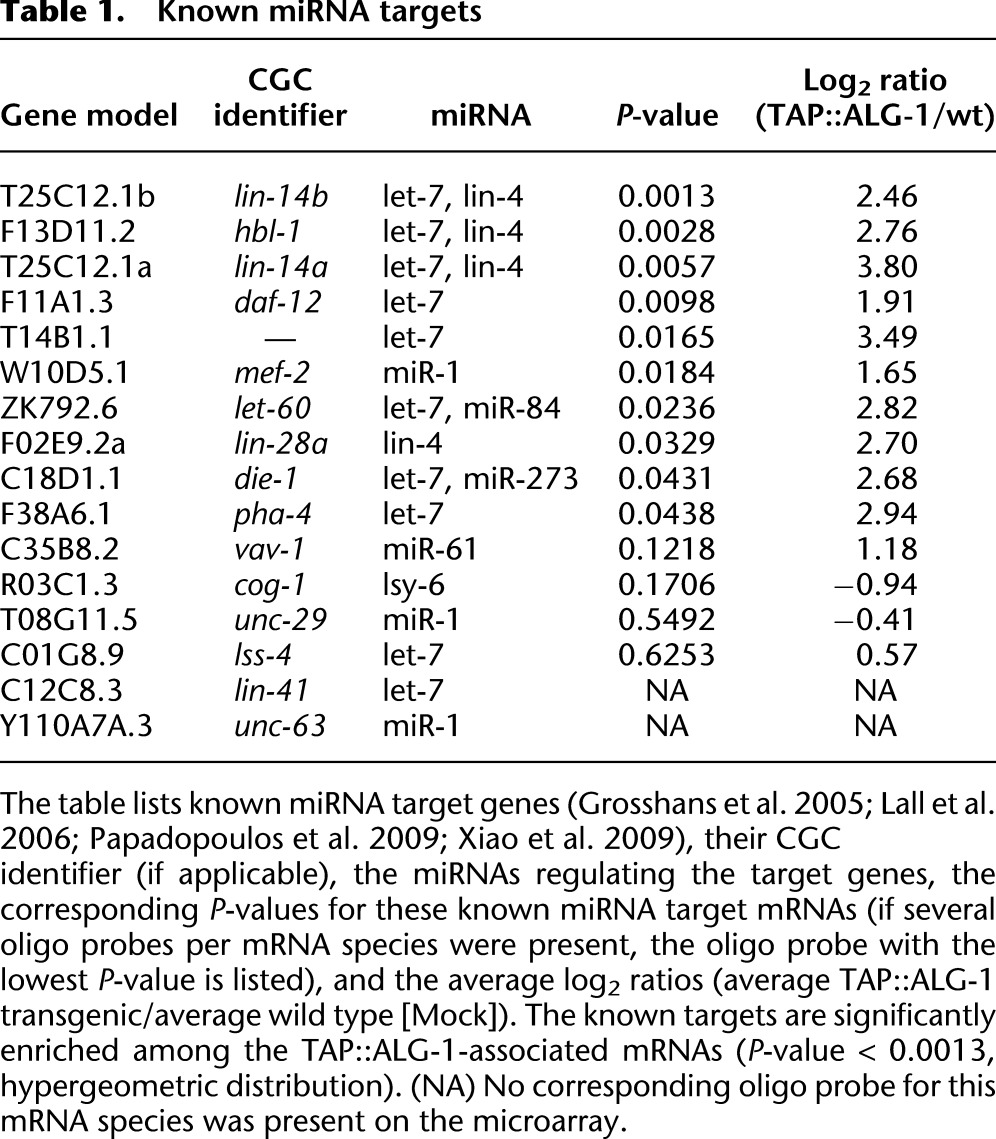
Three lines of evidence support the contention that this set of Argonaute-associated mRNAs is enriched in miRNA targets. First, the set was significantly enriched in known C. elegans miRNA targets (P-value < 0.0013, hypergeometric distribution) (Table 1; Grosshans et al. 2005; Lall et al. 2006; Papadopoulos et al. 2009; Xiao et al. 2009). Second, the discovered set overlapped significantly with a set of 3093 ALG-1-associated mRNA species that were identified recently via HITS-CLIP by the Pasquinelli and Yeo groups (Zisoulis et al. 2010) (42% overlap, P-value < 3 × 10−59, hypergeometric distribution) (Fig. 1B; Supplemental Table S3), even though different developmental stages were used in the two studies (mixed stage vs. stage L4 larvae). Third, we measured the abundance of miRNAs in our samples (Supplemental Fig. S1; Supplemental Table S4) and used this information to test for the enrichment of miRNA seed binding sites in the 3′ UTRs of the Argonaute-associated mRNAs (see Methods for details; Landthaler et al. 2008). We found that the set of Argonaute-associated mRNAs was significantly enriched for binding sites for the most abundant miRNA seeds. The degree of enrichment increased with increasing stringency in mRNA target selection (lower P-value cutoff and higher signal-to-noise ratio [SNR] cutoff) (Fig. 1C; Supplemental Fig. S2). At the most stringent cutoff (P-value < 0.01, FDR < 5%, SNR > 3), there was a 1.7-fold enrichment of miRNA binding sites in the 458 mRNA species left, compared to all other expressed mRNA species. This level of enrichment for seed binding motifs for a similar number of target genes was previously reported in human HEK293 cell lines (1.5-fold enrichment of seed binding motifs for the top 600 enriched mRNAs) (Landthaler et al. 2008).
Table 1.
Known miRNA targets
Identification of the target mRNAs of C. elegans bantam/miR-58
To determine whether RIP-chip can also be used to identify the targets of a specific miRNA, we decided to investigate the targets of miR-58, the C. elegans homolog of Drosophila bantam (Alvarez-Saavedra and Horvitz 2010; Wu et al. 2010). Bantam/miR-58 is one of the most highly expressed miRNAs in C. elegans (Kato et al. 2009; Supplemental Fig. S1; Supplemental Table S4) and part of a miRNA family containing four additional members with very similar seed sequences (miR-80, miR-81, miR-82, and the recently discovered miR-1834) (Alvarez-Saavedra and Horvitz 2010). Bantam/miR-58 is, by far, the most highly expressed family member, contributing over 90% of the total expression of the whole family (Kato et al. 2009). Interestingly, while single deletion mutants within this family (including mir-58) have no obvious phenotype, mutant animals in which the whole family has been knocked out show multiple defects, including reduced body size, defective dauer formation, and sluggish movement (Alvarez-Saavedra and Horvitz 2010).
We crossed the TAP::ALG-1 transgene into the mir-58(n4640) mutant background to generate the strain WS5041 (see Methods). For simplicity, we will, hereafter, term the TAP::ALG-1 transgenic animals as “wild type” and the transgenic WS5041 animals as “mir-58.” We compared the mRNA population that coimmunopurified with TAP::ALG-1 from synchronized L4 stage “wild-type” animals with that from synchronized L4 stage “mir-58” mutant animals by one-color Affymetrix gene arrays (Supplemental Table S5). Bantam/miR-58 target mRNAs should be specifically underrepresented in the latter samples. Analysis of our data showed that, while the immunopurified mRNA species isolated from “wild-type” and “mir-58” animals were globally very similar (R2 = 0.99, Pearson square correlation) (Fig. 2A), there was a highly significant bias among genes containing potential bantam/miR-58 seed binding sites (7-mers, one mismatch allowed) to be depleted (log2 RIP“mir-58”/“wild-type” < 0) in the “mir-58” RIPs (P-value = 6.3 × 10⁻⁸, hypergeometric distribution) (Fig. 2A). Potential targets were also significantly overrepresented (P-value = 0.031, hypergeometric distribution) (Fig. 2B) in the group of genes that were significantly depleted in the “mir-58” RIPs (FDR < 5%, paired significance analysis of microarrays [SAM]) (Tusher et al. 2001), as expected for potential bantam/miR-58 target genes. The above conclusions are also valid if only perfect 7-mer bantam/miR-58 seed binding sites are considered (Fig. 2).
Figure 2.

Identification of bantam/miR-58 targets by differential RIP-chip. (A) TAP::ALG-1 associated mRNAs were purified from synchronized L4 stage transgenic “wild-type” animals (WS4303; see Methods) and synchronized L4 stage transgenic “mir-58” mutants (WS5041; see Methods) and analyzed by one-color microarrays (Affymetrix). The average log2 expression values of all the detected mRNAs are shown. The abundance of TAP::ALG-1-associated mRNAs correlated strongly between both samples (Pearson square correlation factor [R2] = 0.99). Potential bantam/miR-58 targets are indicated in red (perfect 7-mer binding site in the 3′ UTR) and light blue (7-mer, one mismatch allowed). These potential bantam/miR-58 target genes were significantly overrepresented among the genes depleted in the “mir-58” RIPs, as expected for potential bantam/miR-58 targets. (B) Genes containing potential bantam/miR-58 binding sites were overrepresented among genes that were significantly depleted in the “mir-58” RIPs (FDR < 5%, SAM), as expected for potential bantam/miR-58 target genes. In contrast, no such overrepresentation could be detected for genes that were significantly enriched in the “mir-58” RIPs (FDR < 5%, SAM). P-values were determined by hypergeometric distribution.
Validation of candidates via targeted proteomics
Secondary effects caused by depletion of a highly expressed miRNA and experimental errors due to small differences between the “wild-type” and “mir-58” pull-down could impinge on target selection and fidelity. In order to identify high-confidence targets, we performed targeted protein quantification of as many of the candidate targets as possible as an additional experimental validation step. Bona fide targets would be expected to have increased protein levels in “mir-58” mutant animals when compared to “wild-type” animals.
Targeted proteomics by SRM has been established as a method for reliable protein quantification of candidate genes. By limiting the measurements to the proteins of interest, a dramatic increase in sensitivity and reproducibility can be achieved when compared to conventional shotgun proteomics approaches (Lange et al. 2008b; Picotti et al. 2009). We recently showed the suitability of SRM to validate several hundred predicted miRNA target genes by exact protein quantifications (Jovanovic et al. 2010), establishing SRM as a robust method to test our RIP-chip candidates. We selected the 118 highest-confidence RIP-chip candidates (FDR < 6% or FDR < 10% plus being predicted to be a bantam/miR-58 target [Lewis et al. 2005; Stark et al. 2005; Lall et al. 2006; Ruby et al. 2006; Watanabe et al. 2006; Griffiths-Jones et al. 2007], paired SAM, one-sided) for SRM analysis (Supplemental Table S6). We used the same samples that were also used for the RIP (stage L4 larvae) and could quantify 42 proteins (35%) in at least one replicate (Supplemental Table S7).
In a previous work, we used SRM to measure protein abundance changes in a group of 27 genes predicted by TargetScan (Lewis et al. 2005; Ruby et al. 2006) to be bantam/miR-58 targets based on the presence of conserved seed binding sites in their 3′ UTR and a control group of 22 randomly chosen proteins (Supplemental Table S7; Jovanovic et al. 2010). Whereas the 22 randomly chosen proteins showed only minor differences between “wild-type” and “mir-58” animals (Fig. 3A; Jovanovic et al. 2010), the 27 quantified TargetScan-predicted bantam/miR-58 targets were, as a group, significantly up-regulated in “mir-58” mutants compared to the random group (P-value < 10−3, Kolmogorov-Smirnov [KS] test) (Fig. 3A; Jovanovic et al. 2010), confirming that predictions based on conserved seed binding sites in 3′ UTRs successfully enrich for bona fide bantam/miR-58 targets.
Figure 3.

Bantam/miR-58 targets identified by RIP-chip are regulated mainly at the translational level. (A,B) Cumulative fraction plot of the log2 protein (A) and mRNA (B) changes (“mir-58” to “wild type”) of potential bantam/miR-58 targets identified by RIP-chip or TargetScan prediction and of a random control group. (A, inset) Overlap in membership between the RIP-chip and TargetScan groups. (C) Log-log plot of the protein (x-axis) and mRNA (y-axis) changes shown in A and B for the RIP-chip group. The RIP-chip candidates were subdivided into “RIP-chip (Protein up)” (log2 proteinmir-58/wt > 0; dark blue triangles) and “RIP-chip (Protein down)” (log2 proteinmir-58/wt < 0; light blue circles) groups, based on whether their protein levels were elevated or reduced in “mir-58” mutants. The circled data points represent the general correlation trend of the majority of data points within both groups. (D) Comparison of the extent of change in abundance at the protein and mRNA levels (proteinmir-58/wt/mRNAmir-58/wt) are depicted as box plots. The box plot marked with “*” differs significantly (P-value = 0.009, Kolmogorov-Smirnov test) from the random gene group. The RIP-chip candidates are also shown subdivided into the “RIP-chip (Protein ↑)” (log2 proteinmir-58/wt > 0) and “RIP-chip (Protein ↓)” (log2 proteinmir-58/wt < 0) groups. The bottom and the top of the boxes are the 25th and 75th percentile, respectively, while the whiskers represent the ninth and 91st percentile. The band within the box depicts the 50th percentile (median) and the “+” the mean value.
Surprisingly, the RIP-chip set contained not only a group of proteins that was substantially up-regulated in “mir-58” mutants (as expected for bantam/miR-58 targets) but also a group of proteins that showed a strong decrease in “mir-58” mutants when compared to the random group of proteins (P-value < 3 × 10⁻⁶, F-test) (see Methods for details; Fig. 3A). One possible explanation for this surprising result could be that the loss of bantam/miR-58 function induces secondary gene expression changes, such that some genes are generally expressed at lower levels in “mir-58” mutants. mRNAs from such genes would, if they are bound by the miRISCs, be picked up as false-positives, as their miRISC association would be strongly diminished in “mir-58” RIP-chips. However, such a change in total mRNA levels due to secondary effects should be clearly detectable if we compare the total mRNA levels between “wild-type” and “mir-58” animals. It should also be noted that such strong secondary mRNA abundance changes have been reported previously by Krützfeldt et al. (2005) who observed an equally strong up-regulation (potential direct targets) and down-regulation (secondary changes) of mRNAs following miRNA knockdown.
RIP-chip-SRM efficiently separates direct from indirect targets
To test this hypothesis, we compared the total mRNA levels between “mir-58” and “wild-type” animals with DNA microarrays (Supplemental Table S8). To relate changes in mRNA and protein levels, we further focused on those transcripts for which protein measurements by SRM were available (Fig. 3B; Supplemental Table S9). Transcript abundance changes for the TargetScan group were not statistically different from the random control group (P-value = 0.19, KS test) (Fig. 3B).
In contrast, a large fraction of the RIP-chip group of mRNAs was visibly less abundant in “mir-58” mutant animals, although still not significantly different from the random control group (P-value = 0.094, KS test) (Fig. 3B). However, comparing separately the mRNA changes of RIP-chip candidates whose protein levels were up-regulated (log2 proteinmir-58/wt > 0) and whose protein levels were down-regulated (log2 proteinmir-58/wt < 0) to the random control group, we saw a highly significant mRNA abundance change for the group of down-regulated RIP-chip candidates (P-value = 0.004, KS test) (Supplemental Fig. S3) but not for the up-regulated RIP-chip candidates (P-value = 0.726, KS test) (Supplemental Fig. S3). This strongly suggests that the reduction in mRNA levels was responsible for the reduced protein abundances that we previously observed by SRM, which was further supported when we plotted the observed mRNA and protein abundance changes for each analyzed gene. We, indeed, observed a fair and a highly significant correlation between mRNA and protein abundance changes for genes whose protein levels were decreased in “mir-58” mutants (R = 0.62, P-value = 0.0105, Pearson correlation) (Fig. 3C). In contrast, there was no correlation between mRNA and protein abundance changes among the candidates that were up-regulated in the “mir-58” mutants (R = 0.14, P-value = 0.511, Pearson correlation) (Fig. 3C).
Taken together, these results support the hypothesis that most, if not all, of the candidates which show reduced protein abundance in “mir-58” mutant animals are likely to be indirect targets of bantam/miR-58 and emphasize the importance of an independent validation strategy, like SRM, to separate direct from indirect hits.
Bantam/miR-58 targets identified by RIP-chip-SRM are mainly translationally regulated
Previous studies have suggested that miRNAs interfere with gene expression at multiple levels, including inhibition of translation and mRNA degradation (for review, see Filipowicz et al. 2008; Carthew and Sontheimer 2009; Huntzinger and Izaurralde 2011). To determine the relative contribution of these two modes of action, we compared the relative protein and mRNA abundance changes (“mir-58”/“wild type”). For both RIP-chip candidates and computationally predicted targets, the protein abundance changes were larger than the respective mRNA changes (Fig. 3D). Interestingly, if the indirect targets (log2 proteinmir-58/wt < 0) identified above are removed from the RIP-chip set and only the direct targets (log2 proteinmir-58/wt > 0) are considered, then the proteinmir-58/wt/mRNAmir-58/wt ratio is even higher (mean proteinmir-58/wt/mRNAmir-58/wt = 1.35-fold) and highly significantly different compared to the random group (P-value = 0.009, KS test) (Fig. 3D). In contrast, the indirect targets themselves show a good overall correlation between protein and mRNA changes (mean proteinmir-58/wt/mRNAmir-58/wt = 0.96).
Taken together, these results suggest that our original RIP-chip set consists of two distinct subgroups: indirect effect targets, whose reduced miRISC association in “mir-58” mutants stems from a reduction in their total mRNA abundance and which show a good correlation between mRNA and protein abundance changes (proteinmir-58/wt = 0.73; mRNAmir-58/wt = 0.76), and candidate direct bantam/miR-58 targets, which show no change at the mRNA level but a significant increase at the protein level in “mir-58” mutants (proteinmir-58/wt = 1.28; mRNAmir-58/wt = 0.95). This change in protein abundance without a corresponding change in mRNA abundance is consistent with the hypothesis that this set of candidate bantam/miR-58 targets is primarily regulated at the translational level. We obtained similar results with the set of computationally predicted bantam/miR-58 targets. In this group, we did, however, observe a weak but not statistically significant increase in mRNA abundance (Fig. 3B), contributing, on average, <50% to the gene expression changes. Therefore, the set of computationally predicted targets, although primarily regulated at the translational level, might also be controlled in part via mRNA degradation.
Targets identified by RIP-chip-SRM are enriched in evolutionarily conserved bantam/miR-58 seed binding sites
To independently confirm that the up-regulated RIP-chip-SRM candidates are, indeed, enriched in direct bantam/miR-58 targets, we asked whether the mRNAs for these targets contain possible bantam/miR-58 binding sites. We found that predicted bantam/miR-58 seed binding sites (7-mers, one mismatch allowed) were highly enriched in the 3′ UTRs of up-regulated (log2 proteinmir-58/wt > 0) RIP-chip-SRM mRNAs compared to the control mRNAs (P-value [seed binding site frequency] = 1.13 × 10⁻⁶, hypergeometric distribution) and present almost as frequently as in the group predicted by TargetScan (Fig. 4A,B; Supplemental Table S10). In contrast, the down-regulated (log2 proteinmir-58/wt < 0) RIP-chip-SRM candidates have a bantam/miR-58 seed site density similar to those of the random control group (see Fig. 4). The enrichment in bantam/miR-58 seed binding sites was also present if only perfect 7-mer sites were considered (Fig. 4C,D; Supplemental Table S10).
Figure 4.

Targets identified by RIP-chip-SRM are enriched in evolutionarily conserved bantam/miR-58 seed binding sites. The same data sets as in Figure 3A (bantam/miR-58 targets identified by RIP-chip, targets predicted by TargetScan, and random control group) were tested for the presence (A,C) and frequency (B,D) of imperfect (one mismatch allowed, A,B) and perfect (C,D) bantam/miR-58 7-mer seed binding sites in their 3′ UTRs and the predicted 3′ UTRs of their corresponding C. briggsae homologs. The RIP-chip candidates are shown subdivided into the “RIP-chip (Protein ↑)” (log2 proteinmir-58/wt > 0) and “RIP-chip (Protein ↓)” (log2 proteinmir-58/wt < 0) groups (as in Fig. 3C). P-values for the presence of bantam/miR-58 seed binding sites (A,C) were determined by a Fisher’s exact test (one-sided, with the random group as the null hypothesis). P-values for the frequency of bantam/miR-58 seed binding sites (B,D) were determined by hypergeomtric distribution (using the frequency of binding sites in the whole 3′ UTR-ome as the null hypothesis). (*) P < 0.05, (**) P < 0.01, (***) P < 0.001.
Importantly, bioinformatic analysis revealed a similar increase in seed binding site presence and frequency in the Caenorhabditis briggsae homologs of the up-regulated RIP-chip-SRM candidates (as compared to the control or down-regulated RIP-chip-SRM candidates) (Fig. 4A–D; Supplemental Table S11), suggesting an evolutionary pressure to maintain these sequences in the 3′ UTRs of the up-regulated RIP-chip-SRM genes.
Taken together, our results indicate that our RIP-chip-SRM approach efficiently identifies a subset of bona fide bantam/miR-58 targets, which are enriched in evolutionarily conserved bantam/miR-58 binding sites and regulated mainly at the translational level.
Discussion
We present here a novel approach, RIP-chip-SRM, to efficiently identify de novo high-confidence miRNA targets in C. elegans. RIP-chip-SRM combines two independent methods—RIP-chip of the miRISC for de novo discovery of potential primary miRNA targets, and a subsequent quantitative targeted proteomics analysis of the impact of miRNA depletion on the protein level of the potential miRNA targets. Our combinatorial approach readily separated direct from indirect targets, confirming the value of independent experimental validation strategies downstream from a RIP-chip assay. Moreover, SRM is able to capture even small protein changes (<1.25 fold) that cannot be measured reliably by immunoblotting or transgenic reporter lines (Jovanovic et al. 2010).
For all its value, our RIP-chip-SRM strategy also has some limitations. First, candidate miRNA targets can only be identified if they show a differential association with the miRISC between control and experimental conditions. This might become challenging with low-abundance or redundant miRNAs. This limitation can, at least, be partially alleviated through improved RISC-RIP approaches, such as those described recently in mammalian cell lines and C. elegans, where the RISC was cross-linked to its associated mRNA and the bound fragments were identified by high-throughput sequencing (CLIP-seq) (Chi et al. 2009; Hafner et al. 2010; Zisoulis et al. 2010). Recently, even in vivo photoactivatable ribonucleoside-enhanced CLIP (iPAR-CLIP) has been successfully applied to map the RNA binding sites of a C. elegans RBP (Jungkamp et al. 2011). Besides providing better resolution of the actual miRNA binding site, such protocols can be considered more sensitive and selective. Alternatively, overexpression (rather than depletion) of a specific miRNA could be used (Karginov et al. 2007; Hendrickson et al. 2008); however, such an approach might introduce experimental artifacts due to the ectopic expression of the miRNA.
A second technical limitation of our combined RIP-chip-SRM approach is that we could only quantify the protein levels of ∼40% of the candidates identified by RIP-chip. However, it must be considered that we quantified the protein levels in very complex, unfractionated samples generated from whole animal extracts. A reduction of sample complexity, e.g., fractionating peptides of a tryptic C. elegans digest by isoelectric focusing (Schrimpf et al. 2009), could potentially further boost the sensitivity of the targeted proteomics protocol by another order of magnitude, as has been reported in yeast (Picotti et al. 2009).
We compared in our study changes in protein and mRNA abundance in miRNA mutants in two distinct sets of potential miRNA targets: computationally predicted targets, selected based on the presence of an evolutionarily conserved perfect seed binding site (using TargetScan), and experimentally defined targets, identified through differential miRISC association. These two sets overlapped only to a limited extent (Fig. 3A). We believe that both sets are enriched in bona fide bantam/miR-58 targets, as both showed substantial protein abundance increases in “mir-58” mutants (Fig. 3A). Then why such a limited overlap? The low number of RIP-chip candidates in the TargetScan set is due to the fact that most of these mRNAs contain imperfect, rather than perfect, seed binding sites and thus would not have been selected by TargetScan (Fig. 4). Conversely, since we could show that many computationally predicted bantam/miR-58 targets are expressed and up-regulated in “mir-58” mutants, we conclude that the differential RIP-chip protocol used in this study only identified a fraction of all the C. elegans bantam/miR-58 targets. While technical improvements (see above) are likely to increase the yield of recovery, we conclude that, at least at the present time, computational prediction and experimental isolation are useful complementary approaches to identify miRNA targets.
Do the RIP-chip-SRM identified bantam/miR-58 targets give us any idea about the biological function of bantam/miR-58? Up-regulated RIP-chip-SRM candidates are enriched in terms such as “embryonic development,” “negative regulation of development,” “locomotion,” “metabolic processes,” and “multicellular organismal development” (Supplemental Table S12). Although it is not possible to assign specific biological functions to those general terms, they correlate well with the defects observed in the miR-58 family knockout, which, unlike the phenotypically wild-type mir-58 single mutant, does show defects such as reduced body size, defective dauer formation, and sluggish movement (Alvarez-Saavedra and Horvitz 2010). It is tempting to speculate that some of the bantam/miR-58 targets identified here are altered even more strongly in the family mutants and possibly responsible for the observed defects.
The experiments presented here not only allowed us to identify a set of high-confidence bantam/miR-58 targets but also provided some insight into the mechanism of miRNA regulation. For example, we found that protein abundance changes of bantam/miR-58 targets were generally substantially stronger than the corresponding mRNA changes (Fig. 3D). This effect was particularly strong for the RIP-chip-SRM- selected targets, as we detected no overall change in mRNA levels (Fig. 3B,C). These results suggest that the bantam/miR-58 targets analyzed in our study are regulated mainly at the translational level.
Our conclusion stands in contrast to that reached by a number of recent large-scale studies, which found a good correlation between protein and mRNA abundance changes following miRNA misexpression in mammalian cell lines, and thus concluded that miRNAs control their targets mainly through the regulation of mRNA stability (Baek et al. 2008; Hendrickson et al. 2009; Guo et al. 2010).
How can we explain this discrepancy? One possibility is that these studies focused on different subsets of miRNA targets. For example, our RIP-chip approach positively selects for stable mRNA targets, as strong target mRNA degradation would certainly diminish the recovery of the corresponding mRNA by RIP. We might, thus, have missed many bantam/miR-58 targets that are, in fact, regulated at the mRNA stability level. Conversely, most of the previous studies only analyzed target mRNAs that contain a perfect target seed binding site within their 3′ UTR (Baek et al. 2008; Guo et al. 2010). Interestingly, mRNAs with perfect bantam/miR-58 target seed binding sites, in fact, did show a slight abundance increase in our study, although smaller than measured for the protein levels (Fig. 3). It is, thus, possible to postulate that the extent of miRNA/target base-pairing might partially affect the fate of the bound mRNA.
The observed difference might also be of a technical nature. For example, a recent in vitro study in C. elegans by Wu et al. (2010) found that in extracts derived from embryos, miRNAs caused fast deadenylation of their respective target mRNAs, but the deadenylated target mRNAs were highly stable. Deadenylation of miRNA target mRNAs has also been reported in several other organisms (Filipowicz et al. 2008). As the large-scale studies mentioned above, which found that mRNA degradation explains most of the protein changes (Baek et al. 2008; Hendrickson et al. 2009; Guo et al. 2010), used only oligo(dT) primers to generate either the cDNA or amplify the RNA, these studies might have underestimated the abundance of deadenylated but stable mRNAs. In contrast, we used a combination of oligo(dT) and random nonamer primers for our study and thus would have amplified both polyA+ and polyA- mRNAs with similar efficiencies. Our observation of no overall change in mRNA levels is, thus, consistent with the results from Wu et al. (2010). Other technical issues, such as the limited dynamic range of microarrays, can be excluded, as both the bona fide bantam/miR-58 targets (whose mRNA expression did not change) and the indirect targets (which showed a good correlation between mRNA and protein change) were of similar abundance and in the middle of the dynamic range of the chips used (see Methods).
Finally, the difference might also have a biological basis. We used both a different species (C. elegans vs. mammals) and different starting material (whole animal vs. cell lines) for our study. It is possible that different modes of target regulation are used in different species, tissues, or growth conditions.
The main asset of our study is that we combined RIP-chip-based de novo target identification with targeted proteomics to validate these potential targets. The use of two orthogonal methodologies and selection criteria—only candidates that showed reduced mRNA abundance in the “mir-58” miRISCs but an overall increase in protein abundance were considered to be true targets—allowed for a robust pipeline. This robustness comes, of course, with a price in lost sensitivity, and we certainly missed some true targets, considering the noise and imperfection of large-scale methods. A solution to this dilemma might be to move from two to several, or even many, independent methodologies (e.g., prediction algorithms, mRNA profiling, RIP assays, proteomics assays, etc.) (for review, see Ørom and Lund 2010), in order to allow a move from strict AND gates to correlation-based selection. Machine learning and Bayesian networks would be well-suited for such an integrative approach, as was recently shown for the identification of Nova targets (Zhang et al. 2010). Implementing such an integrative approach for miRNA target identification has the potential to keep false-positive hits low despite a very high sensitivity, and this without the need for new technology. Here, we showed that at least two large-scale approaches can be easily coupled. We are confident that the further integration of additional, currently available approaches, in combination with appropriate bioinformatics, will lead to a much improved target discovery process than has been possible so far.
Methods
Mutations and strains
Methods for culturing C. elegans strains have been described previously (Brenner 1974). All strains were grown at 20°C or 25°C. All mutants used in this study were derived from the wild-type variety Bristol strain N2. The following mutations and transgenes were used: LGIII: unc-119(ed3), LGIV: mir-58(n4640), LGX: alg-1(tm492), Transgene: opIs205(Peft-3::TAPtag::alg-1[genomics+3′ UTR]; unc-119[+]). unc-119(ed3) is described in Riddle et al. (1997) and mir-58(n4640) in Miska et al. (2007). The alg-1(tm492) mutant was obtained from the laboratory of Dr. S. Mitani at Tokyo Women’s Medical University Hospital and out-crossed four times. The 610-bp deletion was confirmed by PCR amplification.
Plasmid constructs and generation of transgenic animals
The coding sequence for the N-terminal tandem affinity purification (TAP)-tag was amplified from plasmid pBS1761 (Rigaut et al. 1999) by PCR. The alg-1 genomic sequence was amplified from genomic C. elegans DNA by PCR. The sequences were tagged with the following restriction sites: 5′AscI:TAP-tag:3′FseI; 5′FseI:alg-1 (genomic+3′ UTR):3′PacI. The tagged fragments were subcloned into the pCR2.1 TOPO vector (Invitrogen). Both constructs were then inserted into pLN022 (Neukomm et al. 2011) to generate the final expression vector pMJ001, where TAP::ALG-1 expression is under the control of the ubiquitous eft-3 promoter. Low-copy transgenic animals were generated by bombardment as previously described (Praitis et al. 2001). The protocol was adapted as follows: unc-119(ed3) mutant worms were grown in liquid culture. pMJ001 was precipitated onto gold beads and shot at unc-119(ed3) mutant worms using a Biolistic PDS-1000 bombardment apparatus (Bio-Rad). Bombarded worms were distributed onto large seeded plates and left to starve. Starved worms were chunked onto fresh seeded plates and screened for unc–119(+) transgenic animals. Rescued worms that expressed TAP::ALG-1 were kept and analyzed. All further experiments were done with the integrant opIs205(Peft-3::TAPtag::alg-1[genomics+3′ UTR]; unc-119[+]).
The transgenic line carrying opIs205 was crossed into alg-1(tm492) mutant animals to generate the strain WS4303 (alg-1(tm492); opIs205). The opIs205 transgene successfully rescued the reduced brood size of homozygous alg-1(tm492) mutant animals, proving the functionality of our transgene (data not shown).
WS4303 was also crossed into mir-58(n4640) animals to generate the strain WS5041 (mir-58(n4640); alg-1(tm492); opIs205). All experiments were performed with N2 wild-type animals and/or WS4303 transgenic animals and/or WS5041 transgenic animals.
Sample generation
Transgenic animals and control animals were always grown in parallel in either liquid culture or on plates for each biological replicate. For the generation of a large population of mixed-stage animals, the worms were grown in liquid culture at 20°C as described previously (Stiernagle 2006). Only N2 and WS4303 strains were used to generate samples derived from mixed-stage populations. For synchronized late L4 stage cultures of transgenic animals, eggs were isolated by bleaching (Stiernagle 2006). The purified eggs were allowed to hatch overnight on large unseeded NGM plates. Synchronized L1 larvae were then spotted onto large NGM plates seeded with OP50 and grown at 25°C until late L4 stage (36 h). Only the two transgenic lines, WS4303 and WS5041, were used to generate samples derived from synchronized late L4 animals.
RNA immunopurification of TAP::ALG-1 and associated RNAs
RNA immunopurifications (RIPs) have been described previously (Gerber et al. 2004). We have adapted the protocol accordingly. In brief, after harvesting, worms were separated from the bacteria by several washes in ice-cold buffer A (20 mM Tris–HCl [pH 8.0], 140 mM KCl, 1.8 mM MgCl2, 0.1% Nonidet P-40 (NP-40), 0.1 mg/mL heparin) and frozen in liquid nitrogen and stored at −80°C until further use. One mL of frozen worm pellet was resuspended in 5 mL buffer B (buffer A plus 1.5 mM dithiothreitol [DTT], 1 mM phenylmethylsulfonylfluoride, 0.5 μg/mL leupeptin, 0.8 μg/mL pepstatin, 20 U/mL DNase I, 100 U/mL RNaseOUT [Invitrogen], and 0.2 mg/mL heparin). The resuspended worms were drop-wise refrozen in liquid nitrogen and homogenized by a TissueLyser instrument (Qiagen) by four cycles of 4 min each with a setting of 30 Hz; the metal chars (50 mL) containing the samples were always refrozen in liquid nitrogen between the cycles. The worm lysates were clarified by sequential centrifugation steps, and the purified extracts were incubated on a rotor with 400 μl slurry (50% [v/v]) IgG–agarose beads (Sigma) for 2 h at 4°C. The beads were washed four times for 15 min at 4°C with buffer C (20 mM Tris–HCl [pH 8.0], 140 mM KCl, 1.8 mM MgCl2, 1 mM DTT, 0.01% NP-40, 10 U/mL RNasin). ALG-1 was released from the beads by incubation with 100 U of TEV protease (Invitrogen) for 90 min at 25°C.
RNA was isolated from the TEV eluates (purified fraction) and from extracts (input) by extraction with the miRVana kit (Ambion) according to the vendor’s instructions. RNA was quantified with a Nanodrop device (Witeg AG).
Microarray analysis of mixed-stage populations
RNA isolated from WS4303 and N2 (mock control) animals was analyzed for each IP sample and for each total worm extract sample. Three independent biological replicates have been performed. Long-oligo whole-genome C. elegans arrays, produced by the Genome Sequencing Center at Washington University in St. Louis, were used for analysis of the mixed-stage samples.
Microarray analysis was performed as described in Gerber et al. (2004) with a few adjustments. In brief, equal amounts of a pool of 10 synthetically prepared Arabidopsis thaliana RNAs (Stratagene) were added to each RNA sample prior to labeling and served as a control for the labeling procedure. cDNA was synthesized with amino-allyl dUTP in addition to the four natural dNTPs, using a 1:1 mixture of oligo(dT) and random nonamer primers. cDNAs synthesized from total RNA (12 μg) derived from the extract and 1 μg of affinity-isolated RNA (or up to 50% of the isolated RNA if <2 μg have been isolated) were labeled with Cy3 and Cy5 fluorescent dyes, respectively. The Cy3- and Cy5-labeled cDNA samples were mixed and competitively hybridized to the DNA microarrays mentioned above according to the manufacturer’s instructions. Microarrays were scanned with an Axon Instruments Scanner 4200A (Molecular Devices). Scanning parameters were adjusted to similar fluorescent intensities for A. thaliana spots in both channels. Data were collected with the GENEPIX 5.1 Program (Molecular Devices). Spots with abnormal morphology were excluded from further analysis. Arrays were computer normalized by the GENEPIX 5.1 Program (default setting of the program was used: for normalization only oligo probes that had a Cy3-to-Cy5 ratio between 0.1 and 10 were considered) and exported to Acuity 4.0 for further analysis. The data were filtered for signal over background levels greater than three in the channel measuring cDNA from total extract (Cy3 channel), and only features that met these criteria in 80% (= at least 5 out of 6) of the arrays were analyzed further. Log2 ratios (immunopurified RNA over total RNA from extract) were calculated for each gene. Microarrays generated from WS4303 animals were compared to microarrays generated from N2 mock control animals by a Student’s two sample t-test.
Microarray analysis of synchronized late L4 stage worms
Strains WS4303 and WS5041 were used for TAP::ALG-1 IPs. All experiments were conducted in three independent replicates. For each replicate, WS4303 and WS5041 were grown in parallel. 150 ng of TAP::ALG-1 associated RNA isolated from synchronized late L4 animals were sent to the GeneCore facilty in Heidelberg, Germany (http://www.genecore.embl.de/index.cfm), and the microarray data were generated according to their standard protocol (Weinmann et al. 2009). In brief, 100 ng of RNA were amplified by the MessageAmp aRNA Kit (Ambion) in a two-cycle protocol as recommended by the vendor. Amplified RNA was processed and hybridized with the Gene Chip (Affymetrix) kit according to the manufacturer’s instructions. Samples were hybridized to C. elegans Genome arrays from Affymetrix. Microarray data were preprocessed using the rma algorithm of the Bioconductor package affy (Gautier et al. 2004). To identify transcripts that were specifically enriched by association to TAP::ALG-1 isolated from WS4303 animals compared to WS5041 animals, we performed a two-class paired significance analysis of microarrays (SAM) (Tusher et al. 2001).
Microarray analysis of WS4303 total mRNA versus WS5041 total mRNA
Total RNA was isolated from the same WS4303 and WS5041 total extracts that was further used for the ALG-1 RIP. Three independent biological replicates were analyzed. Long-oligo whole-genome C. elegans arrays, produced by the Genome Sequencing Center at Washington University in St. Louis, were used for these experiments. Sample preparation and microarray scanning was performed as in the microarray analysis of mixed-stage populations (see above). A total of 10 μg of total RNA was used for cDNA synthesis. WS4303 and WS5041samples were always labeled with the Cy3 and Cy5 dye, respectively. After scanning with an Axon Instruments Scanner 4200A (Molecular Devices), the data was analyzed with MAGMA (Rehrauer et al. 2007), which is a convenient web interface for preprocessing and differential expression computation using the Bioconductor package limma (Smyth 2005; Supplemental Table S8).
The average expression values for all three experimental groups (computationally predicted, bona fide RIP-chip-SRM targets and secondary targets) are exactly in the middle of the dynamic range window of our microarrays (log2 dynamic range = 8–15.9, mean = 9.7, median = 9.3, log2 values = 9.8, 10.2, and 10.5, respectively), and therefore, small changes, as we have measured on the protein level, should be accurately captured. Indeed, the RIP-chip candidates that turned out to be indirect targets due to the reduced protein abundance in the “mir-58” mutants showed a fair and significant correlation between the protein and mRNA abundance changes (R = 0.62, P-value = 0.0105, Pearson correlation) (Fig. 3C), indicating that the microarrays can capture for the small protein changes measured by SRM corresponding mRNA changes if they are present.
miRNA expression profiling by microarray analysis
Total worm extracts from the same mixed-stage WS4303 and N2 populations were used as in the microarray analysis of mixed-stage populations (see above). Three independent biological replicates of each strain were analyzed. miRNA expression profiling was performed by using custom DNA oligonucleotide arrays as described in Miska et al. (2004) and Lehrbach et al. (2009). In brief, total RNA was extracted using a standard TRIzol (Invitrogen) protocol. miRNAs were isolated from 5 μg of total RNA using denaturing PAGE and excised from the gel by size selection using 18- to 26-nt markers. The small RNA fraction was then 3′ end-labeled using T4 RNA ligase (Fermentas UK) and hybridized to the slides.
miRNA seed enrichment analysis in mixed-stage animals
The data generated by the mixed-stage samples (mRNA and miRNA expression data) were used to investigate the enrichment of miRNA seeds in TAP::ALG-1-associated mRNAs. The analysis was conducted as described in Landthaler et al. (2008). The 3′ UTR sequences were obtained from Mangone et al. (2010). Briefly, we grouped the miRNAs according to their expression signals on the microarray, the TOP 1 group constituting the seeds of the five most highly expressed miRNAs, TOP 2 the seeds of the next five most highly expressed miRNAs, and TOP 3 the next five most highly expressed seeds (TOP 1–TOP 3, Supplemental Table S13). Our control groups always contained seeds of five C. elegans miRNAs that were not detected in our samples (CTL 1–CTL 3, Supplemental Table S13). The density of sites complementary to the miRNA seeds in the 3′ UTR of the enriched mRNAs was compared with the density of these motifs in a set of size-matched 3′ UTRs of control transcripts that were not enriched in the IP but were expressed in our samples and detected in the total extract. A value of 1 indicates no enrichment of seed complementary sites in the immunopurified mRNAs and would strongly suggest that we did not enrich for bona fide miRNA targets. By performing these analyses repeatedly with random selections of control transcripts, we obtained an estimate of the variance in the calculated enrichment of seed-complementary sites. We compared the enrichment of targets for the most highly expressed miRNAs (TOP 1–TOP 3) to that calculated for random subsets of miRNAs that were not expressed in our C. elegans samples (CTL 1–CTL 3) (Landthaler et al. 2008). We defined mRNAs significantly enriched in our IPs and, therefore, as potential miRNA targets when they fulfilled certain P-value cutoffs and also certain signal-to-noise ratio cutoffs in the Cy5 channel (immunopurified mRNAs) of the microarrays. Different cutoffs were applied to define the targets and tested for the seed enrichment.
Bantam/miR-58 target enrichment analysis
The RIP-chip data generated from the WS4031 (“wild type”) and WS5041 (“mir-58”) samples were used (see above) to investigate the enrichment of bantam/miR-58 targets in TAP::ALG-1-associated mRNAs from WS4031 animals when compared to WS5041 animals. 3′ UTR sequences for C. elegans were obtained from Mangone et al. (2010). For all 3′ UTRs, the occurrences of either the 7-mer “CGATCTC” or “GATCTCA” (complementary miR-58 seed binding sites) were counted, with either a perfect match or one mismatch being allowed. We determined the distribution of these potential bantam/miR-58 seed binding sites for all genes either depleted (log2 RIP“mir-58”/“wild type” < 0) or enriched (log2 RIP“mir-58”/“wild type” > 0) in “mir-58” RIPs. Moreover, we determined the distribution of these potential bantam/miR-58 seed binding sites among genes that were either significantly depleted or enriched in the “mir-58” RIPs (FDR < 5%, SAM).
Mass spectrometry
Sample preparation, SRM measurements, and analysis by mProphet (Reiter et al. 2011) were exactly performed as described in Jovanovic et al. (2010). The only difference was that not only SRM assays and quantifications of peptides of the random group of proteins and of TargetScan predicted proteins were measured and analyzed but also of the group of RIP-chip candidates (see Supplemental Table S6). The list of peptides that were ordered for SRM assay development and the SRM transition list used for quantifications are available in Supplemental Tables S14 and S15, respectively.
Statistical analysis of the protein changes of the RIP-chip candidates
We used an F-test to compare the protein response of all the RIP-chip candidates together, the up-regulated and down-regulated ones, to the random control group upon miR-58 knockdown. We did an F-test because when we compared the cumulative fraction plots of the whole RIP-chip group with the random control group, we noticed that the means of both groups are very similar (mean log2 proteinmir-58/wt [RIP-chip] = 0.033, mean log2 proteinmir-58/wt [random] = 0.071), but the RIP-chip candidates showed stronger (both up- and down-regulated candidates) protein changes. This finding is also reflected by the substantially higher standard deviations of the RIP-chip candidates compared to the random control group (standard deviation log2 proteinmir-58/wt [RIP-chip] = 0.49, standard deviation log2 proteinmir-58/wt [random] = 0.17). A KS test (goodness of fit, where the null hypothesis is a normal distribution) further indicated that the log2 ratio changes in both groups are most likely normally distributed (P-value [RIP-chip group] = 0.63, P-value [random group] = 0.78). Therefore, we applied an F-test to show that the standard deviations of the protein responses of the RIP-chip candidates were significantly different from the random group upon miR-58 deletion (in other words, the RIP-chip candidates show stronger protein responses [up- and down-regulated] upon miR-58 knockout than the random control group), as it is a well-established and very sensitive statistical test to compare standard deviations of normal distribution.
Bantam/miR-58 seed binding site analysis for all SRM-quantified candidates
3′ UTR sequences for C. elegans were obtained from Mangone et al. (2010) (Supplemental Table S10). For C. briggsae, 3′ UTR sequences, defined as the first 250 bp downstream from the gene, were downloaded from WormMart (WormBase.org, release 215; Supplemental Table S11). Orthology information was also downloaded from WormMart (WormBase.org, release 215). For all 3′ UTRs, the occurrences of either the 7-mer “CGATCTC” or “GATCTCA” (complementary miR-58 seed binding sites) were counted, with either a perfect match or one mismatch being allowed. Frequencies per 100 bp were calculated based on the length of 3′ UTR sequences.
GO term assignment analysis
The Gene Ontology website (http://www.geneontology.org/) was used for GO term assignments for all up-regulated RIP-chip-SRM targets as well as for background distributions (the whole C. elegans genome). The P-values were determined by hypergeometric distribution and were subsequently Bonferroni-corrected.
Data access
Array data have been submitted to the NCBI Gene Expression Omnibus (GEO) (http://www.ncbi.nlm.nih.gov/geo/) under accession number GSE32944.
Acknowledgments
We thank M. Zavolan (Biozentrum Basel, University of Basel, Basel, Switzerland) and D. Gaidatzis (Friedrich Miescher Institute for Biomedical Research [FMI], Basel, Switzerland) for critical help with data analysis. We thank R. Ketting (Hubrecht Institute, Utrecht, Netherlands) and B. Tops (Utrecht University, Utrecht, Netherlands) for providing the metabolically labeled C. elegans sample, and T. Ivacevic (GeneCore facility in Heidelberg, Germany) for generating the Affymetrix microarray data. We also thank H. Großhans (FMI, Basel, Switzerland) for insightful discussion and critical comments on the manuscript, and O. Rinner (Biognosys AG, Zurich, Switzerland) for important help with the SRM data analysis. Additionally, we thank A. Stark (Research Institute of Molecular Pathology, Vienna, Austria) for sharing miRNA target predictions for C. elegans; B. Roschitzky and B. Gerrits for technical support; R. Schlapbach for access to the Functional Genomics Center Zurich; the Hengartner, Aebersold, Gerber, Simard, and Miska laboratories; and Erich Brunner and the whole Q-MOP team for insightful discussion and comments on the manuscript. This work was funded in part by the University of Zurich Research Priority Program in Systems Biology/Functional Genomics, the Swiss National Science Foundation (grant no. SNF 31003A-130530), the European Research Council (grant no. ERC-2008-AdG 233226 to R.A.), the GEBERT RÜF Foundation, SystemsX, the Swiss Initiative for Systems Biology, the Ernst Hadorn Foundation, and the ETH Zurich. A.P.G. acknowledges support from the Human Frontier Science Program Organization, the ETH Zurich, and the Bonizzi-Theler Foundation. M.J.S. is funded in part by the Natural Sciences and Engineering Research Council of Canada, and is a Canadian Institutes of Health Research New Investigator. E.A.M. was supported by a Programme Grant from the Cancer Research UK. M.J. and L.R. were supported by a grant from the Research Foundation of the University of Zurich. M.J. was also supported by a fellowship from the Roche Research Foundation. P.P. is a recipient of a Marie Curie Intra-European fellowship.
Author contributions: M.J., M.O.H., A.P.G., and R.A. designed the experiments and wrote the paper. L.R., M.W., and M.J. did the majority of the data analysis. M.J. did the majority of the experiments. A.C. did the miRNA expression analysis and contributed to the RIP-chip assays. P.P. contributed to and supervised the SRM experiments. H.R. contributed to the microarray analysis. A.F., L.J.N., and E.K. contributed to the generation of the C. elegans strains. B.W., M.J.S., and E.A.M. provided critical input on the manuscript and contributed significantly to the experimental design and the data analysis. M.O.H., A.P.G., and R.A. supervised the whole project.
Footnotes
[Supplemental material is available for this article.]
Article published online before print. Article, supplemental material, and publication date are at http://www.genome.org/cgi/doi/10.1101/gr.133330.111.
Freely available online through the Genome Research Open Access option.
References
- Alvarez-Saavedra E, Horvitz HR 2010. Many families of C. elegans microRNAs are not essential for development or viability. Curr Biol 20: 367–373 [DOI] [PMC free article] [PubMed] [Google Scholar]
- Baek D, Villén J, Shin C, Camargo FD, Gygi SP, Bartel DP 2008. The impact of microRNAs on protein output. Nature 455: 64–71 [DOI] [PMC free article] [PubMed] [Google Scholar]
- Bagga S, Bracht J, Hunter S, Massirer K, Holtz J, Eachus R, Pasquinelli AE 2005. Regulation by let-7 and lin-4 miRNAs results in target mRNA degradation. Cell 122: 553–563 [DOI] [PubMed] [Google Scholar]
- Bartel DP 2004. MicroRNAs: Genomics, biogenesis, mechanism, and function. Cell 116: 281–297 [DOI] [PubMed] [Google Scholar]
- Bartel DP 2009. MicroRNAs: Target recognition and regulatory functions. Cell 136: 215–233 [DOI] [PMC free article] [PubMed] [Google Scholar]
- Beitzinger M, Peters L, Zhu JY, Kremmer E, Meister G 2007. Identification of human microRNA targets from isolated argonaute protein complexes. RNA Biol 4: 76–84 [DOI] [PubMed] [Google Scholar]
- Brenner S 1974. The genetics of Caenorhabditis elegans. Genetics 77: 71–94 [DOI] [PMC free article] [PubMed] [Google Scholar]
- Carthew RW, Sontheimer EJ 2009. Origins and mechanisms of miRNAs and siRNAs. Cell 136: 642–655 [DOI] [PMC free article] [PubMed] [Google Scholar]
- Chi SW, Zang JB, Mele A, Darnell RB 2009. Argonaute HITS-CLIP decodes microRNA-mRNA interaction maps. Nature 460: 479–486 [DOI] [PMC free article] [PubMed] [Google Scholar]
- Croce CM 2009. Causes and consequences of microRNA dysregulation in cancer. Nat Rev Genet 10: 704–714 [DOI] [PMC free article] [PubMed] [Google Scholar]
- Easow G, Teleman AA, Cohen SM 2007. Isolation of microRNA targets by miRNP immunopurification. RNA 13: 1198–1204 [DOI] [PMC free article] [PubMed] [Google Scholar]
- Filipowicz W, Bhattacharyya SN, Sonenberg N 2008. Mechanisms of post-transcriptional regulation by microRNAs: Are the answers in sight? Nat Rev Genet 9: 102–114 [DOI] [PubMed] [Google Scholar]
- Gautier L, Cope L, Bolstad BM, Irizarry RA 2004. affy–analysis of Affymetrix GeneChip data at the probe level. Bioinformatics 20: 307–315 [DOI] [PubMed] [Google Scholar]
- Gerber AP, Herschlag D, Brown PO 2004. Extensive association of functionally and cytotopically related mRNAs with Puf family RNA-binding proteins in yeast. PLoS Biol 2: E79 doi: 10.1371/journal.pbio.0020079 [DOI] [PMC free article] [PubMed] [Google Scholar]
- Griffiths-Jones S, Saini HK, Dongen SV, Enright AJ 2007. miRBase: Tools for microRNA genomics. Nucleic Acids Res 36: D154–D158 [DOI] [PMC free article] [PubMed] [Google Scholar]
- Grosshans H, Johnson T, Reinert K, Gerstein M, Slack F 2005. The temporal patterning microRNA regulates several transcription factors at the larval to adult transition in C. elegans. Dev Cell 8: 321–330 [DOI] [PubMed] [Google Scholar]
- Guo H, Ingolia NT, Weissman JS, Bartel DP 2010. Mammalian microRNAs predominantly act to decrease target mRNA levels. Nature 466: 835–840 [DOI] [PMC free article] [PubMed] [Google Scholar]
- Hafner M, Landthaler M, Burger L, Khorshid M, Hausser J, Berninger P, Rothballer A, Ascano M, Jungkamp A-C, Munschauer M, et al. 2010. Transcriptome-wide identification of RNA-binding protein and microRNA target sites by PAR-CLIP. Cell 141: 129–141 [DOI] [PMC free article] [PubMed] [Google Scholar]
- Hendrickson DG, Hogan DJ, Herschlag D, Ferrell JE, Brown PO, Bähler J 2008. Systematic identification of mRNAs recruited to Argonaute 2 by specific microRNAs and corresponding changes in transcript abundance. PLoS ONE 3: e2126 doi: 10.1371/journal.pone.0002126 [DOI] [PMC free article] [PubMed] [Google Scholar]
- Hendrickson DG, Hogan DJ, McCullough HL, Myers JW, Herschlag D, Ferrell JE, Brown PO 2009. Concordant regulation of translation and mRNA abundance for hundreds of targets of a human microRNA. PLoS Biol 7: e1000238 doi: 10.1371/journal.pbio.1000238 [DOI] [PMC free article] [PubMed] [Google Scholar]
- Huntzinger E, Izaurralde E 2011. Gene silencing by microRNAs: Contributions of translational repression and mRNA decay. Nat Rev Genet 12: 99–110 [DOI] [PubMed] [Google Scholar]
- Hutvagner G, Simard MJ 2008. Argonaute proteins: Key players in RNA silencing. Nat Rev Mol Cell Biol 9: 22–32 [DOI] [PubMed] [Google Scholar]
- Jovanovic M, Hengartner MO 2006. miRNAs and apoptosis: RNAs to die for. Oncogene 25: 6176–6187 [DOI] [PubMed] [Google Scholar]
- Jovanovic M, Reiter L, Picotti P, Lange V, Bogan E, Hurschler BA, Blenkiron C, Lehrbach NJ, Ding XC, Weiss M, et al. 2010. A quantitative targeted proteomics approach to validate predicted microRNA targets in C. elegans. Nat Methods 7: 837–842 [DOI] [PMC free article] [PubMed] [Google Scholar]
- Jungkamp A-C, Stoeckius M, Mecenas D, Grün D, Mastrobuoni G, Kempa S, Rajewsky N 2011. In vivo and transcriptome-wide identification of RNA binding protein target sites. Mol Cell 44: 828–840 [DOI] [PMC free article] [PubMed] [Google Scholar]
- Karginov FV, Conaco C, Xuan Z, Schmidt BH, Parker JS, Mandel G, Hannon GJ 2007. A biochemical approach to identifying microRNA targets. Proc Natl Acad Sci 104: 19291–19296 [DOI] [PMC free article] [PubMed] [Google Scholar]
- Kato M, de Lencastre A, Pincus Z, Slack FJ 2009. Dynamic expression of small non-coding RNAs, including novel microRNAs and piRNAs/21U-RNAs, during Caenorhabditis elegans development. Genome Biol 10: R54 doi: 10.1186/gb-2009-10-5-r54 [DOI] [PMC free article] [PubMed] [Google Scholar]
- Krützfeldt J, Rajewsky N, Braich R, Rajeev KG, Tuschl T, Manoharan M, Stoffel M 2005. Silencing of microRNAs in vivo with “antagomirs.” Nature 438: 685–689 [DOI] [PubMed] [Google Scholar]
- Lall S, Grun D, Krek A, Chen K, Wang Y, Dewey C, Sood P, Colombo T, Bray N, Macmenamin P 2006. A genome-wide map of conserved microRNA targets in C. elegans. Curr Biol 16: 460–471 [DOI] [PubMed] [Google Scholar]
- Landthaler M, Gaidatzis D, Rothballer A, Chen PY, Soll SJ, Dinic L, Ojo T, Hafner M, Zavolan M, Tuschl T 2008. Molecular characterization of human Argonaute-containing ribonucleoprotein complexes and their bound target mRNAs. RNA 14: 2580–2596 [DOI] [PMC free article] [PubMed] [Google Scholar]
- Lange V, Malmström JA, Didion J, King NL, Johansson BP, Schäfer J, Rameseder J, Wong C-H, Deutsch EW, Brusniak M-Y, et al. 2008a. Targeted quantitative analysis of Streptococcus pyogenes virulence factors by multiple reaction monitoring. Mol Cell Proteomics 7: 1489–1500 [DOI] [PMC free article] [PubMed] [Google Scholar]
- Lange V, Picotti P, Domon B, Aebersold R 2008b. Selected reaction monitoring for quantitative proteomics: A tutorial. Mol Syst Biol 4: 222 doi: 10.1038/msb.2008.61 [DOI] [PMC free article] [PubMed] [Google Scholar]
- Lee RC, Feinbaum RL, Ambros V 1993. The C. elegans heterochronic gene lin-4 encodes small RNAs with antisense complementarity to lin-14. Cell 75: 843–854 [DOI] [PubMed] [Google Scholar]
- Lehrbach NJ, Armisen J, Lightfoot HL, Murfitt KJ, Bugaut A, Balasubramanian S, Miska EA 2009. LIN-28 and the poly(U) polymerase PUP-2 regulate let-7 microRNA processing in Caenorhabditis elegans. Nat Struct Mol Biol 16: 1016–1020 [DOI] [PMC free article] [PubMed] [Google Scholar]
- Lewis BP, Burge CB, Bartel DP 2005. Conserved seed pairing, often flanked by adenosines, indicates that thousands of human genes are microRNA targets. Cell 120: 15–20 [DOI] [PubMed] [Google Scholar]
- Lim LP, Lau NC, Garrett-Engele P, Grimson A, Schelter JM, Castle J, Bartel DP, Linsley PS, Johnson JM 2005. Microarray analysis shows that some microRNAs downregulate large numbers of target mRNAs. Nature 433: 769–773 [DOI] [PubMed] [Google Scholar]
- Mangone M, Manoharan AP, Thierry-Mieg D, Thierry-Mieg J, Han T, Mackowiak S, Mis E, Zegar C, Gutwein MR, Khivansara V, et al. 2010. The landscape of C. elegans 3′UTRs. Science 329: 432–435 [DOI] [PMC free article] [PubMed] [Google Scholar]
- Miska EA, Alvarez-Saavedra E, Townsend M, Yoshii A, Sestan N, Rakic P, Constantine-Paton M, Horvitz HR 2004. Microarray analysis of microRNA expression in the developing mammalian brain. Genome Biol 5: R68 doi: 10.1186/gb-2004-5-9-r68 [DOI] [PMC free article] [PubMed] [Google Scholar]
- Miska EA, Alvarez-Saavedra E, Abbott AL, Lau NC, Hellman AB, McGonagle SM, Bartel DP, Ambros VR, Horvitz HR 2007. Most Caenorhabditis elegans microRNAs are individually not essential for development or viability. PLoS Genet 3: e215 doi: 10.1371/journal.pgen.0030215 [DOI] [PMC free article] [PubMed] [Google Scholar]
- Neukomm LJ, Frei AP, Cabello J, Kinchen JM, Zaidel-Bar R, Ma Z, Haney LB, Hardin J, Ravichandran KS, Moreno S, et al. 2011. Loss of the RhoGAP SRGP-1 promotes the clearance of dead and injured cells in Caenorhabditis elegans. Nat Cell Biol 13: 79–86 [DOI] [PMC free article] [PubMed] [Google Scholar]
- Ørom UA, Lund AH 2010. Experimental identification of microRNA targets. Gene 451: 1–5 [DOI] [PubMed] [Google Scholar]
- Papadopoulos GL, Reczko M, Simossis VA, Sethupathy P, Hatzigeorgiou AG 2009. The database of experimentally supported targets: A functional update of TarBase. Nucleic Acids Res 37: D155–D158 [DOI] [PMC free article] [PubMed] [Google Scholar]
- Picotti P, Lam H, Campbell D, Deutsch EW, Mirzaei H, Ranish J, Domon B, Aebersold R 2008. A database of mass spectrometric assays for the yeast proteome. Nat Methods 5: 913–914 [DOI] [PMC free article] [PubMed] [Google Scholar]
- Picotti P, Bodenmiller B, Mueller LN, Domon B, Aebersold R 2009. Full dynamic range proteome analysis of S. cerevisiae by targeted proteomics. Cell 138: 795–806 [DOI] [PMC free article] [PubMed] [Google Scholar]
- Picotti P, Rinner O, Stallmach R, Dautel F, Farrah T, Domon B, Wenschuh H, Aebersold R 2010. High-throughput generation of selected reaction-monitoring assays for proteins and proteomes. Nat Methods 7: 43–46 [DOI] [PubMed] [Google Scholar]
- Praitis V, Casey E, Collar D, Austin J 2001. Creation of low-copy integrated transgenic lines in Caenorhabditis elegans. Genetics 157: 1217–1226 [DOI] [PMC free article] [PubMed] [Google Scholar]
- Rehrauer H, Zoller S, Schlapbach R 2007. MAGMA: Analysis of two-channel microarrays made easy. Nucleic Acids Res 35: W86–W90. [DOI] [PMC free article] [PubMed] [Google Scholar]
- Reiter L, Rinner O, Picotti P, Hüttenhain R, Beck M, Brusniak M-Y, Hengartner M O, Aebersold R 2011. mProphet: Automated data processing and statistical validation for large-scale SRM experiments. Nat Methods 8: 430–435 [DOI] [PubMed] [Google Scholar]
- Riddle DL, Blumenthal T, Meyer BJ, Priess JR 1997. C. elegans II. Cold Spring Harbor Laboratory Press, Cold Spring Harbor, NY [Google Scholar]
- Rigaut G, Shevchenko A, Rutz B, Wilm M, Mann M, Séraphin B 1999. A generic protein purification method for protein complex characterization and proteome exploration. Nat Biotechnol 17: 1030–1032 [DOI] [PubMed] [Google Scholar]
- Ruby J, Jan C, Player C, Axtell M, Lee W, Nusbaum C, Ge H, Bartel D 2006. Large-scale sequencing reveals 21U-RNAs and additional microRNAs and endogenous siRNAs in C. elegans. Cell 127: 1193–1207 [DOI] [PubMed] [Google Scholar]
- Schrimpf SP, Weiss M, Reiter L, Ahrens CH, Jovanovic M, Malmström J, Brunner E, Mohanty S, Lercher MJ, Hunziker PE, et al. 2009. Comparative functional analysis of the Caenorhabditis elegans and Drosophila melanogaster proteomes. PLoS Biol 7: e48 doi: 10.1371/journal.pbio.1000048 [DOI] [PMC free article] [PubMed] [Google Scholar]
- Selbach M, Schwanhäusser B, Thierfelder N, Fang Z, Khanin R, Rajewsky N 2008. Widespread changes in protein synthesis induced by microRNAs. Nature 455: 58–63 [DOI] [PubMed] [Google Scholar]
- Smyth G. 2005 limma: Linear models for microarray data. In Bioinformatics and computational biology solutions using R and Bioconductor (Statistics for biology and health) (ed. R Gentleman et al.), pp. 397–420. Springer, New York. [Google Scholar]
- Stark A, Brennecke J, Bushati N, Russell R, Cohen S 2005. Animal microRNAs confer robustness to gene expression and have a significant impact on 3′UTR evolution. Cell 123: 1133–1146 [DOI] [PubMed] [Google Scholar]
- Stefani G, Slack FJ 2008. Small non-coding RNAs in animal development. Nat Rev Mol Cell Biol 9: 219–230 [DOI] [PubMed] [Google Scholar]
- Stiernagle T. 2006. http://www.wormbook.org Maintenance of C. elegans. In WormBook: The online review of C. elegans biology (ed. The C. elegans Research Community).
- Storey JD, Tibshirani R 2003. Statistical significance for genomewide studies. Proc Natl Acad Sci 100: 9440–9445 [DOI] [PMC free article] [PubMed] [Google Scholar]
- Tusher VG, Tibshirani R, Chu G 2001. Significance analysis of microarrays applied to the ionizing radiation response. Proc Natl Acad Sci 98: 5116–5121 [DOI] [PMC free article] [PubMed] [Google Scholar]
- Vinther J, Hedegaard MM, Gardner PP, Andersen JS, Arctander P 2006. Identification of miRNA targets with stable isotope labeling by amino acids in cell culture. Nucleic Acids Res 34: e107 doi: 10.1093/nar/gkl590 [DOI] [PMC free article] [PubMed] [Google Scholar]
- Watanabe Y, Yachie N, Numata K, Saito R, Kanai A, Tomita M 2006. Computational analysis of microRNA targets in Caenorhabditis elegans. Gene 365: 2–10 [DOI] [PubMed] [Google Scholar]
- Weinmann L, Höck J, Ivacevic T, Ohrt T, Mütze J, Schwille P, Kremmer E, Benes V, Urlaub H, Meister G 2009. Importin 8 is a gene silencing factor that targets Argonaute proteins to distinct mRNAs. Cell 136: 496–507 [DOI] [PubMed] [Google Scholar]
- Wightman B, Ha I, Ruvkun G 1993. Posttranscriptional regulation of the heterochronic gene lin-14 by lin-4 mediates temporal pattern formation in C. elegans. Cell 75: 855–862 [DOI] [PubMed] [Google Scholar]
- Wu E, Thivierge C, Flamand M, Mathonnet G, Vashisht AA, Wohlschlegel J, Fabian MR, Sonenberg N, Duchaine TF 2010. Pervasive and cooperative deadenylation of 3′UTRs by embryonic microRNA families. Mol Cell 40: 558–570 [DOI] [PMC free article] [PubMed] [Google Scholar]
- Xiao F, Zuo Z, Cai G, Kang S, Gao X, Li T 2009. miRecords: An integrated resource for microRNA-target interactions. Nucleic Acids Res 37: D105–D110 [DOI] [PMC free article] [PubMed] [Google Scholar]
- Zhang L, Ding L, Cheung T, Dong M, Chen J, Sewell A, Liu X, Yatesiii J, Han M 2007. Systematic identification of C. elegans miRISC proteins, miRNAs, and mRNA targets by their interactions with GW182 proteins AIN-1 and AIN-2. Mol Cell 28: 598–613 [DOI] [PMC free article] [PubMed] [Google Scholar]
- Zhang L, Hammell M, Kudlow BA, Ambros V, Han M 2009. Systematic analysis of dynamic miRNA-target interactions during C. elegans development. Development 136: 3043–3055 [DOI] [PMC free article] [PubMed] [Google Scholar]
- Zhang C, Frias MA, Mele A, Ruggiu M, Eom T, Marney CB, Wang H, Licatalosi DD, Fak JJ, Darnell RB 2010. Integrative modeling defines the Nova splicing-regulatory network and its combinatorial controls. Science 329: 439–443 [DOI] [PMC free article] [PubMed] [Google Scholar]
- Zisoulis DG, Lovci MT, Wilbert ML, Hutt KR, Liang TY, Pasquinelli AE, Yeo GW 2010. Comprehensive discovery of endogenous Argonaute binding sites in Caenorhabditis elegans. Nat Struct Mol Biol 17: 173–179 [DOI] [PMC free article] [PubMed] [Google Scholar]