

Abstract
We use a novel 3D inter-/intracellular force microscopy technique based on 3D traction force microscopy to measure the cell–cell junctional and intracellular tensions in subconfluent and confluent vascular endothelial cell (EC) monolayers under static and shear flow conditions. We found that z-direction cell–cell junctional tensions are higher in confluent EC monolayers than those in subconfluent ECs, which cannot be revealed in the previous 2D methods. Under static conditions, subconfluent cells are under spatially non-uniform tensions, whereas cells in confluent monolayers are under uniform tensions. The shear modulations of EC cytoskeletal remodeling, extracellular matrix (ECM) adhesions, and cell–cell junctions lead to significant changes in intracellular tensions. When a confluent monolayer is subjected to flow shear stresses with a high forward component comparable to that seen in the straight part of the arterial system, the intracellular and junction tensions preferentially increase along the flow direction over time, which may be related to the relocation of adherens junction proteins. The increases in intracellular tensions are shown to be a result of chemo-mechanical responses of the ECs under flow shear rather than a direct result of mechanical loading. In contrast, the intracellular tensions do not show a preferential orientation under oscillatory flow with a very low mean shear. These differences in the directionality and magnitude of intracellular tensions may modulate translation and transcription of ECs under different flow patterns, thus affecting their susceptibility for atherogenesis.
Keywords: cell alignment, endothelial monolayer, finite element method, fluid shear stress, junctional force
Blood vessels are constantly exposed to hemodynamic forces imposed by the blood flow and pressure. Vascular endothelial cells (ECs), which line the inner blood vessel wall, bear the shear stress resulting from the blood flow. Responses of ECs to hemodynamic forces play significant roles in vascular homeostasis in health and disease. Atherosclerotic lesions are preferentially localized in regions, such as arterial branch points, where the ECs are subjected to disturbed flow consisting of flow separation, reversal, and reattachment (1–3). The reattachment area, which is exposed to a low shear stress magnitude and significant oscillatory reversal (i.e., the flow oscillates back and forth with little net direction), has random EC morphology and cytoskeletal organization, incomplete intercellular junctions, and pro-inflammatory and pro-atherogenic phenotypes (1). In contrast, ECs in the straight part of the arterial tree, which is generally spared from atherosclerosis, are exposed to high shear flow with a large net mean direction and have parallel cell orientation, aligned cytoskeletal fibers, and intact junctions. Studies on cultured ECs have advanced the knowledge of how different flow conditions regulate EC functions (1, 4, 5) and provided evidence for the biomedical importance of EC responses to flow shear. The biomechanical mechanisms underlying these responses, however, are still not well understood. Cells communicate with their environment through mechanical forces as well as chemical signals. It is well-known that mechanical interactions between cells and their environment play an important role in the regulation of cell structure and functions, including changes in focal adhesion sites and cytoskeletal assemblies, and alterations in cell motility, proliferation, differentiation, and survival (6, 7).
Developments in traction force microscopy (TFM) have made it possible to determine the forces generated by cultured cells in tangential directions (X,Y) and to analyze the mechanical interplay between cells and their substrata (7). The principle of TFM is to compute forces based on the material properties and deformations of the underlying matrix. Following the initial work by Harris and his co-workers (8), several TFM techniques have been developed, including deformable substrate with embedded fluorescent beads (9–11), micropatterned elastomer (12), and micropillars (13). Our newly developed 3D traction force microscopy (3D-TFM) techniques have enabled us to monitor the traction forces in the direction normal to the cell’s basal plane (Z) as well as in tangential (XY) directions (14, 15). Most of the other techniques aim at determining cell–ECM force, but little is known about the magnitude and spatial organization of cell–cell and intracellular forces, due to the limitations in the methods of quantification.
There is a recent upsurge in interest on the role of intracellular tensions in mechanobiology of cells. Fluorescence resonance energy transfer (FRET) force sensors (16–18) have been used to measure intracellular tensions, but they require high transfection efficiency and signal-to-noise ratio, which are difficult to achieve, especially for EC monolayers. The approach based on TFM has the advantage of providing information on the directions, as well as magnitudes, of intracellular tensions. Microfabricated force sensors have been used to measure the junctional force between two attached ECs on bow tie shape-patterned ECM (19). Flat deformable substrates, which are closer to the native continuous morphology of the endothelial basal lamina, have been adopted to investigate the regulation of junctional force at cell–cell adhesions in cell islands with two cells (20) and approximately 10 cells (21). Although these methods have improved our knowledge about cell–cell and intracellular forces, the measurements are limited to tangential forces and not able to evaluate (Z) forces normal to the basal plane (Z), which have been shown to be comparable in magnitude to the tangential forces (14, 15). The few studies on 3D traction field were performed only on single isolated cells (22, 23) or a cluster of cells (24) and do not allow the determination of cell–cell or intracellular stresses. Furthermore, all these 2D and 3D studies do not deal with confluent cells, which are the main physiological condition (25).
In our 3D-inter/intracellular force microscopy (IFM) investigations, the Z-component of cell forces for a confluent EC monolayer is significantly greater than that for a pair of ECs. More importantly, 3D-IFM has made it possible to quantify intracellular forces in confluent EC monolayers subjected to different patterns of flow stimulation. We used this method to compare the effects of laminar and oscillatory flows. When a laminar flow with physiological shear is applied to confluent EC monolayers for 24 h, the intracellular and junctional tensions increase preferentially along the elongated cell direction. In contrast, neither these tensions nor the cell morphology undergo any significant directional changes under oscillatory flow and control (no-shear) conditions for all time periods investigated (from 0 to 24 h). The different responses of ECs to these two types of flow shear stresses reflect differential intracellular tension changes in modulating EC signaling and function.
Results
Measurement of Cell–ECM, Cell–cell, and Intracellular Forces of Subconfluent Cells and Confluent cell Monolayers.
To measure cell–ECM traction stresses (TS; hereafter, bold characters denote vector quantities), ECs were seeded on a deformable polyacrylamide substrate with a Young’s modulus of 3.63 kPa. Stress (S) is defined as force per unit area; thus, the net traction force exerted by a cell is equal to the average traction stress, multiplied by its basal area. We quantified the 3D stress vector, σ, on the basal plane of the ECs by measuring the 3D deformation produced in the substrate using image correlation and by solving the partial differential equations of static equilibrium for a linearly elastic medium using finite element methods, as described previously (10, 14, 15). This 3D-TFM method provides a quantitative tool to assess the stresses exerted by the cells in directions normal and tangential to the basal plane of the cells, in contrast to prior studies that measured only the tangential traction stresses. We used 3D-TFM to compute the stress balance between the cell and the substrate and, more importantly, to quantify the tension at cell–cell junctions and the tension inside the cell, as described below. Tension (T) is defined as force per unit length; thus, the cell–cell force at a junction is equal to the average junction tension, multiplied by the length of the junction.
When a cell is in contact with neighbor cells, the interplay between cell–ECM and cell–cell interactions modulates the stresses exerted by each cell against the substrate. For two cells attached to each other (Fig. 1, 2 Cells, white domain), we apply Newton’s first law to each of the two cells (orange and green domains) to determine the average junction tension (JT) between them from the following equations:
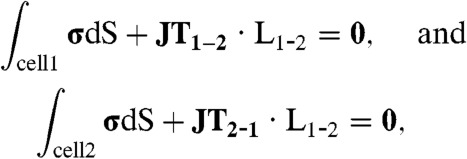 |
[1] |
where JT1-2 is the junction tension acting on cell 1 due to cell 2, JT2-1 is the junction tension acting on cell 2 due to cell 1, and L1-2 is the length of the junction (Fig. 1A, yellow line). The subindices cell 1 and cell 2 in the integrals indicate that these integrals are performed on the area under cell 1 and cell 2, respectively. These equations state that the sum of TS over the area under each cell needs to be balanced by the sum of JT, along the cell–cell junction line (Fig. 1C). Fig. 1D shows the traction stress (Top) and displacement (Bottom) of a pair of cells in contact. The traction stresses and displacement fields are colocalized, but the traction stress field has sharper patterns than the displacement field, which is to be expected as the traction stresses come from spatial derivatives of the displacements. 3D-rendered images of the stress (Fig. S1A) and displacement (Fig. S1B) fields for 2 Cells are shown in the SI Text. The side-cut views in this figure help visualize the stress (Fig. S1A, Right) and deformation in the Z direction (Fig. S1B, Right).
Fig. 1.

Measurements of cell–cell and intracellular tensions from cell-ECM stresses. (A) A pair of ECs in contact (2 Cells). White line outlines the region on which Newton’s first principle of static equilibrium is applied. Green and orange lines indicate regions used for computation of junction tensions for cell 1 and cell 2, respectively [Eq. 1]. Yellow line indicates cell–cell junction. (B) Confluent EC monolayer (M Cells). White line indicates the region on which Newton’s first principle of static equilibrium is applied. Green and orange lines outline regions used for computation of junction for group 1 and group 2, respectively. Yellow line indicates cell–cell junction. (C) Schematic of two cells on a substrate with traction stresses (red arrows) and cell–cell tensions (red arrows). (D) Contour and vector plot of traction stresses (Top) and displacement (Bottom) of two ECs in contact. White, green, orange, and yellow lines are the same as in A. The modulus of the 3D traction stress vector underneath the cells is represented by the pseudocolor bar. Units of traction stress and displacement are Pa and μm, respectively. (E) Contour and vector plot of traction stresses (Top) and displacement (Bottom) in a confluent EC monolayer. White, green, orange, and yellow lines are the same as in B. The modulus of the 3D traction stress vector underneath the cells is represented by the pseudocolor bar. Units of traction stress and displacement are Pa and μm, respectively. (F) Plot of errors in |(JT1 - JTm)/JTm| × 100 for two ECs and EC monolayer. JT is cell–cell junctional tension. JTm = (JT1 - JT2)/2, JT1 is cell–cell force of cell 1 or group 1, and JT2 is cell–cell force of cell 2 or group 2. The numbers of data samples are 20 and 24 for 2 Cells, and M cells, respectively.
Intracellular tension (IT) was determined similarly from TS by splitting the domain along an intracellular section as shown in Fig. 1B. This is done in order to avoid insoluble problems mathematically when calculating forces across multiple cells. These methods for measuring cell–cell and intracellular tensions in 3D are referred to as 3D inter-/intracellular force microscopy (3D-IFM).
For confluent cell monolayers (M Cells), the same procedure was employed to determine the junction tension (JT) from the measured TS by dividing the monolayer into two-cell groups separated by their junction lines (Fig. 1B, yellow line). Fig. 1E shows the measured TS (Top) and displacements (Bottom) for an example of an EC monolayer. Similar to the 2 Cells, 3D-rendered images of the stress (Fig. S1C) and displacement (Fig. S1D) fields for M Cells are shown in the SI Text.
In order to calculate JT in the confluent monolayers, one needs to consider two additional factors. The first is the substrate deformation caused by cells located outside of the microscopic field of view. The error in our determination of TS due to this factor was quantified from 3D-TFM simulations using synthetic force fields (SI Text). This error was found to be small at < 8% (Fig. S2E) and confined within a narrow rectangular band (< 10 μm) in the image boundary. To avoid this error, we calculated JT in confluent monolayers, using the traction stresses measured in the inner region that was 10 μm shorter and narrower than the original microscopy image. The second factor that needs be considered is the tension acting on the cells along the boundaries of the image due to the cells outside the field of view. Our finding that the average cell–cell tension in confluent monolayers is spatially uniform indicates that this factor can be neglected, since a uniform tension does not alter the static equilibrium condition. It has also been reported that the tension is uniform in migrating cell monolayers a few cell lengths away from the monolayer edge (25).
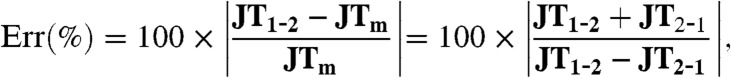
Note that, according to Newton’s third law, JT1-2 should be equal to -JT2-1; hence, this condition can be used to estimate the error in our computation of junction tensions as:
 |
[2] |
where JTm is the average junction tension defined as JTm = (JF1-2 - JF2-1)/2. The error was determined to be less than 10% for both the 2 Cells and M Cells cases (Fig. 1F). Hence, we selected JTm as the cell–cell junctional tension.
Subconfluent ECs and Confluent EC Monolayers have Different Patterns in Cell–cell and Intracellular Forces.
One of our main aims was to assess the similarities and differences in the cell–ECM, cell–cell, and intracellular tensions in ECs under subconfluent vs. confluent conditions. Hence, we first measured the cell–cell junctional tension (JT), intracellular tension (IT) in 2 Cells (subconfluent) and M Cells (confluent) under static conditions without flow.
The IT profiles of 2 Cells and M Cells are shown in Figs. 2 A–D. In 2 Cells (Fig. 2A), the tangential intracellular tension (ITxy) is highest at the cell–cell junction (J in the schematic diagram above Fig. 2 A and B) and decreases significantly with the distance from cell–cell junction. ITz shows a slight decrease that is not statistically significant (Fig. 2D). In contrast to 2 Cells, the M Cells in the EC monolayer exhibit no significant variation in either ITxy (Fig. 2C) or ITz (Fig. 2D) as a function of distance from the junction. These results indicate that the cytoskeleton of confluent ECs is subjected to approximately the same level of mechanical tensions everywhere in the cell, but this is not the case in subconfluent cells.
Fig. 2.

Differences between subconfluent and confluent ECs in cell-ECM stresses, cell–cell tension, and intracellular tensions. (A) Intracellular tensions of two ECs in tangential (XY) direction. J indicates cell–cell junction, I1, I2, and I3 indicate intracellular section lines with increasing distance from J. (B) Intracellular tensions of two ECs in normal (Z) direction. J indicates cell–cell junction, I1, I2, and I3 indicate intracellular section lines with increasing distance from J. (C) Intracellular tensions of EC monolayers in tangential (XY) direction. J indicates cell–cell junction, I2 indicates cell center. I1 indicates in between. (D) Intracellular tensions of ECs monolayers in normal (Z) direction. J indicates cell–cell junction, I2 indicates cell center. I1 indicates in between. (E) Ratio of normal (Z) to tangential (XY) components of traction stresses. (F) Ratio of normal (Z) to tangential (XY) components of cell–cell tensions. * P < 0.05, § p < 0.005. (Schematics) Section lines are defined as interfacial lines that divide a cell or cells into two separated groups. cell–cell tensions or intracellular tensions are calculated as average values along these section lines. The 2 Cells are pairs of cell attached to each other. M Cells are confluent cell monolayers. The numbers of data samples in A–D are 12 for both two ECs and EC monolayers. The numbers of data samples in E and F are 9, 20, and 24 for single EC, two ECs, and EC monolayers, respectively.
ECs exert traction stresses of comparable magnitude in the directions tangent (XY) and normal (Z) to their basal plane (14, 15). In the current study, the ratios of the averaged absolute values of the Z-component to XY-components were analyzed for JT and TS and plotted in Fig. 2E and F, respectively. For reference, note that the TSz/TSxy ratio is unity for a statistically isotropic vector field. The median ratios TSz/TSxy, (Fig. 2E) for one cell and two cells are 0.22 and 0.27, respectively, which correspond to average inclination angles of TS vectors of 9.7 and 12 degrees outward of the basal monolayer plane, respectively. In confluent cells (M Cells), the median ratio is higher (0.37, corresponding to an inclination angle of 17 degrees), but it is not statistically different from one cell and two cells. The median value of the JTz/JTxy ratio of 0.41 in M Cells is significantly higher than that of 0.07 in 2 Cells (Fig. 2F), corresponding to inclination angles of 18 and 2.9 degrees, respectively. Such an increased relative magnitude of the normal junction tensions in M Cells indicates that intercellular interactions in confluent monolayers are more complex than in isolated cell islands. The 2 Cells and M Cells also showed significant differences in orthogonality of cell–cell tension to the junctional section line (Fig. S3).
The above results show that subconfluent and confluent EC monolayers exhibit significant differences in the 3D patterns of cell–cell and intracellular tensions.
Intracellular Tensions in Confluent EC Monolayers Respond Differently to Different Types of Flow Shear.
The confluence of EC monolayers is a distinct feature of normal blood vessels. ECs are constantly exposed to flow shear stresses that have been shown to induce orientations of ECs and their stress fibers along the flow direction and to modulate EC functions (1–4). Therefore, it is valuable to study the balance of forces in EC monolayers under different flows. The effects of different patterns of flow shear stresses on cell–cell junction dynamics and intracellular tension were studied on confluent EC monolayers seeded on elastic polyacrylamide substrates. We measured the magnitude and spatial orientation of intracellular tension at 0, 0.5, and 24 h under laminar steady flow (LS) with a wall shear stress of 12 dyn/cm2, which simulates the atheroprotective flow condition in the straight part of the arterial tree, and oscillatory flow (OS) with a wall shear stress of 0.5 ± 4 dyn/cm2, which simulates the atherogenic flow condition in arterial branch points and curvatures.
M Cells show random orientation at 0 time and after 0.5 h of LS, but they acquire the elongated phenotype after 24 h of LS. Under OS, however, M Cells still retain their polygonal morphology even after 24 h of OS (Fig. 3A). In the LS group, the tangential intracellular tension (ITxy) did not show any significant orientation at 0 time and after 0.5 h of LS (green bars). After 24 h of LS, however, the magnitude of ITxy is almost doubled for the cell junctions aligned perpendicular to the flow direction, where the section angle (Fig. 3B, α) is 90 ± 30° (Fig. 3C, red bars); this result is statistically significant. In general, tensions are perpendicular to the section line, as the mean angle (θ) of tension to the section line is 91.72 ± 6.65° (mean ± sem) without shear. This is in agreement with the results for two-cell islands reported by Maruthamuthu et al. (20). Thus, our results indicate that intracellular tension is maximal in the flow direction. A more detailed evaluation of the relative orientation between ITxy and intracellular section line in confluent cell cultures is provided in the SI Text. The observed increase in intracellular tension in the direction of flow is in keeping with the reorganization of the focal adhesions and alignment of the stress fibers in the flow direction. In the OS group (Fig. 3D), there is no significant variation in ITxy with the section angle at both 0 time and after 0.5 h of OS. After 24 h of OS, the ITxy does not show a statistically significant increase in any direction (p > 0.05); this is in marked contrast to the results after 24 h of LS. Fig. 3E shows that the distribution of ITxy as a function of α at 0 time is essentially uniform across all angles. We performed control no-flow experiments in a Petri dish because of the difficulty of performing no-flow experiments in the flow system over 24 h (due to lack of nutrient supply); these static control experiments also show uniformity in ITxy distribution across all angles over 24 h (Fig. 3F). Orthogonality of ITxy to intracellular section line by different shear flow is detailed in supplemental information (Fig. S4).
Fig. 3.

Confluent EC monolayers respond differently to laminar vs. oscillatory flow shear. (A) EC monolayers under constant laminar flow shear of 12 dyn/cm2 at time 0, 0.5 h, and 24 h. The bottom panels show color maps of the absolute value of the 3D TS vector at each time point and arrow plots of TSxy. The white arrow indicates the flow direction. Scale bar is 10 μm. Unit of color bar is Pa. (B) EC monolayers under oscillatory laminar flow shear of 0.5 ± 4 dyn/cm2 at time 0, 0.5 h, and 24 h. The bottom panels show color maps of the absolute value of the 3D TS vector at each time point and arrow plots of TSxy. The white arrow indicates the flow direction. Scale bar is 10 μm. Unit of color bar is Pa. (C) Tangential intracellular tension after 0.5 and 24 h of laminar flow at different intracellular section angles α from 0° to 180° at 30° intervals. (D) Tangential intracellular tension after 0.5 and 24 h of oscillatory flow at different intracellular section angles α from 0° to 180° at 30° intervals. (E) Tangential intracellular tension under no flow (time point 0) at different intracellular section angles (α) from 0° to 180° at 30° intervals. (F) Tangential intracellular tension under no flow (control in Petri dish) at different intracellular section angles (α) from 0° to 180° at 30° intervals. Colors of blue, green, and red indicate 0, 0.5, and 24 h, respectively. Blue lines indicate the mean value at time 0. The inset plot is a schematic of the section line (green) where IT is measured and the angle α between this section line and the flow direction. The arrow indicates flow direction. The * P < 0.005. LS, OS, and CT denote laminar shear, oscillatory shear, and control (no flow), respectively. The numbers of data samples are 14, 36, and 57 for laminar shear, oscillatory shear, and control, respectively.
Discussion
We hypothesized that (1) structural differences of subconfluent and confluent vascular ECs lead to alteration of intracellular tension, and (2) the shear modulations of EC cytoskeletal remodeling, ECM adhesions, and cell–cell junctions lead to significant changes in cell–cell junctional and intracellular tensions in subconfluent and confluent ECs. To test these hypotheses, we applied 3D-IFM based on our recently developed 3D-TFM (14, 15) to measure the 3D components of cell–cell junctional tension and the distribution of intracellular tension within the cell. We show in the current study that these methods can be applied to confluent monolayers as well as to isolated cells. The ability to measure intracellular and junctional tensions in 3D is important since it has recently been shown that cells exert forces normal to the substrate that cannot be neglected (14, 15).
One of the main obstacles in measuring intracellular and junctional tensions in cell monolayers is the boundary effect caused by cells outside the field of view. We overcome this difficulty by demonstrating that the deformation exerted by a cell outside the field of view on the surface of the substrate decays rapidly to < 5% at 1-cell distance away (Fig. S2B). This rapid decay allows us to essentially eliminate this error due to boundary effects by cropping 10 μm from the edges of the area studied (Fig. S2).
The determination of changes in intracellular tension is especially important for relating cell mechanics to cell functions. For instance, recent data suggest that EC permeability in small micropatterned cell islands is modulated by substrate stiffness through changes in cell-ECM traction stresses and cell–cell junctional tensions (21). Here, we investigate the spatial and temporal changes of intracellular tension in confluent EC monolayers under static condition or subjected to different patterns of shear flow to elucidate the cell mechanics under atherogenic and atheroprotective conditions.
Under static condition, junctional tension in the direction normal to the basal plane is significantly higher for confluent monolayers than for subconfluent cells (Fig. 2F), suggesting that cell–cell mechanical interactions are more complex in the confluent monolayer. A second important difference is that the intracellular tension decays rapidly from the cell junction to the cell edges in subconfluent cells (Fig. 2A), but it is uniformly distributed in confluent cells (Fig. 2C). As a consequence, the cytoskeleton of subconfluent cells is subjected to non-uniform mechanical loading, whereas that of cells in confluent monolayers bears a more uniformly distributed load. It has been reported that in the flow-separation regions in arterial bifurcations and sharp bends, the ECs have a random morphology and a subconfluent organization with incomplete intercellular junctions (26). The differences in intracellular tension that we measured between subconfluent and confluent cells may provide an explanation for the differential behaviors of ECs in different regions of the arterial tree in relation to atherogenesis. We suggest that the intracellular tension profile, as well as its magnitude, may affect transcription and translation processes in the nucleus, which is subjected to variations in intracellular tension and hence influence cell functions (27, 28). The uniform tension in confluent monolayers may also serve to stabilize the cell positions. It is well-known that spatial mechanical cues, such as substrate rigidity (29, 30) and ECM density (31), affect cell functions, including directional cell migration, i.e., mechanotaxis (32). In subconfluent cells and in confluent cells with a wound edge, the current findings indicate that the non-uniform tension distribution near the edge would lead to EC migration for wound closure (25) and its facilitation by directional laminar shear (33).
An optimal Young’s Modulus of TFM can be identified to yield a displacement of approximately 10 pixels at the experimental magnification without significantly affecting the cell behavior (34). Too high a stiffness decreases the movements of marker beads, resulting in the reduced accuracy of deformation determination in image processing. Excessively low stiffness can adversely affect cell growth (30). ECM density can affect adhesions and migration of ECs. Too high or too low concentrations of the ECM protein used (fibronectin, FN) can suppress stress fiber and cell alignment and inhibit EC migration. A substantial decrease of FN concentration restricts cell adhesion and spreading (31).
When the confluent ECs are subjected to flow shear stresses with a distinct direction, the intracellular tensions become anisotropic over time, increasing significantly along the direction parallel to flow. Under such flow shear stresses with a mean forward component, the cells become elongated and most stress fibers, which bear the intracellular tensions, are aligned to the flow direction (35). The level as well as the type of fluid shear stress affects EC functions (36). Degrees of alignment and elongation of ECs have been shown to increase in response to an increase in the level of 24-h laminar shear from 0 to 20 dyn/cm2 (37), with EC orientation starting at a shear stress higher than 7 dyn/cm2. In this study, we chose 12 dyn/cm2, which lies within a physiological range for arterial endothelium.
The observed increase in intracellular tension along the flow direction is not generated by ECs to simply balance the mechanical loading caused by flow shear. This conclusion is obtained by comparing the measured intracellular tension in the flow direction with an estimation of the level of tension that would ideally be required to balance the externally applied flow shear. Such comparison reveals that intracellular tension in the flow direction is larger than the tension required to balance flow shear by 350% and 774% after 24 h of OS and LS, respectively. These findings suggest that the observed increase in intracellular tension is the result of a more complex chemo-mechanical response of the ECs under flow shear. Existing evidence indicates that an increase of junctional tension leads to a growth in size of adherens junctions (19), suggesting that the observed increase in intracellular tension along the flow direction may be related to the localization of adherens junction proteins at both ends of the stress fibers (38). It has been reported that concomitant with elongated cell morphology and stress fibers, adherens junction proteins, such as VE-cadherin and catenins, become localized to discontinuous nodules at the upstream and downstream ends of the stress fibers (38). This tension-mediated directional reorganization of the adherens junctions may provide a mechanism of directional mechanotransduction necessary for the ECs to regulate their signaling and functions in response to changes in the magnitude and direction of flow shear. We have previously shown similar anisotropic changes in the microrheological properties of the cytoplasm in ECs, which sets the level of intracellular deformation in response to both external and internal tensions (39). The cooperative effect of anisotropic changes in intracellular microrheology and tension by flow shear may also contribute to mechanotransduction by inducing directional deformations of intracellular organelles and nuclei, as reported in previous studies (40). It has been shown that nuclear shape changes as a result of alteration in cell shape to modulate gene expression and protein synthesis (27).
Previous papers on 3D traction field (14, 15, 22–24) did not allow the determination of inter- or intracellular stresses. Our method in the current study is unique in that it allows the application to confluent cell cultures, which are physiologically important, and the determination of both the cell–cell stresses and intracellular stresses. Furthermore, in the earlier 3D studies (22), the stress tensor σ was computed from the strain tensor ε using the incompressible Hooke’s law and then employed to calculate the tractions applied by a cell or cell cluster to the substrate according to the Cauchy relation. In contrast, our method is based on the application of a full, 3D finite element method, which has the advantages that it only requires imaging in a thin layer near the surface of the substrate, thereby subjecting the cells to a much lower amount of laser radiation, and that it does not use derivatives in the Z direction, which are relatively inaccurate due to the stretch of the optics in the Z direction.
In conclusion, we use our newly developed 3D-IFM to assess the effects of confluency and differential flow patterns on the intracellular mechanics of ECs. These findings provide a mechanobiological understanding of the process of mechanotransduction. The results engender new insights on the biomechanical dynamics of cells in conjunction with their biochemical and functional activities, thus contributing to the understanding of cellular functions in health and disease.
Materials and Methods
The experimental methods and protocols are described in brief here; detailed information is provided in SI Text. Polyacrylamide (PAA) deformable substrate was prepared as previously described (14). The Young’s Modulus of the substrate was determined with atomic force microscopy to be 3.63 kPa. A recirculating flow system was used to impose laminar (12 dyn/cm2) and oscillatory (0.5 ± 4 dyn/cm2) shears to ECs cultured on PAA substrate.
Spinning disk confocal microscopy was used to track the 3D movement of the embedded fluorescent beads, and displacements were determined by comparing the force-loaded image and corresponding the null-force image (15). The 3D traction stress vector, σ, was computed with the finite element method (FEM) from the measured 3D substrate deformation field by solving a boundary value problem under the assumption of isotropic and elastic material properties based on our previous study (14).
Supplementary Material
ACKNOWLEDMENTS.
We thank Phu Nyugen for assisting in the cell culture work; Yi-Ting Yeh for advice on polyacrylamide substrate preparation; and Gerard Norwich for help on microscopy. This work was supported in part by National Institutes of Health Research Grants 1R01GM084227 (to J.C.L.), HL104402, HL106579, and NSF1120795 (to S.C.).
Footnotes
The authors declare no conflict of interest.
See Commentary on page 11060.
This article contains supporting information online at www.pnas.org/lookup/suppl/doi:10.1073/pnas.1207326109/-/DCSupplemental.
References
- 1.Chiu JJ, Chien S. Effects of disturbed flow on vascular endothelium: pathophysiological basis and clinical perspectives. Physiol Rev. 2011;91:327–387. doi: 10.1152/physrev.00047.2009. [DOI] [PMC free article] [PubMed] [Google Scholar]
- 2.Orr AW, Helmke BP, Blackman BR, Schwartz MA. Mechanisms of mechanotransduction. Dev Cell. 2006;10:11–20. doi: 10.1016/j.devcel.2005.12.006. [DOI] [PubMed] [Google Scholar]
- 3.Davies PF, Spaan JA, Krams R. Shear stress biology of the endothelium. Ann Biomed Eng. 2005;33:1714–1718. doi: 10.1007/s10439-005-8774-0. [DOI] [PubMed] [Google Scholar]
- 4.Chien S. Effects of disturbed flow on endothelial cells. Ann Biomed Eng. 2008;36:554–562. doi: 10.1007/s10439-007-9426-3. [DOI] [PMC free article] [PubMed] [Google Scholar]
- 5.Guo D, Chien S, Shyy JY. Regulation of endothelial cell cycle by laminar versus oscillatory flow: distinct modes of interactions of AMP-activated protein kinase and Akt pathways. Circ Res. 2007;100:564–571. doi: 10.1161/01.RES.0000259561.23876.c5. [DOI] [PubMed] [Google Scholar]
- 6.Bershadsky AD, Balaban NQ, Geiger B. Adhesion-dependent cell mechanosensitivity. Annu Rev Cell Dev Biol. 2003;19:677–695. doi: 10.1146/annurev.cellbio.19.111301.153011. [DOI] [PubMed] [Google Scholar]
- 7.Vogel V, Sheetz M. Local force and geometry sensing regulate cell functions. Nat Rev Mol Cell Biol. 2006;7:265–275. doi: 10.1038/nrm1890. [DOI] [PubMed] [Google Scholar]
- 8.Harris AK, Wild P, Stopak D. Silicone rubber substrata: A new wrinkle in the study of cell locomotion. Science. 1980;208:177–179. doi: 10.1126/science.6987736. [DOI] [PubMed] [Google Scholar]
- 9.Dembo M, Wang YL. Stresses at the cell-to-substrate interface during locomotion of fibroblasts. Biophys J. 1999;76:2307–2316. doi: 10.1016/S0006-3495(99)77386-8. [DOI] [PMC free article] [PubMed] [Google Scholar]
- 10.del Alamo JC, et al. Spatio-temporal analysis of eukaryotic cell motility by improved force cytometry. Proc Natl Acad Sci USA. 2007;104:13343–13348. doi: 10.1073/pnas.0705815104. [DOI] [PMC free article] [PubMed] [Google Scholar]
- 11.Butler JP, Tolic-Norrelykke IM, Fabry B, Fredberg JJ. Traction fields, moments, and strain energy that cells exert on their surroundings. Am J Physiol Cell Physiol. 2002;282:C595–605. doi: 10.1152/ajpcell.00270.2001. [DOI] [PubMed] [Google Scholar]
- 12.Balaban NQ, et al. Force and focal adhesion assembly: a close relationship studied using elastic micropatterned substrates. Nat Cell Biol. 2001;3:466–472. doi: 10.1038/35074532. [DOI] [PubMed] [Google Scholar]
- 13.Tan JL, et al. Cells lying on a bed of microneedles: an approach to isolate mechanical force. Proc Natl Acad Sci USA. 2003;100:1484–1489. doi: 10.1073/pnas.0235407100. [DOI] [PMC free article] [PubMed] [Google Scholar]
- 14.Hur SS, Zhao Y, Li YS, Botvinick E, Chien S. Live cells exert 3D traction forces on their substrata. Cell Mol Bioeng. 2009;2:425–436. doi: 10.1007/s12195-009-0082-6. [DOI] [PMC free article] [PubMed] [Google Scholar]
- 15.del Alamo JC, et al. 3D forces exerted by migrating amoeboid cells. Biophys J. 2010;98:427a. [Google Scholar]
- 16.Meng F, Sachs F. Visualizing dynamic cytoplasmic forces with a compliance-matched FRET sensor. J Cell Sci. 2011;124:261–269. doi: 10.1242/jcs.071928. [DOI] [PMC free article] [PubMed] [Google Scholar]
- 17.Rahimzadeh J, et al. Real-time observation of flow-induced cytoskeletal stress in living cells. Am J Physiol Cell Physiol. 2011;301:C646–652. doi: 10.1152/ajpcell.00099.2011. [DOI] [PMC free article] [PubMed] [Google Scholar]
- 18.Wang Y, Meng F, Sachs F. Genetically encoded force sensors for measuring mechanical forces in proteins. Commun Integr Biol. 2011;4:385–390. doi: 10.4161/cib.4.4.15505. [DOI] [PMC free article] [PubMed] [Google Scholar]
- 19.Liu Z, et al. Mechanical tugging force regulates the size of cell–cell junctions. Proc Natl Acad Sci USA. 2010;107:9944–9949. doi: 10.1073/pnas.0914547107. [DOI] [PMC free article] [PubMed] [Google Scholar]
- 20.Maruthamuthu V, Sabass B, Schwarz US, Gardel ML. Cell-ECM traction force modulates endogenous tension at cell–cell contacts. Proc Natl Acad Sci USA. 2011;108:4708–4713. doi: 10.1073/pnas.1011123108. [DOI] [PMC free article] [PubMed] [Google Scholar]
- 21.Krishnan R, et al. Substrate stiffening promotes endothelial monolayer disruption through enhanced physical forces. Am J Physiol Cell Physiol. 2011;300:C146–C154. doi: 10.1152/ajpcell.00195.2010. [DOI] [PMC free article] [PubMed] [Google Scholar]
- 22.Maskarinec SA, Franck C, Tirrell DA, Ravichandran G. Quantifying cellular traction forces in three dimensions. Proc Natl Acad Sci USA. 2009;106:22108–22113. doi: 10.1073/pnas.0904565106. [DOI] [PMC free article] [PubMed] [Google Scholar]
- 23.Franck C, Maskarinec SA, Tirrell DA, Ravichandran G. 3D traction force microscopy: A new tool for quantifying cell-matrix interactions. PLoS One. 2011;6 doi: 10.1371/journal.pone.0017833. [DOI] [PMC free article] [PubMed] [Google Scholar]
- 24.Notbohm J, Kim JH, Asthagiri A, Ravichandran G. Application of 3D traction force microscopy to mechanotransduction of cell clusters. Appl Mech Mater. 2011;70:21–27. [Google Scholar]
- 25.Trepat X, et al. Physical forces during collective cell migration. Nat Phys. 2009;5:426–430. [Google Scholar]
- 26.Miao H, et al. Effects of flow patterns on the localization and expression of VE-cadherin at vascular endothelial cell junctions: in vivo and in vitro investigations. J Vasc Res. 2005;42:77–89. doi: 10.1159/000083094. [DOI] [PubMed] [Google Scholar]
- 27.Thomas CH, Collier JH, Sfeir CS, Healy KE. Engineering gene expression and protein synthesis by modulation of nuclear shape. Proc Natl AcadSci USA. 2002;99:1972–1977. doi: 10.1073/pnas.032668799. [DOI] [PMC free article] [PubMed] [Google Scholar]
- 28.Jean RP, Chen CS, Spector AA. Finite-element analysis of the adhesion-cytoskeleton-nucleus mechanotransduction pathway during endothelial cell rounding: axisymmetric model. J Biomech Eng. 2005;127:594–600. doi: 10.1115/1.1933997. [DOI] [PubMed] [Google Scholar]
- 29.Lo CM, Wang HB, Dembo M, Wang YL. Cell movement is guided by the rigidity of the substrate. Biophys J. 2000;79:144–152. doi: 10.1016/S0006-3495(00)76279-5. [DOI] [PMC free article] [PubMed] [Google Scholar]
- 30.Wang HB, Dembo M, Wang YL. Substrate flexibility regulates growth and apoptosis of normal but not transformed cells. Am J Physiol Cell Physiol. 2000;279:C1345–1350. doi: 10.1152/ajpcell.2000.279.5.C1345. [DOI] [PubMed] [Google Scholar]
- 31.Shiu YT, et al. Rho mediates the shear-enhancement of endothelial cell migration and traction force generation. Biophys J. 2004;86:2558–2565. doi: 10.1016/S0006-3495(04)74311-8. [DOI] [PMC free article] [PubMed] [Google Scholar]
- 32.Li S, et al. The role of the dynamics of focal adhesion kinase in the mechanotaxis of endothelial cells. Proc Natl Acad Sci USA. 2002;99:3546–3551. doi: 10.1073/pnas.052018099. [DOI] [PMC free article] [PubMed] [Google Scholar]
- 33.Hsu PP, et al. Effects of flow patterns on endothelial cell migration into a zone of mechanical denudation. Biochem Biophys Res Commun. 2001;285:751–759. doi: 10.1006/bbrc.2001.5221. [DOI] [PubMed] [Google Scholar]
- 34.Beningo KA, Lo CM, Wang YL. Flexible polyacrylamide substrata for the analysis of mechanical interactions at cell-substratum adhesions. Methods Cell Biol. 2002;69:325–339. doi: 10.1016/s0091-679x(02)69021-1. [DOI] [PubMed] [Google Scholar]
- 35.Galbraith CG, Skalak R, Chien S. Shear stress induces spatial reorganization of the endothelial cell cytoskeleton. Cell Motil Cytoskeleton. 1998;40:317–330. doi: 10.1002/(SICI)1097-0169(1998)40:4<317::AID-CM1>3.0.CO;2-8. [DOI] [PubMed] [Google Scholar]
- 36.Lin K, et al. Molecular mechanism of endothelial growth arrest by laminar shear stress. Proc Natl Acad Sci USA. 2000;97:9385–9389. doi: 10.1073/pnas.170282597. [DOI] [PMC free article] [PubMed] [Google Scholar]
- 37.Kadohama T, et al. p38 Mitogen-activated protein kinase activation in endothelial cell is implicated in cell alignment and elongation induced by fluid shear stress. Endothelium. 2006;13:43–50. doi: 10.1080/10623320600660219. [DOI] [PubMed] [Google Scholar]
- 38.Noria S, Cowan DB, Gotlieb AI, Langille BL. Transient and steady-state effects of shear stress on endothelial cell adherens junctions. Circ Res. 1999;85:504–514. doi: 10.1161/01.res.85.6.504. [DOI] [PubMed] [Google Scholar]
- 39.del Alamo JC, Norwich GN, Li YS, Lasheras JC, Chien S. Anisotropic rheology and directional mechanotransduction in vascular endothelial cells. Proc Natl Acad Sci USA. 2008;105:15411–15416. doi: 10.1073/pnas.0804573105. [DOI] [PMC free article] [PubMed] [Google Scholar]
- 40.Ueki Y, Sakamoto N, Sato M. Direct measurement of shear strain in adherent vascular endothelial cells exposed to fluid shear stress. Biochem Biophys Res Commun. 2010;394:94–99. doi: 10.1016/j.bbrc.2010.02.115. [DOI] [PubMed] [Google Scholar]
Associated Data
This section collects any data citations, data availability statements, or supplementary materials included in this article.