

Summary
The antiapoptotic protein Bcl-2 [1, 2] plays important roles in Ca2+ signaling [3] by influencing inositol triphosphate receptors and regulating Ca2+-induced Ca2+ release [4–6]. Here we investigated whether Bcl-2 affects Ca2+ extrusion in pancreatic acinar cells. We specifically blocked the Ca2+ pumps in the endoplasmic reticulum and assessed the rate at which the cells reduced an elevated cytosolic Ca2+ concentration after a period of enhanced Ca2+ entry. Because external Ca2+ was removed and endoplasmic reticulum Ca2+ pumps were blocked, Ca2+ extrusion was the only process responsible for recovery. Cells lacking Bcl-2 restored the basal cytosolic Ca2+ level much faster than control cells. The enhanced Ca2+ extrusion in cells from Bcl-2 knockout (Bcl-2 KO) mice was not due to increased Na+/Ca2+ exchange activity, because removal of external Na+ did not influence the Ca2+ extrusion rate. Overexpression of Bcl-2 in the pancreatic acinar cell line AR42J decreased Ca2+ extrusion, whereas silencing Bcl-2 expression (siRNA) had the opposite effect. Loss of Bcl-2, while increasing Ca2+ extrusion, dramatically decreased necrosis and promoted apoptosis induced by oxidative stress, whereas specific inhibition of Ca2+ pumps in the plasma membrane (PMCA) with caloxin 3A1 reduced Ca2+ extrusion and increased necrosis. Bcl-2 regulates PMCA function in pancreatic acinar cells and thereby influences cell fate.
Highlights
► Bcl-2 reduces Ca2+ extrusion through PMCA in control cells as compared to Bcl-2 KO ► Bcl-2 reduces Ca2+ extrusion though PMCA in AR42J cells overexpressing Bcl-2 ► Loss of Bcl-2 reduces Ca2+ overload, decreases necrosis, and promotes apoptosis
Results and Discussion
Loss of Bcl-2 Affects Ca2+ Signaling in Pancreatic Acinar Cells
In this study, we compared Ca2+ signaling mechanisms, with a particular emphasis on Ca2+ extrusion, in pancreatic acinar cells isolated from Bcl-2 knockout (Bcl-2 KO) and control mice. We used a protocol allowing us to monitor the rate of reducing the cytosolic Ca2+ concentration ([Ca2+]i) following a maximal elevation of [Ca2+]i during complete blockade of Ca2+ uptake into the endoplasmic reticulum (ER) (Figures 1A and 1B). Wild-type (WT) and Bcl-2 KO cells exposed to a Ca2+-free solution were treated with thapsigargin (Tg), a specific inhibitor of Ca2+ pumps in the ER, in order to empty the ER Ca2+ stores. The extracellular Ca2+ concentration ([Ca2+]o) was then increased to 1 mM, 5 mM, or 10 mM, which induced rapid influx of Ca2+ to the cytosol. After a stable [Ca2+]i plateau had been attained, extracellular Ca2+ was removed and [Ca2+]i declined until the baseline level had been reestablished (Figures 1A and 1B). Comparing the initial [Ca2+]i of WT and Bcl-2 KO cells, as shown in Figures 1A and 1B, we found that Bcl-2 KO cells had a significantly lower [Ca2+]i (57.5 ± 3 nM SE) than WT cells (100.3 ± 5.6 nM SE) (Figure 1C). This significant difference suggests important changes in equilibrium between Ca2+ entry and extrusion across the plasma membrane.
Figure 1.

Loss of Bcl-2 Protein Is Associated with Increased Na+-Independent Ca2+ Extrusion across the Plasma Membrane
(A) Typical [Ca2+]i trace recorded in a normal (WT) pancreatic acinar cell. Changes in [Ca2+]i were evoked first by application of thapsigargin (Tg) in the absence of external Ca2+ and thereafter by exposure, for a period of 400 s, to an external solution containing 10 mM Ca2+. The reduction in the elevated [Ca2+]i following removal of the high Ca2+ external solution can, in the continued presence of Tg, only be due to Ca2+ extrusion across the plasma membrane.
(B) Pancreatic acinar cell from Bcl-2 KO mouse. The same protocol was used as in (A). The rate of reducing [Ca2+]i (due to Ca2+ extrusion) after removal of 10 mM external Ca2+ was much faster than in the WT cell (shown in A). The resting [Ca2+]i was also lower than in the WT cell.
(C) Comparison of the initial (resting, baseline) [Ca2+]i in WT (blue bar, n = 34) and Bcl-2 KO (red bar, n = 109) pancreatic acinar cells (p < 0.0001). Data in (C) and (E)–(G) are presented as mean ± SEM.
(D) Dependence of the initial rate of Ca2+ extrusion on [Ca2+]i, calculated from experiments of the type shown in (A) and (B), i.e., WT (blue, n = 34) and Bcl-2 KO (red, n = 109) pancreatic acinar cells. In cells from Bcl-2 KO mice, Ca2+ extrusion was much faster. See also Figure S1.
(E) Bar chart comparing half-times (τ1/2) of the reduction in [Ca2+]i toward the resting level following removal of external Ca2+ in WT (blue bar, n = 20) and Bcl-2 KO (red bar, n = 38) cells.
(F) Bar chart comparing half-times (τ1/2) of the reduction in [Ca2+]i toward the resting level following removal of external Ca2+ in WT pancreatic acinar cells in the normal presence of external Na+ (blue bar, n = 18) with those obtained when external Na+ was replaced by NMDG+ (green bar, n = 24) as well as in Bcl-2 KO cells (red bar, in the presence of Na+, n = 6; purple bar, when Na+ was replaced by NMDG+, n = 25). See also Figure S2.
(G) Bar chart comparing the half-times (τ1/2) of the reduction in [Ca2+]i toward the resting level following removal of external Ca2+ in control AR42J cells (blue bar, n = 14) and in AR42J cells transfected with pcDNA3 Bcl-2 plasmid (Bcl-2 overexpression [oe]) (purple bar, n = 17). Data were collected from cells expressing cytosolic Cameleon YC3.60. See also Figure S3.
Loss of Bcl-2 Enhances Ca2+ Extrusion across the Plasma Membrane
Because Ca2+ uptake into the ER was blocked by Tg, the rate of decline of [Ca2+]i—after removal of external Ca2+—must reflect the rate of Ca2+ extrusion. Calcium extrusion rates (d[Ca2+]i/dt) were calculated and then plotted as a function of the [Ca2+]i values obtained from the exponential fit. Initial d[Ca2+]i/dt values (for the highest [Ca2+]i) from each trace were plotted together on a graph and fitted by linear regression (Figure 1D). Similar results were obtained when we compared rates of recovery in cells treated with a high dose of Tg (10 μM) and acetylcholine (ACh) (see Figures S1A and S1B available online) or Tg alone (Figures S1C and S1D). The half-time of recovery of baseline [Ca2+]i levels in the experiments shown in Figures 1A and 1B was calculated, and the results demonstrate that recovery in Bcl-2 KO cells was much faster than in WT cells (Figure 1E).
Ca2+ Extrusion in Pancreatic Acinar Cells Is Mainly Dependent on Plasma Membrane Calcium-Activated ATPase
Tg blocks very specifically the ER Ca2+ pumps (sarcoendoplasmic reticulum Ca2+-activated ATPase [SERCA]). In such conditions, Ca2+ removal from the cytosol is only dependent on Ca2+ export across the plasma membrane. The two main proteins responsible for this process are the plasma membrane calcium-activated ATPase (PMCA) [7] and the Na+/Ca2+ exchanger (NCX) [8]. However, available evidence indicates that NCX plays a very minor, if any, role in Ca2+ extrusion from normal pancreatic acinar cells [9] and that therefore Ca2+ removal across the plasma membrane in these cells is mediated by PMCA.
Na+/Ca2+ Exchange Does Not Contribute to Ca2+ Extrusion in WT and Bcl-2 KO Cells
In order to test independently, in pancreatic acinar cells, whether NCX plays any significant role in Ca2+ extrusion, we performed two different series of experiments. In the first, we replaced all Na+ in the external solution with N-methyl D-glucamine (NMDG+). This approach has been used frequently to inhibit NCX in the plasma membrane [10, 11]. We compared the Ca2+ extrusion rates, following removal of external Ca2+ in the presence of Tg, in WT (Figures S2A and S2B) and Bcl-2 KO cells (Figures S2C and S2D) and summarized the results by calculating the average half-time of recovery of the basal [Ca2+]i (Figure 1F). In experiments on both WT and Bcl-2 KO cells, removal of external Na+ had no effect on the rate of Ca2+ extrusion, as the half-times of the recovery of the basal [Ca2+]i were very similar to controls when Na+ was replaced by NMDG+. Ca2+ extrusion across the plasma membrane is therefore independent of the presence or absence of external Na+, and the enhanced rate of Ca2+ extrusion observed in Bcl-2 KO cells cannot be explained by recruitment of NCX but must be due to increased Ca2+ outflux mediated by PMCA.
In the second series of experiments, we used LaCl3 as a blocker of PMCA. It has previously been shown that 1 mM lanthanum abolishes Ca2+ extrusion by PMCA without affecting NCX [12]. As seen in Figures S2E and S2F, there was no decline of [Ca2+]i following removal of external Ca2+ in the presence of La3+ but, as soon as the trivalent cation had been removed, [Ca2+]i started to decrease. These experiments confirm that NCX has at most a very minor role in cytosolic Ca2+ clearance in pancreatic acinar cells.
Overexpression of Bcl-2 Slows Down Ca2+ Extrusion in AR42J Cells
In order to test further the role of Bcl-2 in regulating Ca2+ extrusion, we stably overexpressed Bcl-2 in a pancreatic acinar cell line (AR42J) and then assessed the rate of recovering the basal [Ca2+]i after an imposed period of elevated [Ca2+]i using our standard protocol (Figures 1A and 1B). In these experiments we measured [Ca2+]i using two independent methods: cytoplasmic calcium Cameleon YC3.60 (Figures 1G, S3A, and S3B) and Fura-2 (Figures S3C–S3E). Ca2+ extrusion in cells overexpressing Bcl-2 was substantially slower than in control cells in both these series of experiments (Figures 1G and S3E), confirming a role for Bcl-2 in regulation of Ca2+ extrusion. Bcl-2 must act by inhibiting PMCA because in these cells, Ca2+ extrusion was also independent of the presence or absence of external Na+ (Figures S3A–S3D). The increased level of Bcl-2 in the overexpressing cells was confirmed by western blot analysis (Figure 2D).
Figure 2.
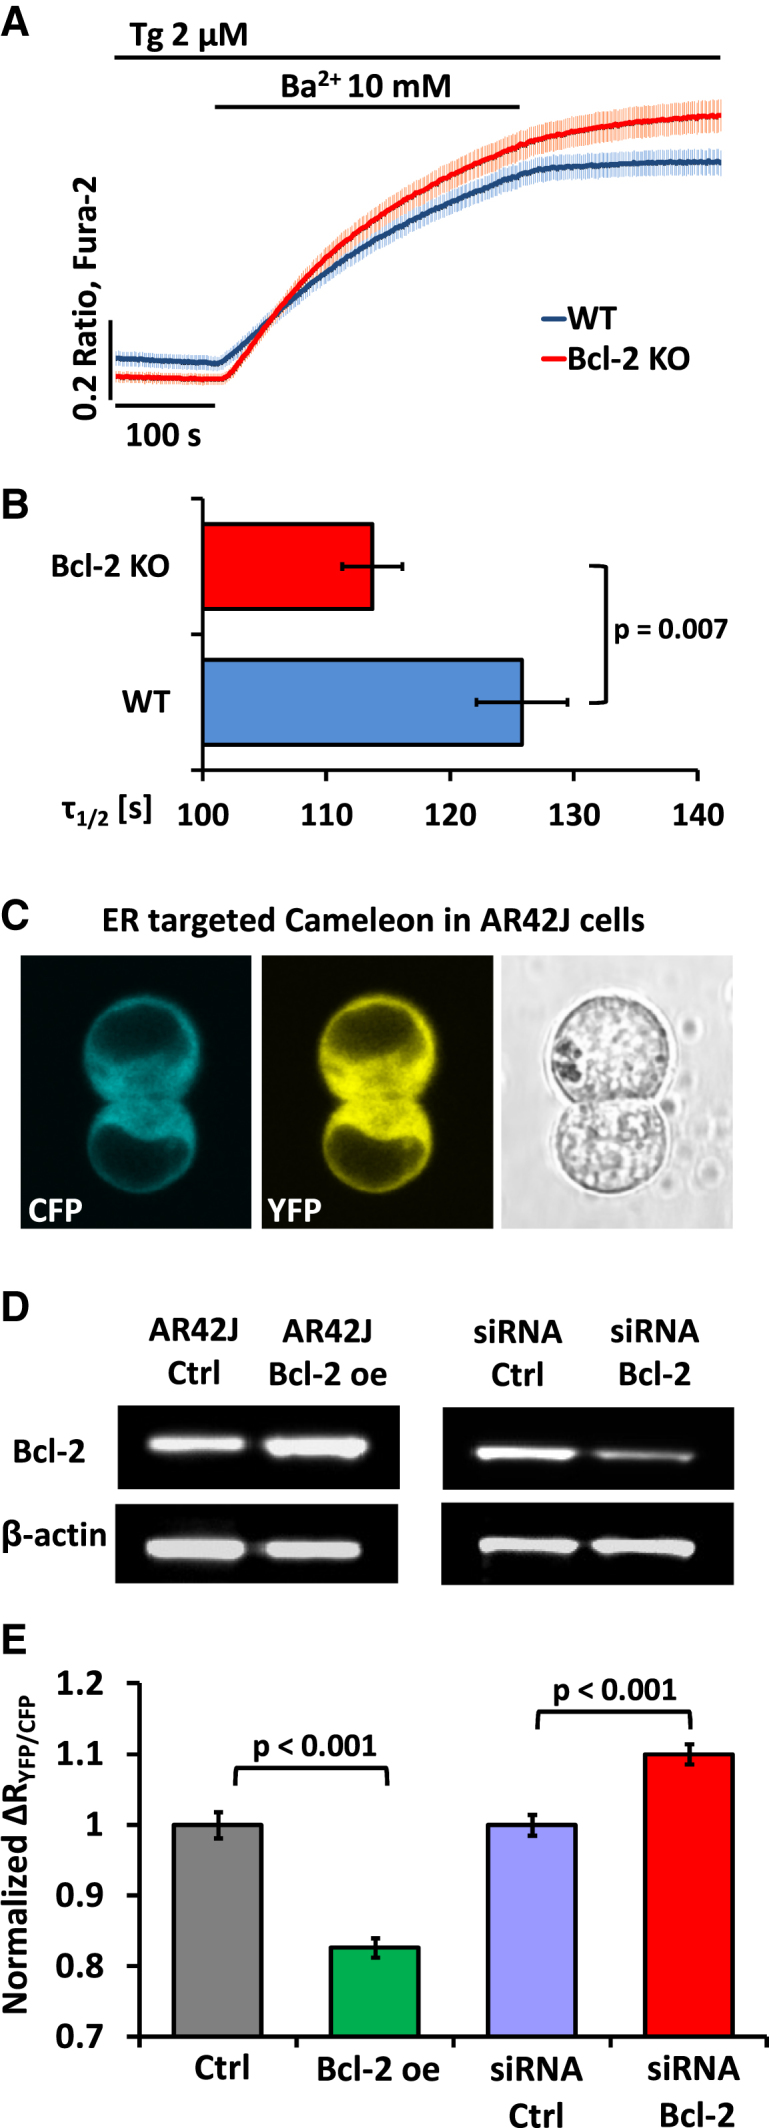
Effects of Bcl-2 on Ca2+/Ba2+ Influx and [Ca2+]ER
(A) Changes in the average [Ba2+]i following introduction of an external solution containing 10 mM Ba2+ in the continued presence of Tg, recorded in WT (blue trace, n = 60) and Bcl-2 KO (red trace, n = 61) pancreatic acinar cells. Traces are shown with standard errors. Data in (A), (B), and (E) are presented as mean ± SEM.
(B) Bar chart comparing half-times (τ1/2) of the rise in Ba2+-induced Fura-2 ratio toward a plateau in WT (blue bar, n = 60) and Bcl-2 KO (red bar, n = 61) pancreatic acinar cells (shown in A).
(C) An AR42J cell doublet transfected with D1ER Cameleon. Blue fluorescence comes from the CFP component and yellow fluorescence from YFP.
(D) Results of immunoblotting against Bcl-2 performed on total protein isolated from (from left to right) control untransfected AR42J cells, AR42J cells stably transfected with pcDNA3 plasmid containing human Bcl-2 insert, AR42J cells transfected with control (scrambled) siRNA, and AR42J cells transfected with Bcl-2 siRNA. β-actin is shown as loading control. See also Figure S4 for distribution of Bcl-2 in pancreatic acinar cells and AR42J cells.
(E) Bar chart comparing differences in resting [Ca2+]ER, presented as the difference between basal YFP/CFP values and YFP/CFP values obtained after treatment with 20 μM CPA, normalized to controls. The gray bar represents control, untransfected AR42J cells (n = 78), the green bar represents cells transfected with pcDNA3 plasmid containing human Bcl-2 insert (n = 97), the blue bar represents AR42J cells transfected with scrambled siRNA (n = 69), and the red bar represents AR42J cells transfected with Bcl-2 siRNA (n = 62).
Bcl-2 Regulates Ca2+/Ba2+ Influx in Pancreatic Acinar Cells
In the presence of external Ca2+, there will inevitably be both Ca2+ entry and Ca2+ extrusion, and it was therefore of interest also to test the possible effect of Bcl-2 on Ca2+ entry alone. Because Ba2+ is not extruded by the Ca2+ pump but does pass through Ca2+ channels, we used Ba2+ in the external solution rather than Ca2+ in these experiments [13]. Comparisons of the averaged Ba2+ entry traces (Figure 2A) and the half-times of the rises in the intracellular [Ba2+] (Figure 2B) show that the rate of Ba2+ entry is significantly enhanced in Bcl-2 KO cells as compared to WT cells. However, the effect of Bcl-2 on Ca2+/Ba2+ entry is quantitatively much smaller than the effect on Ca2+ extrusion (Figures 1A, 1B, and 1E).
Bcl-2 Regulates the Resting Ca2+ Levels in the ER
It was shown previously [3, 14] that Bcl-2 overexpression reduces Ca2+ loading of the ER stores affecting Ca2+ leak and uptake. This has been confirmed by some laboratories [15, 16], but not by others [17, 18]. We measured the resting [Ca2+] in the ER ([Ca2+]ER) of AR42J cells [19] with ER-targeted D1ER Cameleon (Figure 2C) [16, 20, 21] in untransfected AR42J cells, cells stably transfected with human Bcl-2, cells transiently transfected with Bcl-2-siRNA, and cells transiently transfected with control (scrambled) siRNA. The relative levels of Bcl-2 in control and Bcl-2-overexpressing AR42J cells are shown in Figure 2D. Cells from each group were treated with the SERCA inhibitor cyclopiazonic acid (CPA) in order to liberate the releasable Ca2+ from the ER, and changes in the ratio YFP/CFP were compared. The results shown in Figure 2E demonstrate that Bcl-2 overexpression caused a decrease in resting [Ca2+]ER (0.83 ± 0.013 SE, n = 97, p < 0.001 as compared to 1.00 ± 0.018 SE, n = 78 in untransfected control cells; arbitrary units), whereas the opposite effect was obtained by knocking down Bcl-2 with specific siRNA (1.10 ± 0.014 SE, n = 62, p < 0.001 as compared to 1.00 ± 0.015 SE, n = 69 with scrambled siRNA; arbitrary units). Our data are in line with the majority of previous studies [3, 14–16] suggesting that the Ca2+ leak channel in the ER [3, 15] and possibly the SERCA [22, 23] are regulated by Bcl-2. Our finding also underlines the necessity to assess [Ca2+]ER directly, because indirect cytosolic measurements can be misleading with regard to information about ER Ca2+ loading.
Loss of Bcl-2 Protects against Necrosis and Promotes Apoptosis
In order to investigate the pathophysiological importance of Bcl-2 and in particular its regulation of Ca2+ extrusion, we performed cell death assays on freshly isolated WT and Bcl-2 KO pancreatic acinar cells treated with 30 μM menadione [24] and/or high external [Ca2+] (5 mM) for 30 min. Control groups were incubated for 30 min without any treatment. Our results (Figures 3A and 3B) show that untreated WT and Bcl-2 KO cells are characterized by very similar levels of apoptosis and necrosis. A high (5 mM) external [Ca2+] reduced the number of live WT cells in comparison to WT controls (p = 0.019). The same phenomenon was not observed in Bcl-2 KO cells (p = 0.05). Menadione (30 μM) caused a substantial reduction in live WT cells in comparison to WT controls (p < 0.001), increasing both apoptosis (p < 0.001) and necrosis (p = 0.01). Treatment of WT cells with both menadione and high Ca2+ increased necrosis even more than treatment with menadione alone (p = 0.018). Bcl-2 KO cells treated with 30 μM menadione had decreased numbers of live cells (p = 0.001) and markedly increased numbers of apoptotic cells (p = 0.003) in comparison to the untreated Bcl-2 KO cells. However, necrosis levels were not significantly different when compared to the Bcl-2 KO control (p = 0.138). Combined treatment with menadione and 5 mM Ca2+ did not substantially increase necrosis levels above those induced by menadione alone (p = 0.282). Importantly, Bcl-2 KO cells treated with menadione had increased apoptosis levels and decreased necrosis levels as compared to WT cells treated in the same way (p = 0.002 and p = 0.016, respectively). Necrosis inhibition in Bcl-2 KO versus WT cells was even more pronounced between the groups incubated with menadione and high Ca2+ (p = 0.008).
Figure 3.

Bcl-2-Induced Inhibition of Ca2+ Extrusion Is Responsible for Higher Levels of Necrosis When Cells Are Stressed by Raised External [Ca2+] and/or by Menadione
(A) Results of cell death assays performed on WT pancreatic acinar cells. Light green bars represent live cells, blue bars represent apoptotic cells, and red bars represent necrotic cells. The chart is separated into four treatment groups, from the left: untreated control cells, cells treated with 5 mM Ca2+, cells treated with 30 μM menadione, and cells treated with both 30 μM menadione and 5 mM Ca2+. Error bars in (A), (B), and (E) represent SEM.
(B) Results of cell death assays performed on Bcl-2 KO pancreatic acinar cells. The chart is structured in the same way as in (A), which allows comparison of the differences between WT and Bcl-2 KO cells. Cells lacking Bcl-2 undergo more apoptosis and less necrosis as compared to WT cells when challenged with 30 μM menadione or both menadione and high Ca2+.
(C) Typical [Ca2+]i responses to 5 mM Ca2+ (green, nWT = 18), 30 μM menadione in 1 mM Ca2+ solution (blue, nWT = 23), and 30 μM menadione in 5 mM Ca2+ (red, nWT = 22) in WT pancreatic acinar cells. Black arrow shows time point when treatment was applied.
(D) Typical [Ca2+]i responses to 5 mM Ca2+ (green, nBcl-2 = 12), 30 μM menadione in 1 mM Ca2+ solution (blue, nBcl-2 = 14), and 30 μM menadione in 5 mM Ca2+ (red, nBcl-2 = 12) in Bcl-2 KO pancreatic acinar cells. Black arrow shows time point when treatment was applied.
(E) The responses depicted in (C) and (D) were quantitatively analyzed and shown as the average [Ca2+]i responses above the baseline recorded between 200 and 1,200 s and then normalized to the average value of responses to 5 mM Ca2+ in WT cells. Green bars represent cells treated with 5 mM Ca2+, blue bars represent cells treated with 30 μM menadione, and red bars represent cells treated with both 30 μM menadione and 5 mM Ca2+. Responses of WT cells to menadione were greater than those recorded in Bcl-2 KO cells and were additionally potentiated by high extracellular Ca2+.
We also compared the rise in [Ca2+]i in Fura-2-loaded WT cells and Bcl-2 KO cells in response to menadione (30 μM) or to raising the external [Ca2+] from 1 to 5 mM or to both raising [Ca2+]o to 5 mM and simultaneously adding menadione. Typical traces are shown in Figures 3C and 3D. An increase in [Ca2+]o from 1 mM to 5 mM resulted in a small, slowly developing elevation of [Ca2+]i in WT cells but had almost no effect on Bcl-2 KO cells (green traces, Figures 3C and 3D). In both WT and Bcl-2 KO cells, treatment with menadione caused a slow elevation of [Ca2+]i. However, WT cells additionally responded with robust oscillations on top of the increasing [Ca2+]i baseline (blue trace, Figure 3C). These oscillations were markedly potentiated in the presence of 5 mM Ca2+ (red trace, Figure 3C). In contrast, cells lacking functional Bcl-2 protein did not develop such oscillations in response to menadione (blue trace, Figure 3D), and an increased [Ca2+]o had no further effect on menadione-elicited responses in those cells (red trace, Figure 3D). Figure 3E summarizes the effects of menadione and high extracellular Ca2+ on WT and Bcl-2 KO cells. The responses are presented as averaged areas under the traces between 200 and 1,200 s calculated in the same way for each treatment and subsequently normalized to the average values of responses to 5 mM Ca2+ in WT cells. Responses to 5 mM Ca2+ appear to be lower in Bcl-2 KO cells as compared to WT cells, although the difference is not statistically significant (p = 0.105). Menadione applied in the presence of both 1 mM and 5 mM extracellular Ca2+ induced much larger responses in WT cells as compared to Bcl-2 KO cells (p = 0.007 and p < 0.001, respectively). In WT cells, the presence of 5 mM Ca2+ together with menadione caused much larger responses than menadione alone (p = 0.017), whereas in Bcl-2 KO cells, the presence of 5 mM Ca2+ did not affect menadione-dependent responses (p = 0.38). These data demonstrate that removal of Bcl-2 affords a remarkable degree of protection against attempts to raise [Ca2+]i by elevation of the external Ca2+ and/or stimulation with menadione.
Inhibition of PMCA by Caloxin 3A1 Promotes Necrosis
We studied the physiological importance of PMCA-mediated Ca2+ extrusion by using the specific PMCA inhibitor peptide caloxin 3A1 [25]. Figure 4A shows typical changes in [Ca2+]i in response to Tg and ACh in normal control pancreatic acinar cells as compared to cells preincubated for 300 s in the presence of caloxin 3A1. Caloxin 3A1 increased the basal resting [Ca2+]i and significantly inhibited Ca2+ extrusion (Figure 4A), effectively doubling the half-time of recovery of the prestimulation [Ca2+]i (Figure 4B). Caloxin 3A1 by itself did not increase the proportion of necrotic cells (Figure 4C) during relatively short (30 min) experiments, but it dramatically increased the proportion of necrotic cells when it was combined with menadione (Figure 4C).
Figure 4.
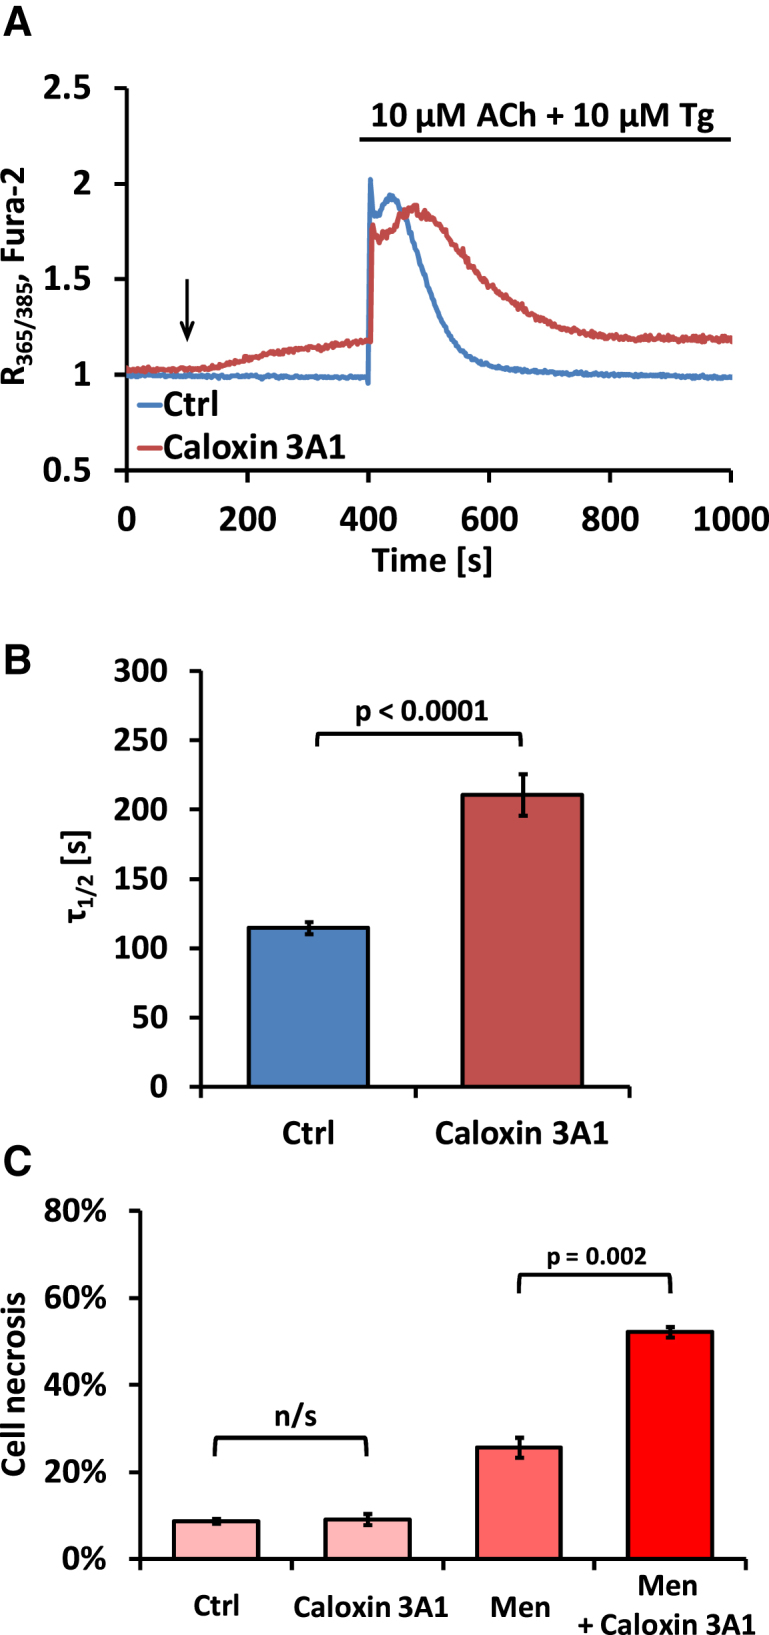
Specific Inhibition of PMCA Substantially Increases Necrosis in Pancreatic Acinar Cells
(A) Typical [Ca2+]i changes in response to 10 μM Tg and 10 μM acetylcholine (ACh) in an untreated pancreatic WT pancreatic acinar cell (blue trace) or a WT cell exposed to 1 mM caloxin 3A1 (dark red trace). Black arrow indicates time of caloxin 3A1 application. Note the gradual increase in [Ca2+]i after caloxin 3A1 application.
(B) Bar chart comparing half-times (τ1/2) of the reduction in [Ca2+]i to the resting level after responses to 10 μM Tg and 10 μM ACh in the presence (dark red bar, n = 26) or absence (blue bar, n = 15) of 1 mM caloxin 3A1. Error bars in (B) and (C) represent SEM.
(C) Bar chart comparing necrosis levels in WT pancreatic acinar cells under different conditions. Cells were incubated for 30 min in the presence of 1 mM caloxin 3A1, 30 μM menadione, or 1 mM caloxin 3A1 and 30 μM menadione. Control cells were incubated for the same amount of time, but without any treatment.
Localization of Bcl-2
The mechanism by which Bcl-2 influences PMCA-mediated Ca2+ extrusion from pancreatic acinar cells needs to be explored in future studies. Localization studies (Figures S4A–S4C) indicate that Bcl-2 is widely expressed, in both pancreatic acinar cells and AR42J cells, including in the ER. Given that it is clear that the ER can come very close to the plasma membrane in pancreatic acinar cells [26], it is not surprising that PMCA and Bcl-2 are partly colocalized (Figures S4A–S4C). This clearly cannot be taken as evidence for a direct interaction between these two proteins but does not exclude such an interaction.
Conclusions
Our results reveal a new and unexpected role for Bcl-2 in the regulation of cellular Ca2+ homeostasis. In addition to the previously reported effects on Ca2+ signaling [3–5], we now show that Bcl-2 can suppress PMCA-mediated cellular Ca2+ extrusion and that such an inhibition has consequences for cell fate. Our data show that Bcl-2 KO cells are protected against the adverse effects of high extracellular Ca2+, because they can extrude cytosolic Ca2+ more efficiently than WT cells. Furthermore, loss of Bcl-2 protein strongly promotes apoptosis and at the same time protects against excessive necrosis when cells are challenged with an agent (menadione) generating reactive oxygen species.
Experimental Procedures
Reagents used included Fluo-4/Fura-2 (Invitrogen), Tg (Calbiochem), collagenase (Worthington), HEPES and PBS (Lonza), PromoFectin (PromoKine), Bcl-2 pEGFP-C1 (Addgene 17999) and pcDNA3-Bcl-2 (Addgene 8768), rabbit anti-Bcl-2 antibodies (Abcam/Cell Signaling), mouse anti-β-actin antibody (Santa Cruz), Bcl-2 siRNA (sc-29215, Santa Cruz), and scrambled siRNA-A (sc-37007, Santa Cruz). Cell culture reagents were supplied by GIBCO, and all other chemicals were purchased from Sigma (UK). Pancreatic acinar cells were isolated from WT or Bcl-2 KO C57BL6/J mice as described previously [24]. Transgenic mice (B6;129S2-Bcl-2) were obtained from The Jackson Laboratory (stock number 002265). All procedures were approved by local ethical review and covered by UK Home Office licenses. AR42J cells (ECACC, 93100618) were maintained in RPMI 1640 medium (GIBCO) [27]. Ca2+ measurements were performed with Fluo-4 or Fura-2 [19, 27], cytosolic YC3.60 Cameleon [20, 21], or D1ER Cameleon [16]. [Ca2+]i was calculated (Fura-2) and recovery phases were fitted with an exponential decay function [28]. Immunoblotting and immunofluorescence were performed as described previously [5, 26].
Acknowledgments
O.H.P. is a Medical Research Council Professor (G19/22/2). This work was supported by program grants G0700167 and MR/J002771/1 from the Medical Research Council (UK). P.E.F. was a Wellcome Trust-funded PhD student. D1ER Cameleon was a gift from Roger Tsien, and YC3.60 was a gift from Atsushi Miyawaki.
Published online: June 14, 2012
Footnotes
Supplemental Information includes four figures and can be found with this article online at doi:10.1016/j.cub.2012.05.002.
Supplemental Information
References
- 1.Martinou J.C., Youle R.J. Mitochondria in apoptosis: Bcl-2 family members and mitochondrial dynamics. Dev. Cell. 2011;21:92–101. doi: 10.1016/j.devcel.2011.06.017. [DOI] [PMC free article] [PubMed] [Google Scholar]
- 2.Kelly P.N., Strasser A. The role of Bcl-2 and its pro-survival relatives in tumourigenesis and cancer therapy. Cell Death Differ. 2011;18:1414–1424. doi: 10.1038/cdd.2011.17. [DOI] [PMC free article] [PubMed] [Google Scholar]
- 3.Pinton P., Ferrari D., Magalhães P., Schulze-Osthoff K., Di Virgilio F., Pozzan T., Rizzuto R. Reduced loading of intracellular Ca(2+) stores and downregulation of capacitative Ca(2+) influx in Bcl-2-overexpressing cells. J. Cell Biol. 2000;148:857–862. doi: 10.1083/jcb.148.5.857. [DOI] [PMC free article] [PubMed] [Google Scholar]
- 4.Monaco G., Decrock E., Akl H., Ponsaerts R., Vervliet T., Luyten T., De Maeyer M., Missiaen L., Distelhorst C.W., De Smedt H. Selective regulation of IP3-receptor-mediated Ca2+ signaling and apoptosis by the BH4 domain of Bcl-2 versus Bcl-Xl. Cell Death Differ. 2012;19:295–309. doi: 10.1038/cdd.2011.97. [DOI] [PMC free article] [PubMed] [Google Scholar]
- 5.Gerasimenko J., Ferdek P., Fischer L., Gukovskaya A.S., Pandol S.J. Inhibitors of Bcl-2 protein family deplete ER Ca2+ stores in pancreatic acinar cells. Pflugers Arch. 2010;460:891–900. doi: 10.1007/s00424-010-0859-4. [DOI] [PMC free article] [PubMed] [Google Scholar]
- 6.Rong Y.P., Aromolaran A.S., Bultynck G., Zhong F., Li X., McColl K., Matsuyama S., Herlitze S., Roderick H.L., Bootman M.D. Targeting Bcl-2-IP3 receptor interaction to reverse Bcl-2's inhibition of apoptotic calcium signals. Mol. Cell. 2008;31:255–265. doi: 10.1016/j.molcel.2008.06.014. [DOI] [PMC free article] [PubMed] [Google Scholar]
- 7.Brini M., Carafoli E. Calcium pumps in health and disease. Physiol. Rev. 2009;89:1341–1378. doi: 10.1152/physrev.00032.2008. [DOI] [PubMed] [Google Scholar]
- 8.Berberián G., Podjarny A., DiPolo R., Beaugé L. Metabolic regulation of the squid nerve Na+/Ca2+ exchanger: recent kinetic, biochemical and structural developments. Prog. Biophys. Mol. Biol. 2012;108:47–63. doi: 10.1016/j.pbiomolbio.2011.09.006. [DOI] [PubMed] [Google Scholar]
- 9.Petersen O.H. Localization and regulation of Ca2+ entry and exit pathways in exocrine gland cells. Cell Calcium. 2003;33:337–344. doi: 10.1016/s0143-4160(03)00047-2. [DOI] [PubMed] [Google Scholar]
- 10.Porras O.H., Ruminot I., Loaiza A., Barros L.F. Na(+)-Ca(2+) cosignaling in the stimulation of the glucose transporter GLUT1 in cultured astrocytes. Glia. 2008;56:59–68. doi: 10.1002/glia.20589. [DOI] [PubMed] [Google Scholar]
- 11.Voronina S.G., Gryshchenko O.V., Gerasimenko O.V., Green A.K., Petersen O.H., Tepikin A.V. Bile acids induce a cationic current, depolarizing pancreatic acinar cells and increasing the intracellular Na+ concentration. J. Biol. Chem. 2005;280:1764–1770. doi: 10.1074/jbc.M410230200. [DOI] [PubMed] [Google Scholar]
- 12.Shimizu H., Borin M.L., Blaustein M.P. Use of La3+ to distinguish activity of the plasmalemmal Ca2+ pump from Na+/Ca2+ exchange in arterial myocytes. Cell Calcium. 1997;21:31–41. doi: 10.1016/s0143-4160(97)90094-4. [DOI] [PubMed] [Google Scholar]
- 13.Bakowski D., Parekh A.B. Voltage-dependent Ba2+ permeation through store-operated CRAC channels: implications for channel selectivity. Cell Calcium. 2007;42:333–339. doi: 10.1016/j.ceca.2007.01.005. [DOI] [PubMed] [Google Scholar]
- 14.Pinton P., Giorgi C., Siviero R., Zecchini E., Rizzuto R. Calcium and apoptosis: ER-mitochondria Ca2+ transfer in the control of apoptosis. Oncogene. 2008;27:6407–6418. doi: 10.1038/onc.2008.308. [DOI] [PMC free article] [PubMed] [Google Scholar]
- 15.Foyouzi-Youssefi R., Arnaudeau S., Borner C., Kelley W.L., Tschopp J., Lew D.P., Demaurex N., Krause K.H. Bcl-2 decreases the free Ca2+ concentration within the endoplasmic reticulum. Proc. Natl. Acad. Sci. USA. 2000;97:5723–5728. doi: 10.1073/pnas.97.11.5723. [DOI] [PMC free article] [PubMed] [Google Scholar]
- 16.Palmer A.E., Jin C., Reed J.C., Tsien R.Y. Bcl-2-mediated alterations in endoplasmic reticulum Ca2+ analyzed with an improved genetically encoded fluorescent sensor. Proc. Natl. Acad. Sci. USA. 2004;101:17404–17409. doi: 10.1073/pnas.0408030101. [DOI] [PMC free article] [PubMed] [Google Scholar]
- 17.He H., Lam M., McCormick T.S., Distelhorst C.W. Maintenance of calcium homeostasis in the endoplasmic reticulum by Bcl-2. J. Cell Biol. 1997;138:1219–1228. doi: 10.1083/jcb.138.6.1219. [DOI] [PMC free article] [PubMed] [Google Scholar]
- 18.Chen R., Valencia I., Zhong F., McColl K.S., Roderick H.L., Bootman M.D., Berridge M.J., Conway S.J., Holmes A.B., Mignery G.A. Bcl-2 functionally interacts with inositol 1,4,5-trisphosphate receptors to regulate calcium release from the ER in response to inositol 1,4,5-trisphosphate. J. Cell Biol. 2004;166:193–203. doi: 10.1083/jcb.200309146. [DOI] [PMC free article] [PubMed] [Google Scholar]
- 19.Baumgartner H.K., Gerasimenko J.V., Thorne C., Ferdek P., Pozzan T., Tepikin A.V., Petersen O.H., Sutton R., Watson A.J.M., Gerasimenko O.V. Calcium elevation in mitochondria is the main Ca2+ requirement for mitochondrial permeability transition pore (mPTP) opening. J. Biol. Chem. 2009;284:20796–20803. doi: 10.1074/jbc.M109.025353. [DOI] [PMC free article] [PubMed] [Google Scholar]
- 20.Nagai T., Sawano A., Park E.S., Miyawaki A. Circularly permuted green fluorescent proteins engineered to sense Ca2+ Proc. Natl. Acad. Sci. USA. 2001;98:3197–3202. doi: 10.1073/pnas.051636098. [DOI] [PMC free article] [PubMed] [Google Scholar]
- 21.Shimozono S., Fukano T., Nagai T., Kirino Y., Mizuno H., Miyawaki A. Confocal imaging of subcellular Ca2+ concentrations using a dual-excitation ratiometric indicator based on green fluorescent protein. Sci. STKE. 2002;125:pl4. doi: 10.1126/stke.2002.125.pl4. [DOI] [PubMed] [Google Scholar]
- 22.Kuo T.H., Kim H.R., Zhu L., Yu Y., Lin H.M., Tsang W. Modulation of endoplasmic reticulum calcium pump by Bcl-2. Oncogene. 1998;17:1903–1910. doi: 10.1038/sj.onc.1202110. [DOI] [PubMed] [Google Scholar]
- 23.Dremina E.S., Sharov V.S., Schöneich C. Displacement of SERCA from SR lipid caveolae-related domains by Bcl-2: a possible mechanism for SERCA inactivation. Biochemistry. 2006;45:175–184. doi: 10.1021/bi050800s. [DOI] [PubMed] [Google Scholar]
- 24.Gerasimenko J.V., Gerasimenko O.V., Palejwala A., Tepikin A.V., Petersen O.H., Watson A.J.M. Menadione-induced apoptosis: roles of cytosolic Ca(2+) elevations and the mitochondrial permeability transition pore. J. Cell Sci. 2002;115:485–497. doi: 10.1242/jcs.115.3.485. [DOI] [PubMed] [Google Scholar]
- 25.Pande J., Mallhi K.K., Grover A.K. Role of third extracellular domain of plasma membrane Ca2+-Mg2+-ATPase based on the novel inhibitor caloxin 3A1. Cell Calcium. 2005;37:245–250. doi: 10.1016/j.ceca.2004.10.004. [DOI] [PubMed] [Google Scholar]
- 26.Lur G., Haynes L.P., Prior I.A., Gerasimenko O.V., Feske S., Petersen O.H., Burgoyne R.D., Tepikin A.V. Ribosome-free terminals of rough ER allow formation of STIM1 puncta and segregation of STIM1 from IP(3) receptors. Curr. Biol. 2009;19:1648–1653. doi: 10.1016/j.cub.2009.07.072. [DOI] [PMC free article] [PubMed] [Google Scholar]
- 27.Baumgartner H.K., Gerasimenko J.V., Thorne C., Ashurst L.H., Barrow S.L., Chvanov M.A., Gillies S., Criddle D.N., Tepikin A.V., Petersen O.H. Caspase-8-mediated apoptosis induced by oxidative stress is independent of the intrinsic pathway and dependent on cathepsins. Am. J. Physiol. Gastrointest. Liver Physiol. 2007;293:G296–G307. doi: 10.1152/ajpgi.00103.2007. [DOI] [PubMed] [Google Scholar]
- 28.Henke W., Cetinsoy C., Jung K., Loening S. Non-hyperbolic calcium calibration curve of Fura-2: implications for the reliability of quantitative Ca2+ measurements. Cell Calcium. 1996;20:287–292. doi: 10.1016/s0143-4160(96)90034-2. [DOI] [PubMed] [Google Scholar]
Associated Data
This section collects any data citations, data availability statements, or supplementary materials included in this article.