

Abstract
Background
In myocardial ischemia, induction of autophagy via the AMP-induced protein kinase (AMPK) pathway is protective, whereas reperfusion stimulates autophagy with BECLIN-1 upregulation, and is implicated in causing cell death. We examined flux through the macro-autophagy pathway as a determinant of the discrepant outcomes in cardiomyocyte cell death in this setting
Methods and Results
Reversible left anterior descending coronary artery ligation was performed in mice with cardiomyocyte-restricted expression of GFP-tagged microtubule associated protein light chain-3 (LC3) to induce ischemia (120 minutes) or ischemia-reperfusion (IR, 30–90 minutes) with saline or chloroquine (CQ) pretreatment (n=4/group). Autophagosome clearance, assessed as the ratio of punctate LC3 abundance in saline to CQ treated samples was markedly impaired with IR as compared with sham controls. Reoxygenation increased cell death in neonatal rat cardiomyocytes (NRCMs) as compared with hypoxia alone; markedly increased autophagosomes but not autolysosomes (assessed as punctate dual fluorescent mCherry-GFP tandem tagged LC3 expression); and impaired clearance of polyglutamine aggregates, indicating impaired autophagic flux. The resultant autophagosome accumulation was associated with increased reactive oxygen species (ROS) and mitochondrial permeabilization leading to cell death, which was attenuated by cyclosporine A pretreatment. Hypoxia-reoxygenation injury was accompanied by ROS-mediated BECLIN-1 upregulation and reduction in Lysosome Associated Membrane Protein-2 (LAMP2), a critical determinant of autophagosome-lysosome fusion. Restoration of LAMP2 levels synergizes with partial BECLIN-1 knockdown to restore autophagosome processing and attenuate cell death following hypoxia-reoxygenation.
Conclusions
Ischemia-reperfusion injury impairs autophagosome clearance mediated in part by ROS-induced decline in LAMP2 and upregulation of BECLIN-1, contributing to increased cardiomyocyte death.
Keywords: reperfusion injury, autophagy, cell death, ischemia reperfusion
Autophagy is an intracellular lysosomal degradative process operative in homeostatic clearance of organelles and protein aggregates1. Macro-autophagy involves segregation of cargo within double membrane-bound autophagosomes that fuse with and are degraded within lysosomes; and efficient flux through the macro-autophagy pathway is essential for cell survival2. However, the frequent observation of autophagosomes in dying cells has stimulated interest in examining autophagy as a mechanism for cell death; termed type-II programmed cell death3. Whether autophagy causes programmed cell death or is ‘guilty’ by association4, remains a subject of active investigation.
Autophagy induction is critical for survival during the perinatal period of relative starvation5; and suppression of constitutive cardiomyocyte autophagy with ablation of ATG56; or impairment of late stages of autophagy in the absence of Lysosome Associated Membrane Protein-2 (LAMP2) in patients with Danon disease7 and in mice with LAMP2 ablation8, results in cardiomyopathy. Autophagy is also rapidly induced in the myocardium in response to stress such as fasting9, pressure overload6, 9 and ischemia-reperfusion (IR) injury10. In contrast to a clear prosurvival role for constitutive autophagy, stress-induced autophagy has been ascribed both salutary and deleterious roles in cardiomyocyte function and survival9, 10.
Autophagosome prevalence, a commonly employed readout for the state of autophagy activation, is determined by the rate of autophagosome formation (i.e. induction of autophagy) and the rate of autophagosome destruction; and is therefore a function of ‘flux’ through the autophagic pathway11. It is not clear whether the increased abundance of autophagosomes in dying cells reflects upregulation of adaptive autophagy2, 4, an instance of dysregulated and excessive self-cannabalism12, or an impairment in autophagic flux with reduced clearance of autophagosomes (and presumably cargo that would normally be degraded by autophagy) as postulated to occur in Danon disease7, with secondary activation of programmed cell death. In this study, we have utilized an integrated approach to examine flux through the macro-autophagy pathway in myocardial IR injury to test the hypothesis that impairment in late stages of autophagy with resultant autophagosome accumulation prevents its prosurvival role and triggers cardiomyocyte death.
Methods
Ischemia-reperfusion modeling
Adult male cardiomyocyte-specific GFP-LC3 transgenic mice9 and C57BL/6 mice (from Jackson Laboratories) were subjected to reversible left anterior descending artery (LAD) coronary ligation, in the presence of chloroquine (CQ) 10mg/kg or MnTMPyP (6 mg/kg) i.p., respectively; or saline control, 1 hour prior to surgery13. All animal studies were approved by the Animal Studies Committee at Washington University School of Medicine and the Institutional Animal Care and Use Committee at the John Cochran VA Medical Center.
Generation of viral constructs
Adenoviruses coding for rat LAMP2A and rat LAMP2B were generated using Invitrogen’s Virapower system. Adenoviruses coding for Beclin-1 shRNA10, and CFP-tagged polyglutamine Q19 and Q80 constructs14, and lentivirus coding for mCherry-GFP-LC315 have been described.
Assessment of cell death, hypoxia-reoxygenation modeling, immunofluorescence imaging, flow cytometry and quantitative PCR analysis was performed as described15.
Statistical analysis
Results are expressed as mean ± SEM. Statistical differences were assessed with the unpaired Student’s t-test for two independent groups, paired t-test for dependent data; and one-way ANOVA for multiple groups with SPSS software. Bonferroni’s post-hoc testing was employed after ANOVA for testing all pairwise comparisions between groups. A two-tailed P value of less than 0.05 was considered statistically significant.
Results
Autophagosome clearance is impaired in cardiomyocytes with ischemia-reperfusion injury, in-vivo
Ischemic insult activates cardiomyocyte autophagy, as evidenced by an increase in LC3-II to LC3-I ratio and increased numbers of punctate GFP-LC3-bearing autophagosomes after a brief episode of myocardial ischemia10. Autophagosome abundance is further increased following reperfusion injury10. Since autophagosome prevalence at any point in time is determined by the rate of formation of autophagosomes (i.e. induction of autophagy) and rate of autophagosome processing (i.e. flux through the macro-autophagy pathway)11, we determined cumulative autophagic flux by determining the numbers of autophagosomes in the presence and absence of chloroquine, which inhibits lysosomal acidification and prevents autophagosome-lysosome fusion11. We subjected mice with cardiomyocyte-specific expression of GFP-LC39 to in-vivo ischemia for 2 hours (confirmed by ST elevation, Figure 1A middle) or ischemia-reperfusion for an equivalent duration (ischemia 30 minutes followed by reperfusion for 90 minutes with reversal of ST elevation, Figure 1A right) in the absence and presence of chloroquine and assessed LC3 distribution. Mice subjected to a sham procedure demonstrate basal level of cardiomyocyte autophagy as evidenced by punctate localization of GFP-LC3 (on autophagosomes9), with autophagosome accumulation (~6 fold increase) in the presence of chloroquine, suggesting intact autophagic flux (Figure 1B, C). Ischemia caused a 10-fold increase in autophagosome abundance as compared with sham operation, implying induction of autophagosome formation (Figure 1B, C). This was accompanied by partial impairment of autophagic flux (ratio of autophagosome abundance with and without chloroquine ~2 with ischemia, as compared with ~6 in sham; Figure 1C). Reperfusion following ischemia provoked a further increase in autophagosome abundance (23-fold), which was not altered in the presence of chloroquine suggesting markedly impaired autophagic flux (ratio of autophagosome abundance with and without chloroquine ~ 1; Figure 1C). Levels of GFP-tagged-LC3-II and p62, a protein that links ubiquitinated aggregates for destruction within autophagosomes and gets degraded upon autophagosome processing16, increased in IR-treated hearts, to a degree comparable to those treated with chloroquine (Figure 1D, E, F), further supporting the observation of impaired autophagosome processing with IR injury.
Figure 1.

Myocardial ischemia-reperfusion injury impairs autophagosome processing, in-vivo. A) Representative electrocardiographic tracings from mice subjected to reversible LAD coronary artery occlusion to induce myocardial ischemia, as evidenced by ST segment elevation (middle panel) followed by reperfusion, with resolution of ST segment elevation (right panel), as compared with baseline (left panel). B) Representative grayscale immunofluorescence images (630X) of left ventricular (LV) myocardial sections from mice with cardiomyocyte-specific expression of GFP-LC3, subjected to sham surgery (left), ischemia (120 min, middle) or ischemia (30 min) followed by reperfusion (90 min, right), in the presence of chloroquine (CQ; 10 mg/kg injected i.p. 1 hour prior to surgery, bottom) or saline-diluent control (DIL, top). C) Quantitative analysis of punctate LC3 dots from (B) (n=4 mice/group). D) Immunoblots; and E–I) Quantitative analysis of autophagosome bound GFP-LC3-II (E), p62 (F), LAMP2 (G), LAMP1 (H) and BECLIN-1 (I) abundance in myocardial extracts from mice modeled as in B; (n=4/group). P values are by post-hoc test after one-way ANOVA (C, E-I).
Myocardial ischemia-reperfusion injury provokes a decline in LAMP2 and increase in BECLIN-1 abundance, with impaired autophagosome processing
Autophagosome processing can be impaired if lysosome numbers decline15, or there is a selective impairment in autophagosome-lysosome fusion or lysosome function. Accordingly, we examined the expression of lysosome membrane proteins, LAMP1 and LAMP2. Interestingly, levels of LAMP2 declined by 41% and LAMP1 declined by 44% in IR-treated GFPL-LC3 transgenic hearts (Figure 1D, G, H); and only the decline in LAMP1, which closely tracks lysosome numbers15 was prevented by chloroquine pretreatment, suggesting that the decline in LAMP2 was independent of lysosome pH and not related to lysosome consumption in IR-induced autophagy. Interestingly, while LAMP1 deficiency in mice is of no serious consequence17; LAMP2 is a critical determinant of autophagosome-lysosome fusion18, 19, and mutations causing LAMP2 deficiency result in Danon disease7 which is characterized by autophagosome accumulation in multiple tissues including the myocardium, and cardiomyopathy8. As observed previously10, BECLIN-1 levels were elevated with reperfusion injury and not during ischemia (Figure 1D, I).
To evaluate whether a reperfusion-induced surge in reactive oxygen species (ROS) generation mediated the observed changes, we treated adult male C57BL/6 mice with MnTMPyP (Mn(III)tetrakis(1-Methyl-4-pyridyl) porphyrin pentachloride), a cell permeable superoxide dismutase mimetic, which acts as a ROS scavenger, or diluent and subjected them to reversible LAD ligation for 30 minutes followed by reperfusion for 90 minutes; or sham surgery. IR induced a marked increase in autophagosome-bound LC3-II abundance with p62 accumulation in the myocardium, which were both prevented by pretreatment with MnTMPyP (Figure 2A–C). This suggests that IR-induced ROS generation may inhibit autophagosome processing in addition to damaging cellular structures that need removal through macro-autophagy. Importantly, the observed IR-induced decline in LAMP2 and the upregulation in BECLIN-1 were prevented with MnTMPyP pretreatment (Figure 2A, D, E). Curiously, we did not observe an IR-induced decline in LAMP1 in this strain of mice, as observed in the GFL-LC3 reporter mice; and basal LAMP1 levels appeared to be negatively regulated by ROS (Figure 2A, F).
Figure 2.

Scavenging reactive oxygen species restores autophagosome processing in myocardial ischemia-reperfusion injury, in vivo. A–F) Representative immunoblots (A) and quantitative analysis of LC3-II (B), p62 (C), LAMP2 (D), LAMP1 (E), and BECLIN-1 (F) expression in myocardial extracts from mice subjected to sham surgery or ischemia (30 minutes) followed by reperfusion (90 minutes), in the presence of MnTMPyP (6mg/kg i.p.) or saline control injected 1 hour prior to surgery. N=5–6/group. P values are by post-hoc test after one-way ANOVA.
Impaired autophagosome clearance is sufficient to cause cell death in cardiomyocytes
Autophagy has been implicated as a mechanism for programmed cell death3. To test the hypothesis that impairment in autophagosome processing causes cardiomyocyte death, we subjected NRCMs to treatment with rapamycin, an irreversible inhibitor of mTOR (mammalian target of rapamycin)10 and nutrient deprivation15 to stimulate autophagy, and blocked autophagosome processing with chloroquine pretreatment15. The relative abundance of autophagosomes and autolysosomes was assessed with lentivirally transduced mCherry-GFP tandem-tagged LC3 (Figure 3A), as described15. Induction of autophagy leads to punctate localization of LC3 on autophagosomes9, which demonstrate both red and green fluorescence, with subsequent loss of green fluorescent signal on autophagosome-lysosome fusion and formation of autolysosomes, due to instability of GFP in the acidic intralysosomal environment15. NRCMs in culture demonstrate constitutive (basal) autophagy with a preponderance of autolysosomes (punctate dots that fluoresce only red, Figure 3A, top middle panel; Figure 3B) and a few autophagosomes (punctate dots that fluoresce green and red, i.e. yellow, Figure 3A, top right panel; Figure 3B). Treatment with rapamycin stimulates autophagy with enhanced autophagic flux15, as evidenced by markedly increased abundance of autolysosomes without a discernible accumulation of autophagosomes (Figure 3A middle panel, Figure 3B). Pretreatment with chloroquine resulted in accumulation of autophagosomes and near absence of autolysosomes (Figure 3A bottom panel, Figure 3B). Rapamycin treatment provoked a decline in cumulative LC3 abundance, suggesting consumption during autophagy, and clearance of p62 (Figure 3C) as compared with control, indicating intact flux. In contrast, impairment of autophagosome processing with chloroquine caused accumulation of autophagosome-bound LC3-II and p62 (Figure 3C), indicating impaired autophagosome clearance; which was sufficient to cause cell death in the basal state, and with rapamycin or nutrient deprivation (ND)-initiated autophagy, while autophagosome clearance was inhibited (Figure 3D). To investigate the mechanism of cell death with chloroquine, we posited that autophagosome accumulation prevents clearance of damaged intracellular organelles and proteins leading to increased ROS generation, which causes mitochondrial permeabilization and activation of programmed apoptosis and/or necrosis3. Indeed, chloroquine treatment increased ROS generation (Figure 3E, F), with loss of mitochondrial membrane potential (Figure 3E, G). Induction of ROS by chloroquine was not prevented by pretreatment with cyclosporine A (CsA), an inhibitor of mitochondrial permeability transition pore (MPTP), indicating that ROS generation was upstream of mitochondrial permeabilization. Accordingly, pretreatment with CsA, but not ZVAD-fmk (a pancaspase inhibitor) attenuated chloroquine-induced cell death, under conditions of both basal and rapamycin-stimulated autophagy, suggesting activation of programmed necrosis pathway with autophagosome accumulation.
Figure 3.

Impaired autophagosome clearance causes cardiomyocyte death. A) Representative immunofluorescence images (630X) of NRCMs expressing mCherry-GFP-LC3 and treated with rapamycin (Rapa, 5μmol/L) (middle), rapamycin (5μmol/L) + chloroquine (CQ, 10mol/L) (bottom) or vehicle control (top) for 24 hours. Nuclei are blue (DAPI). Representative of n=3 experiments. B) Quantitative analysis of autophagosomes (red+green=yellow dots, white bars), autolysosomes (red only dots, black bars) and both (red dots, gray bars) in NRCMs treated as in A. N=30–50 nuclei per group. P values are by paired t-test. C) Representative immunoblot depicting LC3 processing and p62 abundance in NRCMs treated with rapamycin, without and with chloroquine (as in A); a bright line separates two parts of one gel grouped together; representative of n=2 experiments. D) Cell death in NRCMs treated with rapamycin (Rapa, 5μmol/L, 24 hours) or vehicle control, and subjected to nutrient deprivation (ND, 24 hours) in the absence and presence of chloroquine (CQ, 10μmol/L, 24 hours); n=8/group; P values are by post-hoc test. E) Representative immunofluorescence images (630X) of NRCMs loaded with ROS indicator carboxy-H2DCFDA (top), TMRE (middle) and merged images (bottom), treated with CQ (10μmol/L) in the presence of CsA (20μmol/L) or DMSO control. Treatment with H2O2 (500μmol/L, 4 hours) was employed as a positive control. F–G) Representative tracings of flow cytometric analysis of NRCMs treated as in E (left) with quantitation of mean fluorescence (right) (n=3–5/group) for ROS (F) and TMRE (G). * indicates P< 0.05 vs Control; # vs. CQ treatment by post-hoc test. H) Cell death in NRCMs treated with CQ (10μmol/L) with or without treatment with Rapamycin (5 μmol/L) for 24 hours; in the presence of ZVAD-fmk (20μmol/L), CsA (20μmol/L) or DMSO control. * indicates P< 0.05 vs Control; # vs. respective CQ treatment group by post-hoc test (n=10–30/group).
Hypoxia-reoxygenation induces autophagosome accumulation in cardiomyocytes
Autophagic flux has been noted to be impaired in HL-1 cardiomyocytes, an immortalized cell line derived from atrial myocytes, with in-vitro hypoxia-reoxygenation insult20. We subjected NRCMs to in-vitro hypoxia (ambient O2 concentration < 1%) followed by reoxygenation and determined the relative abundance of autophagosomes and autolysosomes15. NRCMs cultured in a normoxic environment display basal autophagy with intact flux (Figure 4A, also see Figure 3A). Hypoxia for 24 hours markedly increased the abundance of autophagic structures (Figure 4A, middle panel), with an increase in both autophagosomes and autolysosomes (Figure 4B). Reoxygenation following 6 hours of hypoxia further increased the numbers of autophagic structures, which are predominantly autophagosomes (Figure 4A, bottom panel and Supplemental Figure 1A, B), without an increase in autolysosomes. Both prolonged hypoxia and hypoxia-reoxygenation increased LC3-II abundance, indicating increased numbers of autophagosomes (Figure 4C, Supplemental Figure 1C) associated with a reduction in LAMP2 abundance (Figure 4C, D; assessed with a monoclonal antibody directed to the matrix side of LAMP2 protein, which detects all isoforms)21, without affecting LAMP1 levels except with longer duration (72 hours) of injury (Figure 4D). This was not due to a decline in the numbers or distribution of lysosomes (Supplemental Figure 1D, Supplemental Figure 2A, B), lysosomal permeabilization (Supplemental Figure 2C) or a change in lysosomal pH (Supplemental Figure 2D). Hypoxia-reoxygenation-induced decline in LAMP2 was associated with BECLIN-1 upregulation as compared with hypoxia alone, and p62 accumulation up to 48 hours after onset of injury (Figure 4D, Supplemental Figure 1C). Taken together, these data suggest impairment in autophagosome processing with reoxygenation following a hypoxic insult.
Figure 4.
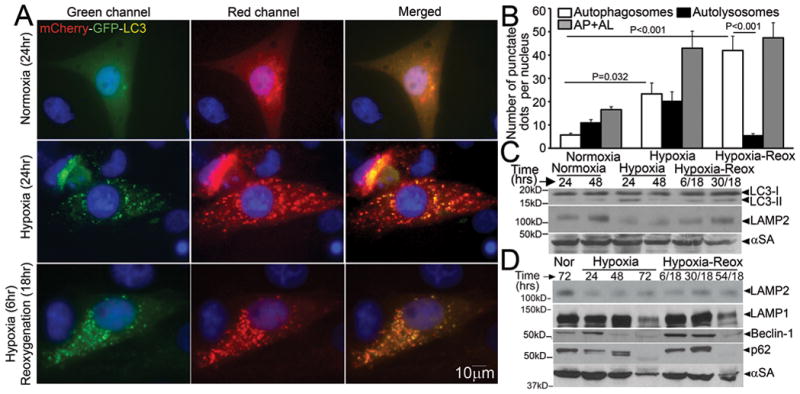
Hypoxia-reoxygenation injury upregulates autophagy with impaired autophagosome processing in NRCMs. A) Representative immunofluorescence images (630X) demonstrating mCherry-GFP-LC3 localization in NRCMs cultured in a normoxic environment (top, as controls), subjected to hypoxia (24 hours, middle) or hypoxia (6 hours) followed by reoxygenation (18 hours, bottom). Nuclei are blue (DAPI). Representative of n=3 experiments. B) Quantitative analysis of autophagosomes (white bars), autolysosomes (black bars) and both (gray bars) in NRCMs treated as in A. P values are by post-hoc test between groups, and paired t-test within a group. N=30–50 nuclei per group. C, D) Representative immunoblots depicting LC3 processing and LAMP2 abundance in response to hypoxia, and hypoxia-reoxygenation injury for 24 and 48 hours; (C) and time course for change in LAMP2, LAMP1, BECLIN-1 and p62 abundance in response to hypoxia-reoxygenation injury (D). Representative of n=2 experiments.
To determine whether hypoxia-reoxygenation impairs proteasomal processing of proteins, which could result in an overload of the autophagic pathway for protein degradation and conceivably overwhelm the lysosomal machinery, we forcibly expressed polyglutamine repeats which are known to be differentially processed via the ubiquitin-proteasome pathway (Q19) and macro-autophagy (Q80)14, in NRCMs and subjected them to hypoxia-reoxygenation injury. Hypoxia-reoxygenation impaired clearance of polyglutamine Q80 aggregates (Figure 5A, B) but not Q19 (Supplemental Figure 3A) suggesting specific impairment in autophagy. To determine whether hypoxia-reoxygenation-induced impairment in autophagosome processing contributes to cell death, we subjected NRCMs to matched durations of hypoxia and hypoxia-reoxygenation. Hypoxia increased cell death in NRCMs, with ~45% of cells dead after 24 hours (Figure 5C, D, and Supplemental Figure 3B) as compared with 6% in cells cultured in normoxic conditions. Interestingly, reoxygenation after a short hypoxic insult (6 hours) increased cell death even further (52%) as compared with a comparable duration of hypoxia alone, suggesting an association between impaired autophagosome processing (see Figure 4) and reoxygenation-induced cell death in NRCMs. Experimental inhibition of autophagosome processing with chloroquine treatment increased hypoxia-induced cell death to levels comparable with hypoxia-reoxygenation, but did not affect cell death with hypoxia-reoxygenation (Supplemental Figure 3C) consistent with a severe impairment in autophagosome processing in cells subjected to hypoxia-reoxygenation injury. Autophagosome accumulation with hypoxia-reoxygenation was associated with ROS generation (Figure 5E, F) and mitochondrial permeabilization (Figure 5E, G); and while mitochondrial permeabilization was prevented with CsA pretreatment (Figure 5E, G), ROS generation was not (Figure 5E, F) suggesting it is upstream of mitochondrial permeabilization, mirroring the observations with chloroquine-induced autophagosome accumulation (Figure 3E–G). Accordingly, CsA but not ZVAD-fmk attenuated hypoxia-reoxygenation-induced cell death suggesting a MPTP-driven necrotic mechanism of cell death3 (Figure 5H).
Figure 5.
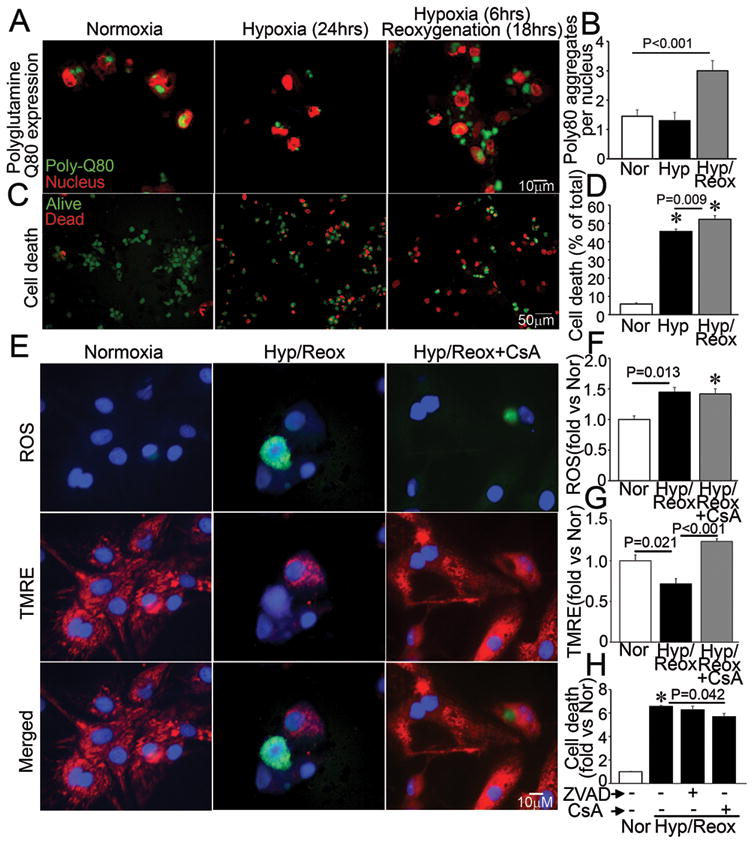
Impaired autophagosome processing is associated with cell death in NRCMs subjected to hypoxia-reoxygenation injury. A, B) Representative immunofluorescence images (630X) depicting CFP-tagged polyglutamine Q80 accumulation (green) (A) and quantitative analysis of Q80 aggregates (B) in NRCMs subjected to hypoxia-reoxygenation (Hyp/Reox), hypoxia (Hyp) and normoxic controls (Nor). Nuclei are red (TOPRO-3). P value is by post-hoc test. Representative of n=2 experiments. N=30–50 nuclei/group. C, D) Representative immunofluorescence images (200X) (C) and quantitative analysis (D) of alive (green) and dead (red) NRCMs treated as in A. * indicates P< 0.05 by post-hoc test; n=24–40/group. E) Representative immunofluorescence images (630X) of NRCMs loaded with ROS indicator carboxy-H2DCFDA (top), TMRE (middle) and merged (bottom) and subjected to hypoxia-reoxygenation as in A, in the presence of CsA (20μmol/L) or DMSO control. F–G) Quantitation of mean fluorescence of flow cytometric analysis of NRCMs treated as in E for ROS (F) and TMRE (G). * indicates P<0.05 vs Nor by post-hoc test (n=3–4/group). H) Cell death in NRCMs subjected to hypoxia-reoxygenation (Hyp/Reox) as in A, in the presence of ZVAD-fmk (20μmol/L), CsA (20μmol/L) or DMSO, and normoxic (Nor) control. * indicates P<0.05 vs Nor by post-hoc test (n=10–20/group).
Hypoxia-reoxygenation-induced LAMP2 decline and BECLIN-1 upregulation are mediated by ROS
The decline in LAMP2 and the increase in BECLIN-1 abundance are observed very early (2 hours) after onset of reperfusion/reoxygenation (Figure 2A, D, E; Supplemental Figure 1C), suggesting a post-translational rather than a transcriptional mechanism. As observed with in-vivo IR injury, treatment with MnTMPyP to scavenge ROS, prevented reoxygenation-induced decline in LAMP2 abundance (Figure 6A), and attenuated the increase in BECLIN-1 abundance (Figure 6B); with restoration of a relative excess of autolysosomes and decrease in total autophagic structures in NRCMs subjected to hypoxia-reoxygenation (Figure 6C, D). This suggests that reoxygenation-induced increase in ROS provokes autophagosome formation, but impairs their clearance.
Figure 6.

Hypoxia-reoxygenation-induced LAMP2 decline and BECLIN-1 upregulation are mediated via reactive oxygen species. A) Representative immunoblot (left) and quantitative analysis (right) of LAMP2 abundance in NRCMs subjected to hypoxia (6 hours) followed by reoxygenation (18 hours; Hyp/Reox) or normoxia (Nor) in presence of diluent (control) and MnTMPyP (50μmol/L); n=3/group. P values are by post-hoc test. B) Representative immunoblot (left) and quantitative analysis (right) of BECLIN-1 abundance in NRCMs treated as in A; n=4/group. P values are by post-hoc test. C) Representative immunofluorescence images (630X) depicting mCherry-GFP- LC3 expression in NCRMs treated as in A (Scale bars= 10μm); D) Quantitative analysis of autophagosomes (white bars), autolysosomes (black bars) and both (gray bars) in NRCMs treated as in A. ‘*’ indicates P< 0.05 for autophagosomes, and ‘#’ indicates P< 0.05 for total (autophagosomes+autolysosomes) as compared with respective normoxia control by post-hoc test. P values depicted are for comparisions between autophagosomes and autolysosomes by paired t-test within a group (n=15–20 nuclei/group).
Beclin-1 knockdown synergizes with exogenous expression of LAMP2 isoforms to restore autophagosome processing
Multiple studies have demonstrated the salutary effects of BECLIN-1 haplo-insuffiency in pathological states9, 10, 22, including reperfusion injury10; in contrast to its essential role in autophagosome formation23, 24 which is critical for autophagy-mediated cell survival2, 4. Whether the observed reperfusion/reoxygenation-induced increase in BECLIN-1 abundance (to supranormal levels; Figure 1D, I, Figure 2A, E and Figure 4D), or the decline in LAMP2 levels (Figure 1D, G; 2A, D; 4C, D), contributes to ROS-induced impairment in autophagosome processing, is not known. Accordingly, to test the hypothesis that partial knockdown of BECLIN-1 and restoration of LAMP2 by exogenous expression will synergistically restore autophagosome processing and attenuate hypoxia-reoxygenation induced cell death, we transduced NRCMs with increasing doses of adenovirus coding for Beclin-1shRNA expression10 and rLAMP2A and rLAMP2B, the two cardiac expressed isoforms of LAMP225, either individually or combinatorially. BECLIN-1 knockdown was minimal with the low infective dose of virus (MOI=1) and substantial with a higher dose (MOI=10) as compared with control (Figure 7A). Exogenous expression of LAMP2A and LAMP2B prevented the decline in LAMP2 levels after hypoxia-reoxygenation injury (Figure 7B, Supplemental Figure 4). Importantly, exogenous expression of LAMP2A and LAMP2B resulted in restoration of autophagosome processing, as indicated with reduced LC3-II and p62 accumulation (as compared with respective normoxia control, Figure 7B); and restoration of autolysosome predominance after hypoxia-reoxygenation injury; as compared with a predominant increase in autophagosomes in cells treated with control viruses (Figure 7C, D). The effects of Beclin-1 knockdown were dose dependent. While minimal Beclin-1 knockdown (Beclin-1 shRNA MOI=1, Figure 7A) restored autophagosome processing either singly as indicated by increased ratio of autolysosomes to autophagosomes and reduced LC3-II and p62 accumulation (as compared with respective normoxia control, Supplemental Figure 5A, B, Figure 7A); or in combination with exogenous LAMP2A and LAMP2B expression (Figure 7C, D, Supplemental Figure 5C), further knockdown of Beclin-1 (with a higher viral dose: MOI=10, Figure 7A) decreased the abundance of autophagic structures, indicating suppression of autophagosome formation (Supplemental Figure 5A and 7D). These data suggest that the increased levels of BECLIN-1 seen with reperfusion/reoxygenation contribute to the impairment in autophagosome clearance, while the basal levels of BECLIN-1 are necessary for induction of autophagosome formation in response to hypoxia-reoxygenation injury. The restoration of autophagosome processing with partial Beclin-1 knockdown (low dose) and LAMP2A/B overexpression was individually associated with reduction in hypoxia-reoxygenation-induced cell death; with the largest benefit (32% reduction in cell death) observed with a combination of these strategies (Figure 7E). Further knockdown of Beclin-1 (MOI=10) with resultant inhibition of autophagosome formation (Supplemental Fig 5A, 7D), markedly increased cell death in NRCMs cultured under normoxic conditions and in response to hypoxia-reoxygenation injury (Figure 7E), underscoring a critical role for autophagy in cardiomyocyte survival10, 20, 26.
Figure 7.
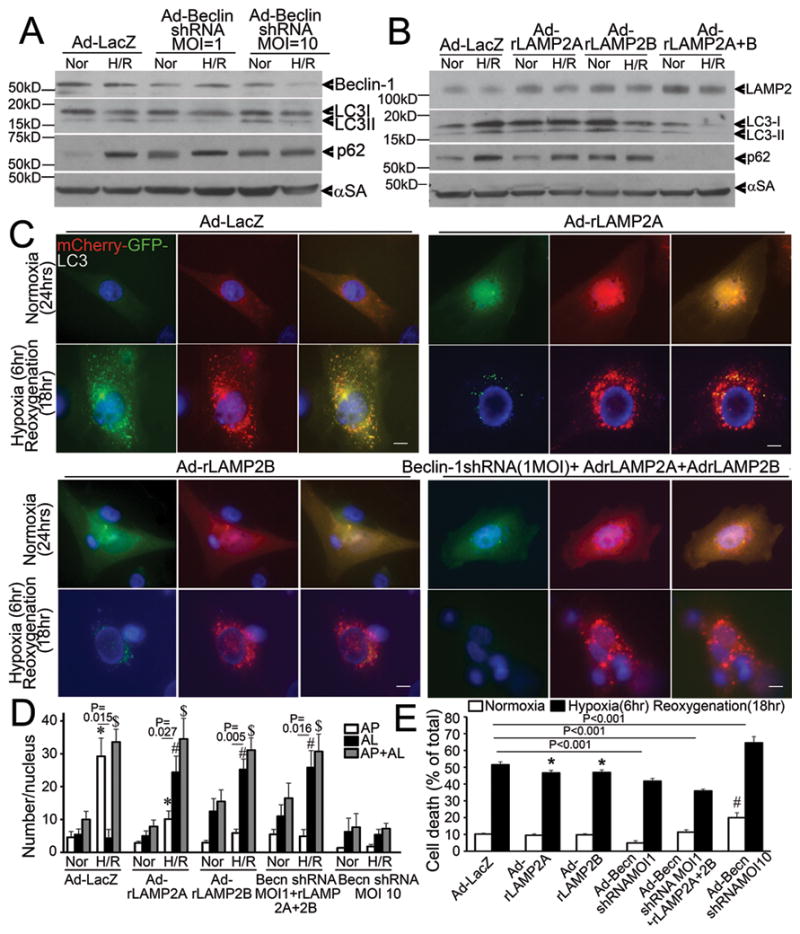
Beclin-1 knockdown and LAMP2 overexpression restore autophagosome processing and rescue cell death in NRCMs subjected to hypoxia-reoxygenation injury. A) Immunoblot depicting BECLIN-1, LC3 and p62 abundance in NRCMs treated with increasing dose of adenovirus transducing Beclin-1 shRNA (for 48 hours) and subjected to hypoxia-reoxygenation (H/R: 6/18 hours) or normoxia (Nor) as control. Representative of n=2 experiments. B) Immunoblot depicting LAMP2, LC3 and p62 expression in NRCMs transduced with adenovirus expressing rat LAMP2A and rat LAMP2B (each 10 MOI) for 24 hours and subjected to hypoxia-reoxygenation as in A. Representative of n=2 experiments. C) Representative immunofluorescent images (630X) depicting mCherry-GFP-LC3 expression in NRCMs transduced with adenovirus expressing LacZ (control), rat LAMP2A, rat LAMP2B (10MOI each); and Beclin-1shRNA (1MOI) + rat LAMP2A (10 MOI) + rat LAMP2B (10 MOI) and subjected to hypoxia-reoxygenation as in A and B. Scale bars= 10μm. D) Quantitative analysis of autophagosomes (white bars), autolysosomes (black bars) and both (gray bars) in NRCMs treated as in C. * indicates P< 0.05 vs normoxia for autophagosomes, # indicates P< 0.05 vs normoxia for autolysosomes, $ indicates P< 0.05 vs normoxia for autolysosomes+autophagosomes within the same treatment condition (n=15–20 nuclei/group) by post-hoc test. P values depicted are by paired t-test within each group. E) Cell death in NRCMs adenovirally transduced with LacZ (control), rat LAMP2A (10 MOI), rat LAMP2B (10 MOI), Beclin-1 shRNA (1 MOI), Beclin-1 shRNA (1MOI) + rat LAMP2A (10 MOI) + rat LAMP2B (10 MOI); and Beclin-1 shRNA (10 MOI) as in C. P values indicated are by post-hoc test (n=8–40/group). * indicates P< 0.05 vs LacZ treated hypoxia-reoxygenation group, # indicates P< 0.05 vs LacZ normoxic control.
BECLIN-1 abundance regulates transcription of autophagy genes
In addition to the established role for BECLIN-1 in inducing autophagosome formation, our results indicate that partial Beclin-1 knockdown enhances autophagosome processing. Indeed, while the increased total LC3 and/or p62 abundance with partial Beclin-1 knockdown (Figure 7A, Supplemental Figure 5C), could indicate suppression of autophagosome formation with secondary accumulation of these proteins; an increase in autolysosome to autophagosome ratio with hypoxia-reoxygenation (Figure 7C; Supplemental Figure 5A, B) suggests otherwise. Therefore, we examined the serial changes in protein and transcript abundance of LC3 and p62; along with that of LAMP1, levels of which track lysosome numbers15 and do not change with hypoxia-reoxygenation injury (Figure 4D); and RAB7, a small GTP binding protein that mediates autophagosome-lysosome fusion27, with Beclin-1 knockdown (with a low viral dose of MOI=1). Interestingly, partial Beclin-1 knockdown increased total LC3, p62, LAMP1 and RAB7 abundance at 48 and 72 hours (Figure 8A), as compared with non-targeting LacZ-shRNA-transduced cells, which was preceeded or accompanied by an increase in respective gene transcripts; followed by a suppression in transcript levels at 72 hours for MAP1LC3B, LAMP1, and RAB7, but not SQSTM1 (Figure 8B–E). These observations suggest that Beclin-1 knockdown activates the transcriptional machinery early (on or before 48 hours) to increase synthesis of autophagy and lysosomal proteins; which is subsequently suppressed (at 72 hours) when levels of these proteins build up; suggesting a mechanism for restoring flux by priming the autophagy pathway15. Indeed, exogenous expression of BECLIN-1 for 48 hours, stimulated autophagosome formation, but impaired autophagosome processing (Figure 8F, G) and increased levels of autophagosome-bound LC3-II and p62, with a decline in LAMP1 and RAB7 levels (Figure 8H) in a dose dependent fashion. Importantly, high levels of BECLIN-1 expression (MOI=100) suppressed gene transcription (predating the observed protein changes) for MAP1LC3B (Figure 8I), LAMP1 (Figure 8K), RAB7 (Figure 8L), but not SQSTMI (Figure 8J), and increased cell death (Figure 8M). BECLIN-1 protein levels thus appear to be a ‘sensor’ for transcriptional priming of the cellular autophagic machinery, and an important cellular control point for dictating relative abundance of relevant autophagy-lysosomal proteins. Taken together, these data suggest that ROS-induced increase in BECLIN-1 abundance could suppress autophagosome maturation via transcriptional downregulation of components of the autophagy-lysosome machinery.
Figure 8.

BECLIN-1 levels regulate transcription of autophagy genes to affect autophagosome processing. A) Representative immunoblot depicting the time course of changes in protein levels of LAMP1, LC3, p62 and RAB7 in NRCMs adenovirally transduced with shRNA targeting Beclin-1 or a LacZ as non-targeting (NT) shRNA control (both at MOI=1), at 24, 48 and 72 hours after treatment with viral particles. Representative of n=2 experiments. B–E) Real-time PCR-based quantitation of MAP1LC3B (coding for LC3), SQSTM1 (for p62), LAMP1 and RAB7 transcripts in samples treated as in A. N=4/group at each time point. P values are by t-test vs control at each time point. F) Representative immunofluorescence images (630X) demonstrating mCherry-GFP-LC3 localization in NRCMs infected with increasing doses of adenoviruses (MOI=1, 10, 50 and 100) coding for HA tagged-BECLIN-1 or LacZ as control for 48 hours. G) Quantitative analysis of autophagosomes (white bars), autolysosomes (black bars) and both (gray bars) in NRCMs treated as in A; n=10–20 nuclei/group. * and # indicate P< 0.05 vs respective control for autophagosomes and both (autophagosomes and autolysosomes), respectively, by post-hoc test. P value within each group is by paired t-test. H) Immunoblots (representative of n=2 experiments) depicting Beclin-1 (HA), LC3, p62, RAB7 and LAMP1 expression in NRCMs treated as in F. I–L) Real-time PCR-based quantitation of MAP1LC3B, SQSTM1, LAMP1and RAB7 transcripts in NRCMs adenovirally transduced with Beclin-1-HA or LacZ (100MOI) as control for 24 hours. N=4/group at each time point. P values are by t-test vs control. M) Cell death in NRCMs treated as in F; n=8–16/group. P values noted are by post-hoc test.
Discussion
In this study, we demonstrate that in ischemia-reperfusion injury, cardiomyocyte autophagy is upregulated as a stress-response mechanism but autophagosome clearance is impaired, contributing to cell death. Specifically, we found a rapid reperfusion-induced decline in LAMP2, a protein critical for autophagosome-lysosome fusion, and upregulation of BECLIN-1, which impairs autophagosome processing, with increased ROS generation and mitochondrial permeabilization, thereby provoking cardiomyocyte death. Facilitating autophagosome processing by restoring LAMP2 levels and partially knocking down BECLIN-1, restores autophagosome processing, and attenuates reoxygenation-induced cell death.
Contemporary studies in cardiomyocytes subjected to hypoxia-reoxygenation have demonstrated accumulation of autophagosomes20, LC3-II and p6210, 28; and decline in nicotinamide phosphoribosyltransferase (Nampt) which impairs autophagosome processing28, indicating impaired ‘autophagic flux’ in-vitro. Conversely, increases in both autophagosomes and autolysosomes (as indicated by mRFP-GFP LC3)29 were interpreted as ‘intact’ flux, in-vivo. These discrepant observations reflect the limitations of various ‘imperfect’ tools to monitor flux through the autophagy pathway. Indeed, the lack of equivalent fluorescence intensity and photostability of mRFP and GFP employed in the dual fluorescent construct29 and differential kinetics of GFP degradation depending on the state of lysosome acidification30 may account for the variable readouts. We have attempted to overcome these limitations by generating a LC3 construct tandem tagged with mCherry and GFP probes, which have comparable intensities and photostability31, ruled out alterations in lysosomal acidification and employed complementary approaches allowing for increased accuracy in assessment of autophagic flux.
Our results explain why autophagy, which facilitates cardiomyocyte survival (with reduced infarct size) during ischemia10, 32, has been implicated in causing cell death (with increased infarct size) upon reperfusion of the ischemic myocardium10. In the study by Matsui et al, reperfusion provoked a 7-fold increase in autophagosome abundance in the absence of further AMPK activation or mTOR inhibition, seen during the ischemic phase. Importantly, reperfusion was associated with a rapid upregulation of BECLIN-1 (within 30 minutes); and BECLIN-1 haplo-insufficient mice demonstrated a decrease in cardiomyocyte autophagosome abundance, reduced programmed cell death and reduction in infarct size with in-vivo IR injury, as compared with wild-type controls. The assumption that BECLIN-1 haplo-insufficiency leads to a reduction in autophagosome abundance primarily by preventing autophagy initiation, is challenged by our results that demonstrate that it increased autophagosome processing, i.e., increased autophagic flux, likely by relieving the transcriptional downregulation of the autophagy-lysosome machinery by supranormal BECLIN-1 levels, while enough BECLIN-1 protein is available to facilitate autophagosome formation (Figure 8). A more complete knockdown of BECLIN-1, however, impairs autophagosome formation, thereby impairing autophagy, with increased cardiomyocyte death. Beclin-1 knockdown may also restore autophagosome processing by interrupting interaction with Rubicon, a GTPase regulating protein that localizes to late endosome/autophagosomes and inhibits autophagic flux33. The observation that Beclin-1 knockdown confers benefit above and beyond that with LAMP2 overexpression, despite restoration of autophagy to a similar extent (Figure 7C, D), suggests that other mechanisms such as a reduction in p53 levels34 or restoration of mitochondrial homeostasis22 could be operative. Interestingly, the possibility that Beclin-1 knockdown may upregulate transcription of LAMP2, may explain the very similar degree of benefit obtained with Beclin-1 knockdown alone versus in combination with LAMP2A+2B overexpression (Figure 7E). Thus, BECLIN-1 abundance may act as a ‘switch’ to determine whether the end result of autophagy is efficient autophagic degradation of targeted cargo to ensure cellular homeostasis and survival, or autophagosome accumulation, triggering programmed cell death. Such a role for BECLIN-1 is consistent with the observation that it acts as tumor suppressor protein23, 24.
A novel observation of this study is a rapid decline in LAMP2 abundance with reperfusion. LAMP2 is a critical determinant of autophagosome-lysosome fusion18, 19. LAMP2 knockdown impairs autophagy in nutrient-starved adult rat ventricular myocytes and causes cell death at levels comparable with autophagy inhibition with 3MA26; and ablation of LAMP28 or loss of LAMP2 protein due to mutations in individuals with Danon disease7, causes cardiomyocyte autophagosome accumulation and extensive myocardial fibrosis35, suggesting cell death as the pathogenic mechanism. Interestingly, exogenous expression of both LAMP2A, a protein receptor for chaperone mediated autophagy36, and LAMP2B, which is postulated to be involved in autophagosome-lysosome fusion7, 18, accelerated autophagosome processing, suggesting a redundant role for these isoforms in the heart.
Given the exploratory nature of the study, the type I error rate was not controlled across multiple experimental outcomes, which would require additional studies focusing on specific associations. Nevertheless, our results, which require confirmation in adult cardiac myocytes and the in-vivo heart, suggest that impaired autophagosome clearance results in increased ROS levels, which trigger mitochondrial permeabilization leading to a necrotic mechanism of cell death in cardiac ischemia-reperfusion injury; and underscore the need for careful evaluation of autophagic flux to determine its role in cardiac stress and physiology.
Supplementary Material
Acknowledgments
We thank Michel Jadot, Ph.D., Laboratoire de Chimie Physiologique, Namur, for his kind gift of the monoclonal antibody targeted to matrix side of LAMP2; and Junichi Sadoshima, Ph.D., UMDNJ and Conrad Weihl, M.D., Ph.D., Washington University for their generous gifts of adenovirus expressing shRNA targeting Beclin-1 and CFP-tagged polyglutamine constructs, respectively. We express our sincere gratitude to Paul Saftig, Ph.D, University of Kiel and Douglas L. Mann, M.D., Washington University, for their insightful comments and support; and Eric Novak, M.S., Washington University, for statistical assistance.
Funding Sources: This study was supported by grants from NIH (HL107594), Department of Veterans Affairs (I01 BX000448) and American Heart Association (0735135N SDG) to A. Diwan.
Footnotes
Conflict of Interest Disclosures: None
References
- 1.Yang Z, Klionsky DJ. Mammalian autophagy: core molecular machinery and signaling regulation. Curr Opin Cell Biol. 2010;22:124–131. doi: 10.1016/j.ceb.2009.11.014. [DOI] [PMC free article] [PubMed] [Google Scholar]
- 2.Galluzzi L, Morselli E, Vicencio JM, Kepp O, Joza N, Tajeddine N, Kroemer G. Life, death and burial: multifaceted impact of autophagy. Biochem Soc Trans. 2008;36:786–790. doi: 10.1042/BST0360786. [DOI] [PubMed] [Google Scholar]
- 3.Kroemer G, Galluzzi L, Vandenabeele P, Abrams J, Alnemri ES, Baehrecke EH, Blagosklonny MV, El-Deiry WS, Golstein P, Green DR, Hengartner M, Knight RA, Kumar S, Lipton SA, Malorni W, Nunez G, Peter ME, Tschopp J, Yuan J, Piacentini M, Zhivotovsky B, Melino G. Classification of cell death: recommendations of the Nomenclature Committee on Cell Death 2009. Cell Death Differ. 2009;16:3–11. doi: 10.1038/cdd.2008.150. [DOI] [PMC free article] [PubMed] [Google Scholar]
- 4.Kroemer G, Levine B. Autophagic cell death: the story of a misnomer. Nat Rev Mol Cell Biol. 2008;9:1004–1010. doi: 10.1038/nrm2527. [DOI] [PMC free article] [PubMed] [Google Scholar]
- 5.Kuma A, Hatano M, Matsui M, Yamamoto A, Nakaya H, Yoshimori T, Ohsumi Y, Tokuhisa T, Mizushima N. The role of autophagy during the early neonatal starvation period. Nature. 2004;432:1032–1036. doi: 10.1038/nature03029. [DOI] [PubMed] [Google Scholar]
- 6.Nakai A, Yamaguchi O, Takeda T, Higuchi Y, Hikoso S, Taniike M, Omiya S, Mizote I, Matsumura Y, Asahi M, Nishida K, Hori M, Mizushima N, Otsu K. The role of autophagy in cardiomyocytes in the basal state and in response to hemodynamic stress. Nat Med. 2007;13:619–624. doi: 10.1038/nm1574. [DOI] [PubMed] [Google Scholar]
- 7.Nishino I, Fu J, Tanji K, Yamada T, Shimojo S, Koori T, Mora M, Riggs JE, Oh SJ, Koga Y, Sue CM, Yamamoto A, Murakami N, Shanske S, Byrne E, Bonilla E, Nonaka I, DiMauro S, Hirano M. Primary LAMP-2 deficiency causes X-linked vacuolar cardiomyopathy and myopathy (Danon disease) Nature. 2000;406:906–910. doi: 10.1038/35022604. [DOI] [PubMed] [Google Scholar]
- 8.Tanaka Y, Guhde G, Suter A, Eskelinen EL, Hartmann D, Lullmann-Rauch R, Janssen PM, Blanz J, von Figura K, Saftig P. Accumulation of autophagic vacuoles and cardiomyopathy in LAMP-2-deficient mice. Nature. 2000;406:902–906. doi: 10.1038/35022595. [DOI] [PubMed] [Google Scholar]
- 9.Zhu H, Tannous P, Johnstone JL, Kong Y, Shelton JM, Richardson JA, Le V, Levine B, Rothermel BA, Hill JA. Cardiac autophagy is a maladaptive response to hemodynamic stress. J Clin Invest. 2007;117:1782–1793. doi: 10.1172/JCI27523. [DOI] [PMC free article] [PubMed] [Google Scholar]
- 10.Matsui Y, Takagi H, Qu X, Abdellatif M, Sakoda H, Asano T, Levine B, Sadoshima J. Distinct roles of autophagy in the heart during ischemia and reperfusion: roles of AMP-activated protein kinase and Beclin 1 in mediating autophagy. Circ Res. 2007;100:914–922. doi: 10.1161/01.RES.0000261924.76669.36. [DOI] [PubMed] [Google Scholar]
- 11.Iwai-Kanai E, Yuan H, Huang C, Sayen MR, Perry-Garza CN, Kim L, Gottlieb RA. A method to measure cardiac autophagic flux in vivo. Autophagy. 2008;4:322–329. doi: 10.4161/auto.5603. [DOI] [PMC free article] [PubMed] [Google Scholar]
- 12.Klionsky DJ. Cell biology: regulated self-cannibalism. Nature. 2004;431:31–32. doi: 10.1038/431031a. [DOI] [PubMed] [Google Scholar]
- 13.Diwan A, Krenz M, Syed FM, Wansapura J, Ren X, Koesters AG, Li H, Kirshenbaum LA, Hahn HS, Robbins J, Jones WK, Dorn GW. Inhibition of ischemic cardiomyocyte apoptosis through targeted ablation of Bnip3 restrains postinfarction remodeling in mice. J Clin Invest. 2007;117:2825–2833. doi: 10.1172/JCI32490. [DOI] [PMC free article] [PubMed] [Google Scholar]
- 14.Ju JS, Miller SE, Hanson PI, Weihl CC. Impaired protein aggregate handling and clearance underlie the pathogenesis of p97/VCP-associated disease. J Biol Chem. 2008;283:30289–99. doi: 10.1074/jbc.M805517200. [DOI] [PMC free article] [PubMed] [Google Scholar]
- 15.Ma X, Godar RJ, Liu H, Diwan A. Enhancing lysosome biogenesis attenuates BNIP3-induced cardiomyocyte death. Autophagy. 2012:8. doi: 10.4161/auto.18658. [DOI] [PMC free article] [PubMed] [Google Scholar]
- 16.Bjorkoy G, Lamark T, Pankiv S, Overvatn A, Brech A, Johansen T. Monitoring autophagic degradation of p62/SQSTM1. Methods Enzymol. 2009;452:181–197. doi: 10.1016/S0076-6879(08)03612-4. [DOI] [PubMed] [Google Scholar]
- 17.Andrejewski N, Punnonen EL, Guhde G, Tanaka Y, Lullmann-Rauch R, Hartmann D, von FK, Saftig P. Normal lysosomal morphology and function in LAMP-1-deficient mice. J Biol Chem. 1999;274:12692–12701. doi: 10.1074/jbc.274.18.12692. [DOI] [PubMed] [Google Scholar]
- 18.Eskelinen EL, Illert AL, Tanaka Y, Schwarzmann G, Blanz J, von FK, Saftig P. Role of LAMP-2 in lysosome biogenesis and autophagy. Mol Biol Cell. 2002;13:3355–3368. doi: 10.1091/mbc.E02-02-0114. [DOI] [PMC free article] [PubMed] [Google Scholar]
- 19.Huynh KK, Eskelinen EL, Scott CC, Malevanets A, Saftig P, Grinstein S. LAMP proteins are required for fusion of lysosomes with phagosomes. EMBO J. 2007;26:313–324. doi: 10.1038/sj.emboj.7601511. [DOI] [PMC free article] [PubMed] [Google Scholar]
- 20.Hamacher-Brady A, Brady NR, Gottlieb RA. Enhancing macroautophagy protects against ischemia/reperfusion injury in cardiac myocytes. J Biol Chem. 2006;281:29776–29787. doi: 10.1074/jbc.M603783200. [DOI] [PubMed] [Google Scholar]
- 21.Jadot M, Wattiaux R, Mainferme F, Dubois F, Claessens A, Wattiaux-De CS. Soluble form of Lamp II in purified rat liver lysosomes. Biochem Biophys Res Commun. 1996;223:353–359. doi: 10.1006/bbrc.1996.0898. [DOI] [PubMed] [Google Scholar]
- 22.Valentin-Vega YA, Maclean KH, Tait-Mulder J, Milasta S, Steeves M, Dorsey FC, Cleveland JL, Green DR, Kastan MB. Mitochondrial dysfunction in ataxia-telangiectasia. Blood. 2012;119:1490–1500. doi: 10.1182/blood-2011-08-373639. [DOI] [PMC free article] [PubMed] [Google Scholar]
- 23.Qu X, Yu J, Bhagat G, Furuya N, Hibshoosh H, Troxel A, Rosen J, Eskelinen EL, Mizushima N, Ohsumi Y, Cattoretti G, Levine B. Promotion of tumorigenesis by heterozygous disruption of the beclin 1 autophagy gene. J Clin Invest. 2003;112:1809–1820. doi: 10.1172/JCI20039. [DOI] [PMC free article] [PubMed] [Google Scholar]
- 24.Yue Z, Jin S, Yang C, Levine AJ, Heintz N. Beclin 1, an autophagy gene essential for early embryonic development, is a haploinsufficient tumor suppressor. Proc Natl Acad Sci U S A. 2003;100:15077–15082. doi: 10.1073/pnas.2436255100. [DOI] [PMC free article] [PubMed] [Google Scholar]
- 25.Konecki DS, Foetisch K, Zimmer KP, Schlotter M, Lichter-Konecki U. An alternatively spliced form of the human lysosome-associated membrane protein-2 gene is expressed in a tissue-specific manner. Biochem Biophys Res Commun. 1995;215:757–767. doi: 10.1006/bbrc.1995.2528. [DOI] [PubMed] [Google Scholar]
- 26.Maruyama R, Goto K, Takemura G, Ono K, Nagao K, Horie T, Tsujimoto A, Kanamori H, Miyata S, Ushikoshi H, Nagashima K, Minatoguchi S, Fujiwara T, Fujiwara H. Morphological and biochemical characterization of basal and starvation-induced autophagy in isolated adult rat cardiomyocytes. Am J Physiol Heart Circ Physiol. 2008;295:H1599–H1607. doi: 10.1152/ajpheart.91449.2007. [DOI] [PubMed] [Google Scholar]
- 27.Hariharan N, Maejima Y, Nakae J, Paik J, Depinho RA, Sadoshima J. Deacetylation of FoxO by Sirt1 Plays an Essential Role in Mediating Starvation-Induced Autophagy in Cardiac Myocytes. Circ Res. 2010;107:1470–1482. doi: 10.1161/CIRCRESAHA.110.227371. [DOI] [PMC free article] [PubMed] [Google Scholar]
- 28.Hsu CP, Oka S, Shao D, Hariharan N, Sadoshima J. Nicotinamide phosphoribosyltransferase regulates cell survival through NAD+ synthesis in cardiac myocytes. Circ Res. 2009;105:481–491. doi: 10.1161/CIRCRESAHA.109.203703. [DOI] [PMC free article] [PubMed] [Google Scholar]
- 29.Hariharan N, Zhai P, Sadoshima J. Oxidative Stress Stimulates Autophagic Flux during Ischemia/Reperfusion. Antioxid Redox Signal. 2010;14:2179–2190. doi: 10.1089/ars.2010.3488. [DOI] [PMC free article] [PubMed] [Google Scholar]
- 30.Ni HM, Bockus A, Wozniak AL, Jones K, Weinman S, Yin XM, Ding WX. Dissecting the dynamic turnover of GFP-LC3 in the autolysosome. Autophagy. 2011;7:54–70. doi: 10.4161/auto.7.2.14181. [DOI] [PMC free article] [PubMed] [Google Scholar]
- 31.Shaner NC, Lin MZ, McKeown MR, Steinbach PA, Hazelwood KL, Davidson MW, Tsien RY. Improving the photostability of bright monomeric orange and red fluorescent proteins. Nat Methods. 2008;5:545–551. doi: 10.1038/nmeth.1209. [DOI] [PMC free article] [PubMed] [Google Scholar]
- 32.Yan L, Sadoshima J, Vatner DE, Vatner SF. Autophagy: a novel protective mechanism in chronic ischemia. Cell Cycle. 2006;5:1175–1177. doi: 10.4161/cc.5.11.2787. [DOI] [PubMed] [Google Scholar]
- 33.Matsunaga K, Saitoh T, Tabata K, Omori H, Satoh T, Kurotori N, Maejima I, Shirahama-Noda K, Ichimura T, Isobe T, Akira S, Noda T, Yoshimori T. Two Beclin 1-binding proteins, Atg14L and Rubicon, reciprocally regulate autophagy at different stages. Nat Cell Biol. 2009;11:385–396. doi: 10.1038/ncb1846. [DOI] [PubMed] [Google Scholar]
- 34.Liu J, Xia H, Kim M, Xu L, Li Y, Zhang L, Cai Y, Norberg HV, Zhang T, Furuya T, Jin M, Zhu Z, Wang H, Yu J, Li Y, Hao Y, Choi A, Ke H, Ma D, Yuan J. Beclin1 controls the levels of p53 by regulating the deubiquitination activity of USP10 and USP13. Cell. 2011;147:223–234. doi: 10.1016/j.cell.2011.08.037. [DOI] [PMC free article] [PubMed] [Google Scholar]
- 35.Maron BJ, Roberts WC, Arad M, Haas TS, Spirito P, Wright GB, Almquist AK, Baffa JM, Saul JP, Ho CY, Seidman J, Seidman CE. Clinical outcome and phenotypic expression in LAMP2 cardiomyopathy. JAMA. 2009;301:1253–1259. doi: 10.1001/jama.2009.371. [DOI] [PMC free article] [PubMed] [Google Scholar]
- 36.Cuervo AM, Dice JF. A receptor for the selective uptake and degradation of proteins by lysosomes. Science. 1996;273:501–503. doi: 10.1126/science.273.5274.501. [DOI] [PubMed] [Google Scholar]
Associated Data
This section collects any data citations, data availability statements, or supplementary materials included in this article.