

Abstract
Mitochondria are the essential eukaryotic organelles that produce most cellular energy. The energy production and supply by mitochondria appear closely associated with the continuous shape change of mitochondria mediated by fission and fusion, as evidenced not only by the hereditary diseases caused by mutations in fission/fusion genes but also by aberrant mitochondrial morphologies associated with numerous pathologic insults. However, how morphological change of mitochondria is linked to their energy-producing activity is poorly understood. In this study, we found that perturbation of mitochondrial fission induces a unique mitochondrial uncoupling phenomenon through a large-scale fluctuation of a mitochondrial inner membrane potential. Furthermore, by genetically controlling mitochondrial fission and thereby inducing mild proton leak in mice, we were able to relieve these mice from oxidative stress in a hyperglycemic model. These findings provide mechanistic insight into how mitochondrial fission participates in regulating mitochondrial activity. In addition, these results suggest a potential application of mitochondrial fission to control mitochondrial reactive oxygen species production and oxidative stress in many human diseases.
Fission and fusion of mitochondria are universal cellular processes mediated by conserved machineries. The main components of the fission and fusion machineries in mammals are the dynamin-related guanosine-5′-triphosphate (GTP)ases, dynamin-like protein (DLP)1/dynamin-related protein (Drp)1 for fission, and mitofusins (Mfn1 and Mfn2) and optic atrophy 1 (OPA1) for fusion (1). Knockout mouse models for these GTPases are embryonic lethal (2–5), indicating the critical role of mitochondrial fission and fusion. Mutations in fission/fusion genes have also been found to cause human hereditary disease or death (6–10). Furthermore, abnormal mitochondrial morphologies are associated with many disease pathologies, including but not limited to neurodegeneration, cardiomyopathy, metabolic diseases, and aging (11–17). Although this information indicates the functional significance of mitochondrial morphology control, mechanistic details of how mitochondrial fission and fusion participate in regulating mitochondrial functionality remain ill defined.
Reactive oxygen species (ROS) production from the electron transport chain (ETC) is an inevitable by-product of aerobic respiration. Although cells possess antioxidant mechanisms and use ROS for cellular signaling (18), high levels of ROS cause harmful effects on many cellular processes. Elevated mitochondrial ROS have been shown to be the main cause of oxidative damage in excess metabolic substrates (19–22). In this study, we have identified a unique mitochondrial proton leak phenomenon that occurs when mitochondrial fission is disrupted. Using a new transgenic mouse model that expresses a dominant-negative fission mutant, we have demonstrated that controlling mitochondrial fission and thus the proton leak could ameliorate oxidative stress in hyperglycemic conditions. These findings provide not only the mechanisms of how mitochondrial fission regulates the mitochondrial ETC activity but also the first experimental evidence for targeting mitochondrial fission in diabetic oxidative stress in vivo.
RESEARCH DESIGN AND METHODS
Mouse primary hepatocyte preparation and culture.
Hepatocytes were isolated from 8- to 12-week-old mice. Livers were perfused via the portal vein sequentially with perfusion buffer (1× Hanks’ balanced salt solution [HBSS] containing 0.5 mmol/L EDTA, and 5 mmol/L HEPES, pH 7.2), and collagenase buffer (1 mg/mL collagenase type I in 1× HBSS, 0.5 mmol/L CaC12, 5 mmol/L HEPES, pH 7.2). Cells were suspended in Waymouth medium with 10% FBS, 10 nmol/L dexamethasone, 100 nmol/L insulin, 20 mmol/L fructose, and 5 mmol/L glycine, filtered, and centrifuged for 2 min at 50g. Cells were plated on collagen-coated 35-mm dishes at 106 cells/plate. Cultures were washed once with PBS after 3 h to remove unattached cells. Cells were infected overnight with Ad-DLP1-K38A or adenovirus-carrying green fluorescent protein (Ad-GFP) and analyzed within 48 h after isolation.
All animal experiments were performed according to procedures approved by the University Committee on Animal Resources of University of Rochester Medical Center.
Mitochondrial morphology analyses.
Mitochondria-targeted GFP was expressed to visualize hepatocyte mitochondria. Confocal stacks were obtained and reconstructed with an Olympus FV1000 laser scanning confocal microscope. Mitochondrial shape analyses were performed using ImageJ software. Individual mitochondria were analyzed for form factor (FF) and aspect ratio (AR). AR is a measure of mitochondrial length, and an increase of FF represents an increase of mitochondrial shape complexity (23). For shape analyses in electron photomicrographs, individual mitochondria were traced, and the shape parameters were acquired using ImageJ software.
Oxygen consumption and ATP measurements.
Oxygen consumption was measured by using a Clark-type O2 electrode in a sealed chamber (Mitocell 200 system, Strathkelvin Instruments). Decreases of the O2 concentration in the chamber were measured as whole-cell oxygen consumption. Oligomycin was added to measure oxygen consumption in the absence of the ATP synthase activity and maximal respiration was obtained by adding the protonophore carbonylcyanide-p-trifluoromethoxyphenylhydrazone (FCCP). For respiration of semi-intact cells, cells were permeabilized with digitonin (10 μg/mL), and oxygen consumption was measured by sequentially adding glutamate (10 mmol/L)/malate (5 mmol/L), ADP (2 mmol/L), rotenone (0.5 μmol/L), succinate (10 mmol/L), antimycin A (5 μmol/L), and N,N,N′,N′-tetramethyl-p-phenylenediamine dihydrochloride (TMPD; 0.5 mmol/L)/ascorbate (2 mmol/L)/cytochrome c (10 μmol/L). For mitochondrial isolation, the mitochondrial fraction was separated by differential centrifugation. A mitochondrial pellet was obtained at 9,000g in a buffer containing 10 mmol/L HEPES (pH 7.4), 250 mmol/L sucrose, and 2 mmol/L EDTA. Pyruvate/malate (10 mmol/L each) was added to mitochondria for state 2 respiration. State 3 respiration was initiated by adding 200 μmol/L ADP, and state 4 respiration was measured after ADP depletion. Cellular ATP contents were measured by a luminescence assay using the ATPlite ATP detection system (Perkin-Elmer) and normalized by total protein concentration.
Transgenic mice expressing DLP1-K38A.
Transgenic mice carrying tetracycline-responsive element (TRE)-DLP1-K38A were generated by pronuclei injection of fertilized eggs. A bidirectional promoter cis-controlled by TRE was used for expressing DLP1-K38A and enhanced GFP (EGFP). TRE-DLP1-K38A mice were crossed with mice carrying reverse tetracycline-responsive transcriptional activator (rtTA)2s-M2 under the control of the ROSA26 promoter (R26rtTA) to generate the double transgenic mice dTg[rtTA/DLP1-K38A]. PCR primers for genotyping were: 5′-AAGCTGCAGGACGTCTTCAACACCGTGGGCGCC-3′ and 5′-GGATCTACCTCTCTGGAAATCTTAAGTGCCTCTGAC-3′ for DLP1, 5′-GGAACAGGAGCATCAAGTAGC-3′ and 5′-GCGTCAGCAGGCAGCATATC-3′ for R26rtTA, and 5′-TCAAGGACGACGGCAACTACAAGA-3′ and 5′- AGGACCATGTGATCGCGCTTCTC-3′ for EGFP. For transgene expression, doxycycline (Dox; Sigma) was continuously supplied ad libitum in drinking water at 2 mg/mL 5% sucrose or in chow at 200 mg/kg (Bioserv).
RT-PCR.
Total RNA from homogenized tissue was DNase-digested and reverse-transcribed using the ACCESS RT System (Promega). RT-PCR primers were: 5′-GGAACTCAGAGCAGTGGAGCG-3′ and 5′-CCTCTCTGGAAATCTTAAGTGCCTCTGAC-3′ for DLP1-K38A, 5′-GTGTTAT TCCTCATGGACTGAATATGG-3′ and 5′-ACCATTTTGGGGCTGTACTGC-3′ for HPRT, and 5′-TGATCGCGCTTCTCGTTGGG-3′ and 5′-ACGGCAACTACAAGACCCGC-3′ for EGFP. PCR cycle conditions were 95°C for 5 min, then 35 cycles of 95°C for 45 seconds; 65°C, 58.5°, and 49° for 45 seconds for EGFP, DLP1-K38A, and HPRT, respectively, and 1 min 15 seconds at 72°C.
Immunohistochemistry.
Tissues were fixed in 4% paraformaldehyde ex vivo immediately after extraction or using whole-body perfusion. Indirect immunofluorescence was performed on 15-μm tissue sections cut from optimal cutting temperature (OCT) media-embedded fixed tissue. Mouse anti-DLP1 (BD Biosciences) and rabbit anti-GFP antibodies (Invitrogen) were used for immunostaining.
Induction of hyperglycemia.
Hyperglycemia was induced by pancreatic β-cell ablation using streptozotocin (STZ). Male double-transgenic dTg[rtTA/K38A] and age- and sex-matched control mice (8–10 weeks) were fasted 4 h before STZ injection. The control mice were male single-transgenic rtTA littermates or the littermate-derived inbred rtTA mice. Dox feeding was commenced 2 days before the STZ injection. STZ was diluted in sodium citrate buffer (pH 4.5) and intraperitoneally injected in one large bolus of 200 mg/kg or over 5 consecutive days at 50 mg/kg. Blood from the tail was monitored using a blood glucose monitor (LifeScan, Inc.) to verify elevated circulating glucose levels (>400 mg/dL) 48 h after the final injection. Mice were killed between 3 and 8 weeks after the induction of hyperglycemia for evaluation in end point assays.
ROS assays.
ROS levels were detected using the fluorescent probe dihydroethidium (DHE; Invitrogen) per the manufacturer’s instructions. Removed tissues were bathed in Krebs-Ringers bicarbonate buffer before rapidly freezing in OCT and sectioning at 15 μm. DHE imaging and quantification was done as previously described (24).
Oxidative stress assessments.
To assess protein carbonylation, extracts were made from equivalent masses of hepatic or renal tissue homogenized in radioimmunoprecipitation assay buffer containing protease inhibitor cocktail (Sigma) and 10 mmol/L DTT, and processed using the Oxyblot (Millipore) system per the manufacturer’s instructions. The resultant nonsaturated Western signal was scanned and quantified using ImageJ software. Nitrotyrosine and 4-hydroxynonenal modifications were evaluated by immunoblotting using anti-nitrotyrosine (Millipore) and anti-HNE (R&D Systems) antibodies, respectively, and normalized against actin (anti–β-actin, Sigma).
Statistical analysis.
Error bars in all graphs represent the SEM. The Student t test (two-tailed, unpaired) was used to compare the two groups. The P value was calculated with Microsoft Excel. P < 0.05 was considered as statistically significant.
RESULTS
Inhibition of mitochondrial fission induces the formation of enlarged and interconnected mitochondria in primary hepatocytes.
To gain insight for a bioenergetic role of mitochondrial fission, we expressed a dominant-negative fission mutant, DLP1-K38A, and assessed mitochondrial morphology and activity. To facilitate detection of changes in mitochondrial function, we used primary hepatocytes that possess a robust mitochondrial activity compared with established cell lines or fibroblasts. Mitochondria in primary mouse hepatocytes were compactly distributed throughout the cytoplasm. The most prevalent mitochondrial morphology in hepatocytes included spherical and oblong shapes, unlike filamentous mitochondrial morphology observed in many immortalized cell lines (Fig. 1A and A′). DLP1 was distributed in the cytoplasm as punctate spots that were frequently associated with mitochondria (Supplementary Fig. 1). We expressed DLP1-K38A through adenoviral transduction (Ad-DLP1-K38A) to inhibit mitochondrial fission (24). DLP1-K38A expression induced the formation of characteristic DLP1-containing aggregates in the cytoplasm (Supplementary Fig. 1) (25,26). In cell types containing filamentous networks of mitochondria, the fission inhibition induces long and entangled mitochondria (26,27). In hepatocytes, however, ball-shape mitochondria became larger, and enlarged mitochondria were often connected by thin tubular mitochondria after DLP1-K38A expression (Fig. 1B and B′). In addition, long filamentous mitochondria were found in the peripheral cytoplasmic region (Fig. 1B).
FIG. 1.

DLP1-K38A expression in hepatocytes induces the formation of enlarged and interconnected mitochondria. Mitochondria in hepatocytes were visualized by mitochondrially targeted GFP using confocal microscopy. A and A′ (inset): Mitochondria in control cells were mostly spherical and oval shape. B and B′ (inset): Expression of DLP1-K38A induced mitochondrial enlargement and deformation. Filamentous tubular mitochondria are readily visible. Scale bars: 5 μm. C: Mitochondrial morphology analyses. Calculated values of the FF and AR were plotted for individual mitochondria. AR and FF representing shape circularity and complexity are both minimal in control hepatocytes, whereas both values increased upon DLP1-K38A expression. D: Frequency plots indicate small and uniform mitochondria in control hepatocytes. Larger mitochondria were more frequently found in DLP1-K38A–expressing cells. (A high-quality digital representation of this figure is available in the online issue.)
Morphometric analyses of mitochondria indicated that AR and FF, representing shape circularity and complexity, were minimal in control hepatocytes, whereas both values increased upon DLP1-K38A expression (Fig. 1C). Mitochondrial sizes in control cells were small and uniform compared with those in DLP1-K38A–expressing cells, where larger mitochondria were more frequently found (Fig. 1D). In transmission electron photomicrographs of cultured hepatocytes, mitochondria were observed mostly as circular and elliptical shapes in control cells (Fig. 2A and B). In cells expressing DLP1-K38A, many mitochondria had tapered and pointed edges, presumably continuous with filamentous extensions (Fig. 2C and D). In addition, mitochondria connected by a narrow neck were frequently found along with thin tubular mitochondria (Fig. 2E). Matrix density and cristae morphology were normal in cells expressing DLP1-K38A. These morphologic observations indicate that inhibiting mitochondrial fission in hepatocytes induces the formation of enlarged and interconnected mitochondria.
FIG. 2.
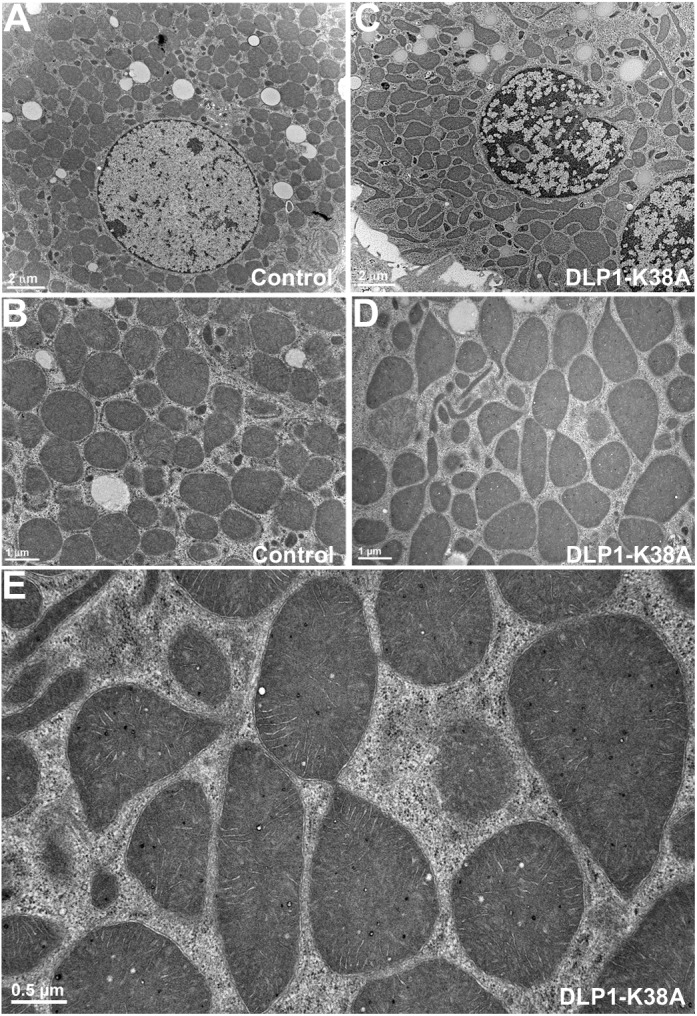
Ultrastructural images of hepatocyte mitochondria. A and B: Electron photomicrographs of control hepatocytes show circles and ovals for mitochondrial sections. C–E: Electron photomicrographs show mitochondria in DLP1-K38A–expressing cells. C and D: Irregular shapes of mitochondria are prevalent along with thin tubules. E: A higher magnification image shows mitochondria with narrow constrictions and connections.
Inhibition of mitochondrial fission increases mitochondrial inner membrane proton leak.
To test the functional consequence of inhibiting mitochondrial fission, oxygen consumption rate (OCR) was measured to evaluate the mitochondrial ETC activity. Along with Ad-DLP1-K38A, Ad-GFP was used as an infection control. Surprisingly, cells expressing DLP1-K38A showed a higher rate of the steady-state respiration than control cells (Fig. 3A and B). This difference in OCR became even more pronounced upon the addition of the ATP synthase inhibitor oligomycin (Fig. 3B). An oxygraph revealed that DLP1-K38A cells still maintain a substantial rate of respiration in the presence of oligomycin (Fig. 3A). These results indicate that DLP1-K38A expression induces an increase in mitochondrial inner membrane proton leak (uncoupling). The addition of FCCP to cells expressing DLP1-K38A resulted in a maximum respiration rate indistinguishable from that of control cells, indicating that the ETC in DLP1-K38A cells is functionally intact and retains the normal capacity. The ratio of the leak rate to the maximum rate (oligomycin rate-to-FCCP rate) was substantially higher in cells expressing DLP1-K38A (Fig. 3C).
FIG. 3.

Expression of DLP1-K38A induces the mitochondrial inner membrane proton leak. A: An oxygraph shows increased respiration by cells expressing DLP1-K38A. B: Calculated OCR indicates that cells expressing DLP1-K38A have higher rate of oxygen consumption in the steady state and in the presence of oligomycin. The maximum OCR in the presence of FCCP shows no significant difference between control and DLP1-K38A cells. Error bars represent SEM. Results are n = 12. P < 0.005 at the steady state and with oligomycin comparing with Ad-GFP-infected cells. C: The leak ratio is presented as the ratio of the OCR with oligomycin to the maximum OCR (OCROligomycin/OCRFCCP). The leak ratio is significantly higher in DLP1-K38A cells. Error bars are SEM. *P < 0.01 with Ad-GFP and *P < 0.05 with uninfected control. D: Respiration of semi-intact cells to evaluate individual complex activities. Glutamate/malate, ADP, rotenone, succinate, antimycin A, and TMPD/ascorbate/cytochrome c were sequentially added to digitonin-permeabilized cells for OCR measurements. Relative activities of complex I, II, and IV between Ad-GFP and Ad-DLP1-K38A cells were compared by the OCRs after adding glutamate/malate/ADP, succinate, and TMPD/ascorbate/cytochrome c, respectively. Results are n = 3 for Ad-GFP and n = 5 for Ad-DLP1-K38A.
To substantiate no detrimental effect on the ETC activity arising with DLP1-K38A expression, respiratory complex activities were analyzed in permeabilized semi-intact cells. Activities of complex I, II, and IV were examined by measuring OCR upon adding complex-specific substrates to permeabilized cells. We found no statistically significant difference between control and DLP1-K38A cells in these complex activities (Fig. 3D), indicating no direct effect of DLP1-K38A expression on individual ETC complexes.
Expression of DLP1-K38A induces a large-scale fluctuation of the mitochondrial inner membrane potential.
The mitochondrial inner membrane potential is an important parameter for mitochondrial functionality. We assessed the membrane potential by the dynamic potentiometric dye tetramethylrhodamine ethyl ester (TMRE). The TMRE fluorescence intensity showed no overall difference in control and DLP1-K38A cells, although there appeared to be larger cell-to-cell variations in cells expressing DLP1-K38A (Fig. 4A–D). Upon oligomycin treatment, most cells maintained the membrane potential and only a small number of cells occasionally showed a rapid loss of TMRE fluorescence irrespective of DLP1-K38A expression (Supplementary Fig. 2). These results indicate that DLP1-K38A–expressing cells maintain the normal level of the ETC-driven intrinsic membrane potential despite an increased proton leak. Remarkably, however, time-lapse imaging of TMRE fluorescence in DLP1-K38A–expressing cells revealed a large-scale oscillation of the mitochondrial membrane potential in a subpopulation of mitochondria (Fig. 4E). A rapid loss of TMRE fluorescence was followed by a slower restoration of the fluorescence in the same mitochondria (Supplementary Video 1). Under the same imaging conditions, control cells showed no TMRE oscillation (Supplementary Video 1). The DLP1-K38A–induced TMRE “flickering” repeats once and often more during the 1,000-second imaging period (Fig. 4F). Frequencies and intervals of the TMRE oscillation in different cells were random among DLP1-K38A–expressing cells (Fig. 4F). Interestingly, the abrupt depolarization was accompanied by the hyperpolarization in the remaining mitochondria in the cell (Fig. 4G). The reverse activity of the ATP synthase is not involved in the recovery of TMRE fluorescence because the oscillation continues in the presence of oligomycin (Supplementary Video 2). We speculate that those mitochondria showing the TMRE flickering in DLP1-K38A cells are connected due to the inhibited mitochondrial fission. These observations demonstrated that an increased mitochondrial uncoupling found in DLP1-K38A cells is the functional manifestation of this large-scale flickering of the TMRE fluorescence.
FIG. 4.

Inhibition of mitochondrial fission induces the large-scale fluctuation of the inner membrane potential. The mitochondrial inner membrane potential was evaluated with TMRE fluorescence. A–D: The TMRE fluorescence intensity showed no overall difference in control and DLP1-K38A-expressing cells. C: Cells expressing DLP1-K38A appeared to have larger cell-to-cell variations, however. D: FCCP treatment dissipated the TMRE fluorescence. Error bars are SEM. E–G: Time-lapse imaging shows TMRE fluorescence in hepatocytes expressing DLP1-K38A. E: Time sequence images show repeated loss and recovery of TMRE fluorescence, and the arrowheads denote depolarized mitochondria at given time points, which regain the membrane potential afterward. F: Quantification of TMRE fluorescence intensity (FI) in five different oscillating mitochondria shows a rapid decrease and slower restoration of the membrane potential. The frequency and interval of the oscillation are random. G: Fluorescence quantification shows that a decrease (gray line) of TMRE fluorescence during the oscillation is accompanied by hyperpolarization (black line) of remaining adjacent mitochondria.
The rapid loss of the mitochondrial membrane potential in DLP1-K38A cells is reminiscent of the opening of the permeability transition (PT) pore. However, the conventional cyclosporin A–sensitive PT pore was not involved in this process (Supplementary Video 3). TMRE oscillation has been observed in other cell types, including COS-7 and cardiomyocytes, and was shown to be sensitive to the anion transport inhibitor 4-diisothiocyano-2,2-disulfonic acid stilbene (DIDS), the benzodiazepine antagonist 4-chlorodiazepam, and the superoxide scavenger manganese(III) tetrakis(1-methyl-4-pyridyl)porphyrin (MnTMPyP) (28–30). However, none of these agents blocked the TMRE flickering in DLP1-K38A cells (Supplementary Video 3), suggesting that the DLP1-K38A–induced TMRE flickering is a unique phenomenon that may not involve ion channels or protein pores. We observed the DLP1-K38A–induced TMRE flickering in multiple cell lines, including HeLa and the cardiac myoblast cell line H9c2, indicating that the TMRE flickering is a general phenomenon promoted by perturbed fission. Our data demonstrate that the inhibition of mitochondrial fission by DLP1-K38A induces a large-scale fluctuation of the mitochondrial inner membrane potential, which is functionally reflected in mitochondrial uncoupling.
Controlling mitochondrial fission as a novel strategy to ameliorate oxidative stress resulting from increased ROS production.
When the electron transport is backed up within the ETC, electron slippage increases and ROS are overproduced. Under these conditions, uncoupling/proton leak allows the ETC to run more freely, which decreases the electron slippage and thus reduces ROS production. Our current data demonstrate that DLP1-K38A expression increases mitochondrial proton leak. This mechanistic information suggests that manipulating mitochondrial fission, thereby uncoupling, can be used as a novel antioxidant strategy to ameliorate oxidative damage from mitochondrial ROS overproduction. We hypothesized that sufficiently weak inhibition of mitochondrial fission would induce mild uncoupling without compromising mitochondrial functionality and relieve the ROS-induced oxidative stress caused by excess substrate oxidation. Indeed, shorter periods of DLP1-K38A expression induced a small but consistent increase of proton leak without decreasing the ATP production, whereas prolonged inhibition of mitochondrial fission that induced TMRE flickering and substantial uncoupling decreased the oligomycin-sensitive ATP production (Fig. 5A–C). In chemical uncoupling, a titration of FCCP concentrations revealed that mild uncoupling did not affect mitochondrial ATP–producing capacity (Fig. 5D and E). We and others have shown that FCCP-induced chemical uncoupling decreases ROS production in hyperglycemic insult (22,31). These observations support the hypothesis that inducing the mild proton leak does not adversely affect mitochondrial function and can rather be beneficial in pathologic conditions by decreasing mitochondrial ROS production.
FIG. 5.

Mild mitochondrial uncoupling has no adverse effect on mitochondrial ATP production. A: Hepatocytes expressing DLP1-K38A for 24 h had a higher OCR than control cells upon oligomycin treatment, indicating an increased proton leak. B: The calculated leak ratio showed a statistically significant increase of the proton leak upon 24-h DLP1-K38A expression compared with the control (n = 8; *P < 0.05). C: Oligomycin-sensitive ATP levels (60-min oligomycin treatment) indicated little effect of 24-h DLP1-K38A expression on mitochondrial ATP-producing capacity, whereas 48-h DLP1-K38A expression significantly decreased the ATP production from mitochondria (n = 9; *P < 0.01). Error bars are SEM. D: Oxygen consumption was measured in the presence of oligomycin with increasing concentrations of FCCP. OCR measurements indicated that FCCP concentrations at 100–200 nmol/L induce a mild uncoupling, resulting in small increases of the OCR. FCCP concentrations higher than 1 μmol/L cause maximum uncoupling and thus the maximum OCR. n = 6. E: Cellular ATP contents were measured in the presence and absence of 30-min treatment of oligomycin (Olm). Oligomycin-sensitive ATP content (ATP produced from mitochondria) did not decrease in 100 nmol/L FCCP that induced a mild uncoupling. Higher concentrations of FCCP (1–2 μmol/L) decreased mitochondrial ATP production, which was compensated by increases of glycolytic ATP generation. Total cellular ATP contents diminished drastically with 5–10 μmol/L FCCP (n = 6). Error bars are SEM.
A new transgenic mouse model of mitochondrial fission expressing DLP1-K38A.
To test the validity of our hypothesis, we generated a transgenic mouse model expressing DLP1-K38A. Because the permanent loss of mitochondrial fission by the DLP1 knockout results in embryonic lethality (4,5), DLP1-K38A was expressed through an inducible system using rtTA and TRE (Fig. 6A). The transgenic line carrying TRE-DLP1-K38A was crossed with a line carrying rtTA2s-M2 under the ROSA26 promoter (32,33) to generate the double transgenic mice dTg[rtTA/K38A] (Fig. 6A and B). In these mice, DLP1-K38A is expressed upon introducing Dox to the animal. When a set of primers specifically annealing to the mutated nucleotide sequence of DLP1-K38A was used, RT-PCR detected DLP1-K38A expression only after feeding mice with Dox (Fig. 6C). After 2 days of Dox feeding, we found the Dox-dependent transgene expression in kidney, liver, small intestine, and heart (Fig. 6C). Although the ROSA26 promoter is known to confer the ubiquitous tissue expression, the transgene was barely expressed in skeletal muscle and brain (cerebellum and cortex). Immunohistochemistry for DLP1 and GFP revealed an increased fluorescence in the kidney, intestine, and liver (Fig. 6D; Supplementary Fig. 3A and B). DLP1-K38A expression was also observed after 7 days of Dox feeding, indicating persistent transgene expression under Dox induction (Supplementary Fig. 3C). The expression level of the DLP1-K38A by the Dox induction was modest, as judged from RT-PCR data. Accordingly, a continuous Dox feeding up to 6 months showed little effect on the appearance and behavior of the dTg[rtTA/K38A], suggesting no apparent detrimental effect from this level of DLP1-K38A expression. Further analyses in these mice showed no systemic effect of transgene expression based on the similar values of the plasma lipid profile, liver panel, and oxidative stress assessments in control and dTg[rtTA/K38A] mice (Supplementary Fig. 4).
FIG. 6.

New transgenic mouse model expresses DLP1-K38A. A: The double transgenic mice dTg[rtTA/K38A] were generated by crossing Tg[R26rtTA] and Tg[DLP1-K38A]. DLP1-K38A and EGFP are cis-regulated by TRE and trans-regulated by the Dox-dependent transcription factor rtTA2s-M2 that is under the control of the ROSA26 promoter. B: Transgene genotyping of a litter showing double transgenic mice carrying both DLP1-K38A and rtTA (arrowheads). C: Dox-dependent expression of DLP1-K38A in dTg[rtTA/K38A]. RT-PCR of tissues from 2-day Dox-fed mice shows the DLP1-K38A expression in kidney (Kd), liver (Lv), small intestine (Int), and heart (H). Little expression was detected in muscle (Msc) or in brain cerebellum (Cb) and cortex (Crt). D: Immunohistochemistry on the Dox-fed dTg[rtTA/K38A] kidney section shows increased levels of DLP1 and GFP. Scale bar: 25 μm. E: OCR analyses of hepatocytes from chow and Dox-fed dTg[rtTA/K38A]. Transgene expression was induced 4–5 days, and OCR was measured 2 h after hepatocyte isolation. Olm, oligomycin. F: The leak ratio indicates a statistically significant increase of proton leak in Dox-fed dTg[rtTA/K38A] (n = 15 for Dox-fed; n = 11 for normal chow-fed mice). Error bars represent SEM. *P < 0.01. (A high-quality digital representation of this figure is available in the online issue.)
We next tested whether DLP1-K38A expression in dTg[rtTA/K38A] increases the mitochondrial inner membrane proton leak. Respiration analyses of hepatocytes from Dox-fed dTg[rtTA/K38A] mice showed a small but statistically significant increase of proton leak compared with the control mice (Fig. 6F), indicating that mild uncoupling was induced in these mice. No TMRE flickering was observed with this mild uncoupling. Dox administration alone had no effect on respiration (Supplementary Fig. 5). Interestingly, however, isolated mitochondria from Dox-fed dTg[rtTA/K38A] mice showed no difference in coupling efficiency compared with the control mice (Supplementary Fig. 6), indicating that the mitochondrial uncoupling effect of DLP1-K38A is brought about only within a cellular context.
Expression of DLP1-K38A in mice relieves oxidative stress in a hyperglycemic model.
Because mild uncoupling was observed in Dox-fed dTg[rtTA/K38A] mice, we examined the effect of hyperglycemia. Hyperglycemic conditions increase metabolic input into mitochondria and overwhelm the ETC, resulting in electron backup and ROS overproduction, which is a causal factor for oxidative stress and diabetes complications (20,22,34). STZ was used to induce hyperglycemia in mice. Hyperglycemia was developed within 2 days after the STZ treatment in control and dTg[rtTA/K38A] mice. Dox feeding began 2 days before STZ injection to ensure transgene expression during hyperglycemic development. We verified the expression of DLP1-K38A at 3 weeks after STZ in dTg[rtTA/K38A] mice, indicating that hyperglycemia did not affect transgene expression (Supplementary Fig. 7). Body weight decreased steadily for 4–5 days and then stabilized in both groups, with mice losing ∼15% of their original body mass during the course of the study. In many instances, control mice injected with STZ developed a health-compromised phenotype within a week, exhibiting sedentary behavior, hunched posture, and rough fur. However, dTg[rtTA/K38A] mice maintained a normal, healthy phenotype, with sleek fur and active behavior (Supplementary Video 4).
Renal complications are one of the most prevalent consequences of diabetic conditions. Electron photomicrographs from STZ-injected mice showed that mitochondria in the proximal tubular cells of diabetic kidney appeared round and elliptic, whereas those in nondiabetic kidney were more elongated, indicating that morphologic change of mitochondria occurred in hyperglycemia (Fig. 7A and B). In contrast, mitochondria in Dox-fed diabetic dTg[rtTA/K38A] mice displayed an elongated morphology similar to those in nondiabetic control mice (Fig. 7C). Shape analyses of these mitochondria revealed a round and swollen mitochondrial phenotype in diabetic kidney (Fig. 7D and E). However, kidney mitochondria from hyperglycemic dTg[rtTA/K38A] mice had a smaller minimal axis and a larger AR value than the diabetic or control mice, representing their elongated appearance (Fig. 7D and E). These mitochondrial morphologies suggest that mitochondria under diabetic conditions underwent fission and/or swelling, and the expression of DLP1-K38A in dTg[rtTA/K38A] mice reduced those events.
FIG. 7.

Electron photomicrographs of kidney proximal tubules show mitochondria in nondiabetic (non-db) mice are elongated (A), whereas those in STZ-induced diabetic (db) kidney are round and appear to be swollen (B). C: Mitochondria in diabetic mice expressing DLP1-K38A (db + DLP1-K38A) are elongated, similar to those in non-db kidney. MV, microvilli; BS, basal stripes. D: Measurement of the minimal axis of the kidney mitochondria indicated a swollen phenotype. The mean value of the minimal diameter of the mitochondria in diabetic animal (STZ) was much higher than in the control, demonstrating the swollen mitochondrial morphology. Mitochondria from hyperglycemic dTg[rtTA/K38A] mice had a smaller minimal axis than the diabetic or control mice. The mean values of the minimal axis length of dTg[rtTA/K38A] mitochondria were decreased by 58% (P = 5.3 × 10⁻¹⁵) compared with those of diabetic mitochondria (n = 50). E: A calculation of the AR showed the roundness of mitochondrial shape in diabetic kidney proximal tubules. Mitochondria from hyperglycemic dTg[rtTA/K38A] mice had the larger AR value than the diabetic or control mice, representing their elongated shape. The mean values of the AR of dTg[rtTA/K38A] mitochondria were increased by 50% compared with those of control mitochondria (n = 50).
Hyperglycemia causes the ROS overproduction from mitochondria, and we hypothesized that the increased proton leak induced by DLP1-K38A expression would decrease ROS production. We therefore examined the level of ROS in diabetic control and dTg[rtTA/K38A] mice. Ethidium fluorescence from the ROS-mediated oxidation of DHE was low in nondiabetic mice, whereas diabetic mice showed significantly high ROS levels in kidney and liver (Fig. 8A and B). Remarkably, we found low ROS levels in Dox-fed diabetic dTg[rtTA/K38A] mice that were comparable to those in nondiabetic mice (Fig. 8A and B). These results strongly support our notion that a low-level expression of DLP1-K38A can decrease the ROS levels in hyperglycemia without causing a detrimental effect. No significant variations were observed in the level of the antioxidant enzymes Mn superoxide dismutase (SOD) and catalase in STZ-induced hyperglycemia (Supplementary Fig. 8). Because Dox-fed dTg[rtTA/K38A] mice showed low ROS levels, we examined whether the extent of oxidative damage was reduced in these mice. Levels of protein carbonylation as well as nitrotyrosine and 4-hydroxynonenal modifications were increased in the diabetic mice. We found that Dox-fed dTg[rtTA/K38A] mice showed a significant reduction in these markers of oxidative stress (Fig. 8C–E). These data demonstrated that the DLP1-K38A expression in diabetic conditions attenuates the oxidative damage by decreasing the ROS level. In addition, hyperglycemia induced a loss of renal function in control mice, as indicated by an increase in the blood urea nitrogen (BUN)–to–creatinine ratio, whereas a significantly lower ratio was found with Dox-fed dTg[rtTA/K38A] mice (Fig. 8F). These results demonstrate that inducing mild proton leak/uncoupling by genetically manipulating mitochondrial fission in mice relieves oxidative stress and prevents organ dysfunction in diabetic conditions.
FIG. 8.

DLP1-K38A expression in mice relieves the diabetic oxidative stress. A and B: ROS evaluation in kidney and liver. Ethidium fluorescence shows increased ROS levels in STZ-treated diabetic kidney (A) and liver (B), and the lower levels of ROS in Dox-fed dTg[rtTA/K38A]. Scale bar: 50 μm. Error bars are SEM (n = 5, 10, and 7 for no STZ, STZ, and STZ/DLP1-K38A, respectively). P < 0.05. C–E: Assessments of oxidative stress in diabetic conditions. STZ-induced hyperglycemia increases protein carbonylation (C), 4-hydroxynonenal (4-HNE) (D), and nitrotyrosine (E) modifications in kidney. Dox-fed dTg[rtTA/K38A] diabetic mice show reduced levels of protein carbonylation (n = 8 for each group; *P < 0.01), 4-HNE (n = 4, 6, and 4 for no STZ, STZ, and STZ+DLP1-K38A, respectively; *P < 0.05), and nitrotyrosine (n = 4, 6, and 4 for no STZ, STZ, and STZ+DLP1-K38A, respectively; *P < 0.05) modifications. F: The serum BUN-to-creatinine ratio was increased in STZ-injected control mice but remained low in Dox-fed dTg[rtTA/K38A] mice (n = 12, 8, and 9 for no STZ, STZ, and STZ+DLP1-K38A, respectively). *P < 0.05. Error bars are SEM. (A high-quality digital representation of this figure is available in the online issue.)
DISCUSSION
Constant change of mitochondrial shape is mediated by fission and fusion that consume cellular energy, suggesting a profound role of mitochondrial dynamics. Indeed, knocking out DLP1, Mfn, or OPA1 in mice causes embryonic lethality (2–5), indicating their essential role. Previous studies with cell lines indicated that mitochondria become dysfunctional upon knockout or knockdown of fusion or fission proteins (35,36). However, the mechanisms linking mitochondrial shape and functionality are not fully understood. Using primary hepatocytes, we found an increase of inner membrane proton leak when mitochondrial fission was inhibited. We were able to visualize this increased proton leak in DLP1-K38A cells as a repeated occurrence of rapid loss and recovery of TMRE fluorescence.
What causes the large-scale mitochondrial depolarization and recovery remains to be investigated. Abrupt depolarization events normally occur in individual mitochondria, presumably by transient opening of the PT pore (37,38). This transient PT would be a necessary event to alleviate hyperpolarization and Ca2+ overload. In normal cells, transient PT would have a negligible effect on overall cellular mitochondrial function because of its localized nature restricted within short isolated mitochondria. When mitochondria become interconnected by fission inhibition, however, the transient PT may spread to all connected mitochondria, greatly amplifying the inner membrane leakage. However, the conventional cyclosporine A–sensitive PT does not appear to be a factor in the DLP1-K38A–induced TMRE flickering. An unconventional PT or a yet-unknown leak mechanism may possibly be involved in the fission inhibition-induced proton leak. One interesting observation is that the loss of TMRE fluorescence in a subpopulation of mitochondria is accompanied by hyperpolarization of the remaining mitochondria (Fig. 4G). Previous observation indicated that, during mitochondrial fission, TMRE fluorescence increases in one of the daughter mitochondria while the other is depolarized (39). Although the mechanism of this asymmetric membrane potential distribution in the dividing mitochondria is unknown, this phenomenon raises a possibility that the DLP1-K38A–induced TMRE flickering may involve the actual fission process. Possibly, residual fission events in DLP1-K38A–expressing cells cause depolarization and hyperpolarization by the act of fission, which is greatly exaggerated by the interconnected mitochondria due to decreased fission. Regardless of the mechanisms of the proton leak in DLP1-K38A–expressing cells, interconnection of mitochondria upon fission inhibition could be an important factor, potentially amplifying local proton leak through the formation of large continuous mitochondria.
The new transgenic mouse model expressing DLP1-K38A will be a useful tool for studying the pathophysiological role of mitochondrial fission. Previous efforts to generate DLP1-knockout mice resulted in embryonic lethality, and thus, no live DLP1-null mice are available. Although the level of transgene expression is limited in dTg[K38A/rtTA] upon Dox induction, we found that the transgene induction aborts the mouse pregnancy, indicating the embryonic lethality similar to DLP1-knockout mice. This suggests that the modest expression of DLP1-K38A decreases the DLP1 function enough to interfere with the embryonic development. Indeed, the low level of transgene expression was sufficient to affect mitochondrial morphology and to decrease ROS levels in hyperglycemic insult (Figs. 7 and 8). Additional tissue-specific transgenic mice for DLP1-K38A will help identify the physiological role of mitochondrial fission.
The ETC of mitochondria is one of the main sources of cellular ROS. ROS overproduction from mitochondria is a causal factor in many pathological conditions. In metabolic diseases such as diabetes and nonalcoholic fatty liver disease, excess fuel oxidation through mitochondria induces mitochondrial hyperpolarization and ROS overproduction (19–22,40,41). In addition, mitochondrial ROS production is linked to oxidative stress associated with aging, neurodegeneration, and excess alcohol consumption (42–46). In these pathologies, normalizing the ROS level would be critical for ameliorating cell and tissue injury. Our current study demonstrated that inhibiting mitochondrial fission increases mitochondrial uncoupling. This finding indicates that controlling mitochondrial fission can modulate the inner membrane proton leak and thus ROS levels. Accordingly, using transgenic mice expressing DLP1-K38A, we were able to normalize ROS levels and oxidative stress in the mouse model of hyperglycemia, providing experimental evidence for a potential benefit of targeting mitochondrial fission for diabetes complications and other diseases associated with oxidative stress. Similar to the concept of fission inhibition-induced mild uncoupling, uncoupling proteins and chemical uncoupler were shown to have a beneficial effect in animals fed a high-fat diet (47,48). Although potentially beneficial, the mitochondrial fission–based approach would require more extensive investigation considering that mitochondrial fission is an essential cellular process participating in quality control and functional maintenance of mitochondria. Spatially and temporally controlled modulation of mitochondrial fission would be necessary given that long-term sustained perturbation of mitochondrial fission would potentially be detrimental to cell and organ function.
Supplementary Material
ACKNOWLEDGMENTS
This study was supported by National Institutes of Health Grants DK-078618 and DK-061991 to Y.Y. and by DE-015654 and CA-106308 to W.H.
No potential conflicts of interest relevant to this article were reported.
C.A.G., H.L., and Y.Y. designed the study, performed experiments, analyzed the data, and wrote, reviewed, and edited the manuscript. S.N. conducted mouse husbandry and genotyping. B.S.J. performed experiments and analyzed the data. T.Y. performed the initial mouse experiments. W.H. developed and provided the R26rtTA transgenic mouse line. Y.Y. is the guarantor of this work and, as such, had full access to all the data in the study and takes responsibility for the integrity of the data and the accuracy of the data analysis.
The authors are grateful to Lin Gan, Linda Callahan, and Karen Bentley (University of Rochester Medical Center) for technical support and thank Jennifer Gewandter (University of Rochester Medical Center) for initiating the transgenic mouse project.
Footnotes
This article contains Supplementary Data online at http://diabetes.diabetesjournals.org/lookup/suppl/doi:10.2337/db11-1640/-/DC1.
See accompanying commentary, p. 1915.
B.S.J. is currently affiliated with the Center for Translational Medicine, Department of Medicine, Jefferson Medical College, Thomas Jefferson University, Philadelphia, Pennsylvania.
T.Y. is currently affiliated with Alfaisal University College of Medicine, Riyadh, Kingdom of Saudi Arabia.
REFERENCES
- 1.Okamoto K, Shaw JM. Mitochondrial morphology and dynamics in yeast and multicellular eukaryotes. Annu Rev Genet 2005;39:503–536 [DOI] [PubMed] [Google Scholar]
- 2.Chen H, Detmer SA, Ewald AJ, Griffin EE, Fraser SE, Chan DC. Mitofusins Mfn1 and Mfn2 coordinately regulate mitochondrial fusion and are essential for embryonic development. J Cell Biol 2003;160:189–200 [DOI] [PMC free article] [PubMed] [Google Scholar]
- 3.Davies VJ, Hollins AJ, Piechota MJ, et al. Opa1 deficiency in a mouse model of autosomal dominant optic atrophy impairs mitochondrial morphology, optic nerve structure and visual function. Hum Mol Genet 2007;16:1307–1318 [DOI] [PubMed] [Google Scholar]
- 4.Ishihara N, Nomura M, Jofuku A, et al. Mitochondrial fission factor Drp1 is essential for embryonic development and synapse formation in mice. Nat Cell Biol 2009;11:958–966 [DOI] [PubMed] [Google Scholar]
- 5.Wakabayashi J, Zhang Z, Wakabayashi N, et al. The dynamin-related GTPase Drp1 is required for embryonic and brain development in mice. J Cell Biol 2009;186:805–816 [DOI] [PMC free article] [PubMed] [Google Scholar]
- 6.Delettre C, Lenaers G, Griffoin JM, et al. Nuclear gene OPA1, encoding a mitochondrial dynamin-related protein, is mutated in dominant optic atrophy. Nat Genet 2000;26:207–210 [DOI] [PubMed] [Google Scholar]
- 7.Alexander C, Votruba M, Pesch UE, et al. OPA1, encoding a dynamin-related GTPase, is mutated in autosomal dominant optic atrophy linked to chromosome 3q28. Nat Genet 2000;26:211–215 [DOI] [PubMed] [Google Scholar]
- 8.Züchner S, Mersiyanova IV, Muglia M, et al. Mutations in the mitochondrial GTPase mitofusin 2 cause Charcot-Marie-Tooth neuropathy type 2A. Nat Genet 2004;36:449–451 [DOI] [PubMed] [Google Scholar]
- 9.Niemann A, Ruegg M, La Padula V, Schenone A, Suter U. Ganglioside-induced differentiation associated protein 1 is a regulator of the mitochondrial network: new implications for Charcot-Marie-Tooth disease. J Cell Biol 2005;170:1067–1078 [DOI] [PMC free article] [PubMed] [Google Scholar]
- 10.Waterham HR, Koster J, van Roermund CW, Mooyer PA, Wanders RJ, Leonard JV. A lethal defect of mitochondrial and peroxisomal fission. N Engl J Med 2007;356:1736–1741 [DOI] [PubMed] [Google Scholar]
- 11.Su B, Wang X, Zheng L, Perry G, Smith MA, Zhu X. Abnormal mitochondrial dynamics and neurodegenerative diseases. Biochim Biophys Acta 2010;1802:135–142 [DOI] [PMC free article] [PubMed] [Google Scholar]
- 12.Kanzaki Y, Terasaki F, Okabe M, et al. Giant mitochondria in the myocardium of a patient with mitochondrial cardiomyopathy: transmission and 3-dimensional scanning electron microscopy. Circulation 2010;121:831–832 [DOI] [PubMed] [Google Scholar]
- 13.Sanyal AJ, Campbell-Sargent C, Mirshahi F, et al. Nonalcoholic steatohepatitis: association of insulin resistance and mitochondrial abnormalities. Gastroenterology 2001;120:1183–1192 [DOI] [PubMed] [Google Scholar]
- 14.Schaper J, Froede R, Hein S, et al. Impairment of the myocardial ultrastructure and changes of the cytoskeleton in dilated cardiomyopathy. Circulation 1991;83:504–514 [DOI] [PubMed] [Google Scholar]
- 15.Calabrese V, Scapagnini G, Giuffrida Stella AM, Bates TE, Clark JB. Mitochondrial involvement in brain function and dysfunction: relevance to aging, neurodegenerative disorders and longevity. Neurochem Res 2001;26:739–764 [DOI] [PubMed] [Google Scholar]
- 16.Sato A, Nakada K, Hayashi J. Mitochondrial dynamics and aging: mitochondrial interaction preventing individuals from expression of respiratory deficiency caused by mutant mtDNA. Biochim Biophys Acta 2006;1763:473–481 [DOI] [PubMed] [Google Scholar]
- 17.Deng S, Vatamaniuk M, Huang X, et al. Structural and functional abnormalities in the islets isolated from type 2 diabetic subjects. Diabetes 2004;53:624–632 [DOI] [PubMed] [Google Scholar]
- 18.Dröge W. Free radicals in the physiological control of cell function. Physiol Rev 2002;82:47–95 [DOI] [PubMed] [Google Scholar]
- 19.Baynes JW, Thorpe SR. Role of oxidative stress in diabetic complications: a new perspective on an old paradigm. Diabetes 1999;48:1–9 [DOI] [PubMed] [Google Scholar]
- 20.Brownlee M. Biochemistry and molecular cell biology of diabetic complications. Nature 2001;414:813–820 [DOI] [PubMed] [Google Scholar]
- 21.Green K, Brand MD, Murphy MP. Prevention of mitochondrial oxidative damage as a therapeutic strategy in diabetes. Diabetes 2004;53(Suppl. 1):S110–S118 [DOI] [PubMed] [Google Scholar]
- 22.Nishikawa T, Edelstein D, Du XL, et al. Normalizing mitochondrial superoxide production blocks three pathways of hyperglycaemic damage. Nature 2000;404:787–790 [DOI] [PubMed] [Google Scholar]
- 23.Koopman WJ, Verkaart S, Visch HJ, et al. Inhibition of complex I of the electron transport chain causes O2-. -mediated mitochondrial outgrowth. Am J Physiol Cell Physiol 2005;288:C1440–C1450 [DOI] [PubMed] [Google Scholar]
- 24.Yu T, Sheu SS, Robotham JL, Yoon Y. Mitochondrial fission mediates high glucose-induced cell death through elevated production of reactive oxygen species. Cardiovasc Res 2008;79:341–351 [DOI] [PMC free article] [PubMed] [Google Scholar]
- 25.Yoon Y, Pitts KR, McNiven MA. Mammalian dynamin-like protein DLP1 tubulates membranes. Mol Biol Cell 2001;12:2894–2905 [DOI] [PMC free article] [PubMed] [Google Scholar]
- 26.Pitts KR, Yoon Y, Krueger EW, McNiven MA. The dynamin-like protein DLP1 is essential for normal distribution and morphology of the endoplasmic reticulum and mitochondria in mammalian cells. Mol Biol Cell 1999;10:4403–4417 [DOI] [PMC free article] [PubMed] [Google Scholar]
- 27.Smirnova E, Griparic L, Shurland DL, van der Bliek AM. Dynamin-related protein Drp1 is required for mitochondrial division in mammalian cells. Mol Biol Cell 2001;12:2245–2256 [DOI] [PMC free article] [PubMed] [Google Scholar]
- 28.De Giorgi F, Lartigue L, Ichas F. Electrical coupling and plasticity of the mitochondrial network. Cell Calcium 2000;28:365–370 [DOI] [PubMed] [Google Scholar]
- 29.Aon MA, Cortassa S, Marbán E, O’Rourke B. Synchronized whole cell oscillations in mitochondrial metabolism triggered by a local release of reactive oxygen species in cardiac myocytes. J Biol Chem 2003;278:44735–44744 [DOI] [PubMed] [Google Scholar]
- 30.Aon MA, Cortassa S, Akar FG, O'Rourke B Mitochondrial criticality: a new concept at the turning point of life or death. Biochim Biophys Acta 2006;1762:232–240 [DOI] [PMC free article] [PubMed] [Google Scholar]
- 31.Yu T, Robotham JL, Yoon Y. Increased production of reactive oxygen species in hyperglycemic conditions requires dynamic change of mitochondrial morphology. Proc Natl Acad Sci USA 2006;103:2653–2658 [DOI] [PMC free article] [PubMed] [Google Scholar]
- 32.Urlinger S, Baron U, Thellmann M, Hasan MT, Bujard H, Hillen W. Exploring the sequence space for tetracycline-dependent transcriptional activators: novel mutations yield expanded range and sensitivity. Proc Natl Acad Sci USA 2000;97:7963–7968 [DOI] [PMC free article] [PubMed] [Google Scholar]
- 33.Yu HM, Liu B, Chiu SY, Costantini F, Hsu W. Development of a unique system for spatiotemporal and lineage-specific gene expression in mice. Proc Natl Acad Sci USA 2005;102:8615–8620 [DOI] [PMC free article] [PubMed] [Google Scholar]
- 34.Russell JW, Golovoy D, Vincent AM, et al. High glucose-induced oxidative stress and mitochondrial dysfunction in neurons. FASEB J 2002;16:1738–1748 [DOI] [PubMed] [Google Scholar]
- 35.Chen H, Chomyn A, Chan DC. Disruption of fusion results in mitochondrial heterogeneity and dysfunction. J Biol Chem 2005;280:26185–26192 [DOI] [PubMed] [Google Scholar]
- 36.Parone PA, Da Cruz S, Tondera D, et al. Preventing mitochondrial fission impairs mitochondrial function and leads to loss of mitochondrial DNA. PLoS ONE 2008;3:e3257. [DOI] [PMC free article] [PubMed] [Google Scholar]
- 37.Ichas F, Jouaville LS, Mazat JP. Mitochondria are excitable organelles capable of generating and conveying electrical and calcium signals. Cell 1997;89:1145–1153 [DOI] [PubMed] [Google Scholar]
- 38.Hüser J, Blatter LA. Fluctuations in mitochondrial membrane potential caused by repetitive gating of the permeability transition pore. Biochem J 1999;343:311–317 [PMC free article] [PubMed] [Google Scholar]
- 39.Twig G, Elorza A, Molina AJ, et al. Fission and selective fusion govern mitochondrial segregation and elimination by autophagy. EMBO J 2008;27:433–446 [DOI] [PMC free article] [PubMed] [Google Scholar]
- 40.Nakamura S, Takamura T, Matsuzawa-Nagata N, et al. Palmitate induces insulin resistance in H4IIEC3 hepatocytes through reactive oxygen species produced by mitochondria. J Biol Chem 2009;284:14809–14818 [DOI] [PMC free article] [PubMed] [Google Scholar]
- 41.Schönfeld P, Wojtczak L. Fatty acids as modulators of the cellular production of reactive oxygen species. Free Radic Biol Med 2008;45:231–241 [DOI] [PubMed] [Google Scholar]
- 42.Schriner SE, Linford NJ, Martin GM, et al. Extension of murine life span by overexpression of catalase targeted to mitochondria. Science 2005;308:1909–1911 [DOI] [PubMed] [Google Scholar]
- 43.Schon EA, Manfredi G. Neuronal degeneration and mitochondrial dysfunction. J Clin Invest 2003;111:303–312 [DOI] [PMC free article] [PubMed] [Google Scholar]
- 44.DiMauro S, Schon EA. Mitochondrial disorders in the nervous system. Annu Rev Neurosci 2008;31:91–123 [DOI] [PubMed] [Google Scholar]
- 45.Hoek JB, Cahill A, Pastorino JG. Alcohol and mitochondria: a dysfunctional relationship. Gastroenterology 2002;122:2049–2063 [DOI] [PMC free article] [PubMed] [Google Scholar]
- 46.Kurose I, Higuchi H, Kato S, et al. Oxidative stress on mitochondria and cell membrane of cultured rat hepatocytes and perfused liver exposed to ethanol. Gastroenterology 1997;112:1331–1343 [DOI] [PubMed] [Google Scholar]
- 47.Choi CS, Fillmore JJ, Kim JK, et al. Overexpression of uncoupling protein 3 in skeletal muscle protects against fat-induced insulin resistance. J Clin Invest 2007;117:1995–2003 [DOI] [PMC free article] [PubMed] [Google Scholar]
- 48.Samuel VT, Liu ZX, Qu X, et al. Mechanism of hepatic insulin resistance in non-alcoholic fatty liver disease. J Biol Chem 2004;279:32345–32353 [DOI] [PubMed] [Google Scholar]
Associated Data
This section collects any data citations, data availability statements, or supplementary materials included in this article.