

Summary
Seizure susceptibility to neurological insults, including chemical convulsants, is age-dependent and most likely reflective of overall differences in brain excitability. The molecular and cellular mechanisms underlying development-dependent seizure susceptibility remain to be fully understood. Because the mTOR pathway regulates neurite outgrowth, synaptic plasticity and cell survival, thereby influencing brain development, we tested if exposure of the immature brain to the mTOR inhibitor rapamycin changes seizure susceptibility to neurological insults. We found that inhibition of mTOR by rapamycin in immature rats (3 to 4 weeks old) increases the severity of seizures induced by pilocarpine, including lengthening the total seizure duration and reducing the latency to the onset of seizures. Rapamycin also reduces the minimal dose of pentylenetetrazol (PTZ) necessary to induce clonic seizures. However, in mature rats, rapamycin does not significantly change the seizure sensitivity to pilocarpine and PTZ. Likewise, kainate sensitivity was not significantly affected by rapamycin treatment in either mature or immature rats. Additionally, rapamycin treatment down-regulates the expression of potassium-chloride cotransporter 2 (KCC2) in the thalamus and to a lesser degree in the hippocampus. Pharmacological inhibition of thalamic mTOR or KCC2 increases susceptibility to pilocarpine-induced seizure in immature rats. Thus, our study suggests a role for the mTOR pathway in age-dependent seizure susceptibility.
Keywords: mTOR, epilepsy, development, rapamycin, seizure, KCC2
Introduction
The mammalian target of rapamycin (mTOR) is a member of the phosphatidylinositol kinase-related kinase family (Sarbassov et al., 2005). In the CNS, the mTOR pathway is regulated by glutamate receptor activation (Huang et al., 2007; Lenz and Avruch, 2005) and modulates neurite outgrowth (Kumar et al., 2005; Tavazoie et al., 2005), synaptic plasticity (Tang et al., 2002) and cell survival (Dawson et al., 1993), presumably by influencing protein translation or Akt activity (Burnett et al., 1998; Jaworski et al., 2005). The role of the mTOR pathway in epilepsy has recently been intensively interrogated (Wong, 2010). Hyperactivation of mTOR causes widespread benign tumors and mental retardation, along with a high incidence of epilepsy in tuberous sclerosis complex (TSC) patients (Crino et al., 2006; Holmes and Stafstrom, 2007; Thiele, 2010). Pharmacological inhibition of the mTOR pathway successfully attenuates structural abnormalities and reduces seizures in TSC (Meikle et al., 2008; Zeng et al., 2008), cortical dysplasia (Ljungberg et al., 2009), and phosphatase and tensin homolog (PTEN) (Sunnen et al., 2011; Zhou et al., 2009) mouse models of epilepsy. Additionally, rapamycin has been shown to attenuate infantile spasm (Raffo et al., 2011) and to prevent pathological changes in the hippocampus (Buckmaster et al., 2009; Zeng et al., 2009; Huang et al., 2010) and spontaneous recurrent seizures in adult acquired epilepsy models (Zeng et al., 2009; Huang et al., 2010), although not in the mouse pilocarpine model (Buckmaster and Lew, 2011). Moreover, a recent clinical study revealed that inhibition of mTOR by everolimus markedly reduces the volume of subependymal giant-cell astrocytomas and seizure frequency in TSC patients (Krueger et al., 2010). Thus, the mTOR pathway has been increasingly viewed as a favorable therapeutic target against seizures associated with genetic defects such as TSC (Crino, 2008) and perhaps in acquired epilepsy following neurological insults (McDaniel and Wong, 2011).
Despite the positive outcomes from rapamycin treatment in TSC/PTEN genetic animal models and to some extent in acquired epilepsy models, it remains essentially unknown if there are any negative effects from chronic exposure to rapamycin in the developing brain. Given that the mTOR pathway is involved in brain development by regulating neurite outgrowth and synaptic plasticity, the immature brain, which undergoes extensive growth of neurons and modification of neuronal circuitries, could be especially sensitive to mTOR inhibition. The present experiments were undertaken to examine if rapamycin influences seizure susceptibility to convulsants in the immature rat.
Materials and methods
Animals
Immature (50–75 g or 3–4 weeks old) and mature (200–300 g or 8–10 weeks old) male Sprague-Dawley rats were purchased from Taconic (Taconic, Hudson, NY). Animals were housed with ad libitum access to food and water in an animal facility with temperature control and a 12 hr light-dark cycle (lights on 0700). All experiments were performed according to the guidelines set by the Animal Care and Use Committee as well as the National Institutes of Health guide for care and use of laboratory animals. Efforts were made to minimize suffering and unnecessary use of animals. Rats used in all experiments were 3 to 4 weeks old unless otherwise indicated.
Drug treatment
Rapamycin (Tecoland, Edison, NJ) was first dissolved in DMSO and further diluted in a vehicle solution containing 5% tween-20 and 4% ethanol. Rats were pretreated with rapamycin at 5 mg/kg/day i.p. for one to three consecutive days prior to the induction of seizures by administration of pilocarpine (255–300 mg/kg, i.p.), kainate (10–20 mg/kg, i.p.) or PTZ (35–60 mg/kg, i.p.). For the most experiments, animals were treated with pilocarpine at 255 mg/kg or rapamycin at 5 mg/kg unless otherwise indicated. Pilocarpine administration was performed as previously described (Huang et al., 2002). Briefly, rats were injected with methylscopolamine and terbutaline (2 mg/kg each i.p. in 0.9% NaCl) 15–30 min prior to pilocarpine (255–300 mg/kg, i.p.) to minimize peripheral side effects. Seizures were terminated with sodium pentobarbital (25 mg/kg, i.p.) 60 min after administration of pilocarpine. For the experiment determining the seizure threshold to PTZ, rats were first injected with PTZ at 25 mg/kg i.p., followed by repeated administration of 5 mg/kg at 5-min intervals until a bilateral forelimb clonic jerk was induced as described (Bough et al., 2006). All compounds were purchased from Sigma-Aldrich (St. Louis, MO) except where indicated otherwise.
Seizure monitoring
Behavioral seizure activity was continuously recorded by a digital video recorder surveillance system (Advanced Security Inc, Chino Hills, CA) for 60 min immediately following injection of pilocarpine or kainate. Videos were then examined by trained researchers. Total seizure duration was defined as the total time each rat experienced clonic seizures, including both brief episodic seizures typically lasting less than a minute and status epilepticus (SE). Seizure activities were graded according to Racine’s standard classification (Racine, 1972): stage 1, behavioral arrest with mouth and facial movement; stage 2: head nodding; stage 3: forelimb clonus; stage 4: rearing; and stage 5: rearing and falling. In the present study only stage 3–5 seizures were counted as they are most easily distinguished from typical rat behavior using video surveillance. An individual behavioral seizure event was defined as continuous seizure activity without full recovery to a Racine scale value of less than 3 for more than 10 sec. The highest seizure scale found in each behavioral seizure episode was recorded. The average seizure scale for individual animals was calculated by averaging all seizure scales that occurred during 60 min of recording; animals which did not develop seizures at a scale greater than 3 were counted as 0. The average seizure scales in each group were then calculated.
Seizure activity was also monitored by electroencephalography (EEG) using an 8206 EEG/EMG data conditioning and acquisition system following the manufacturer’s instructions (Pinnacle Technology Inc., Lawrence, KS). Briefly, rats at p18–19 were sedated with pentobarbital at 25 mg/kg (i.p.) and anesthetized by inhalation of isoflurane, and placed in a stereotaxic frame. EEG electrodes used for the epidural cortical recording were stainless-steel 1/8″ screws (Pinnacle Technology Inc.) threaded into holes drilled through locations on the skull following the stereotaxic coordinates (AP +2 mm; ML +2 mm) using bregma as the reference. The reference electrode was placed at (AP −5 mm; ML −2 mm). The ground was placed in the skull (AP −5; ML +2). Note: AP + stands for anterior and AP− for posterior relative to bregma. ML+ stands for lateral to the right and ML− to the left relative to the midline. Rats were allowed 5 days for recovery and then treated with either rapamycin at 5 mg/kg (i.p.) or vehicle daily for three days. On the fourth day posttreatment, rats were treated with either pilocarpine at 255 mg/kg (i.p.) or kaniate at 20 mg/kg (i.p.). Electrographic seizures were recorded for 1.5 hr and manually identified as characteristic spikes and waves of high-frequency and high-amplitude (twice the base level) rhythmic activity persisting for more than 15 sec. SE was defined as continuous seizure activity that lasted over 15 min without full recovery of amplitude to the basal level more than 10 sec. Seizures that started near the end of the 1.5 hr recording and lasted for more than 10 min were also counted as SE. Total seizure duration was defined as total time that each rat spent in electrographic seizures, including episodic seizures and SE. Because prolonged seizures can significantly increase mortality, we monitored seizure activity for 1.5 hr, which is long enough to allow SE to occur while minimizing mortality. One rat in the rapamycin-treated group died from a severe seizure during the course of recording and was excluded from the study.
Tissue isolation and western blot analysis
Rats (50–75g or 3–4 weeks old) were treated with either vehicle or rapamycin (5 mg/kg/day, i.p.) for three days prior to being sacrificed. Rat brains were placed into a stainless steel matrix and sectioned coronally into 3-mm thick slices by inserting four razor blades at 4, 7, 10, and 13 mm from the anterior-most point of the cortex. Regions of interest (ROI) were identified as described in the monograph A Stereotaxic Atlas of the Developing Rat Brain by Nancy M. Sherwood, and then excised using a 2-mm hole punch. Isolated tissues were subjected to western blot analysis as described (Huang et al., 2010). Briefly, tissues were homogenized in lysis buffer consisting of 50 mM Tris, pH 7.4, 2 mM EDTA and a proteinase inhibitor set (Roche, San Francisco, CA), followed by mixing with an equal volume of 2X LDS sample buffer comprised of 20% β-mercaptoethanol and heated at 95°C for 5 min. The resulting protein samples were resolved in an 8% Bis-Tris gel in MES buffer and then transferred onto a 0.45 μm nitrocellulose membrane. The membranes were first blocked in 5% nonfat dry milk in TBST (25 mM Tris-HCl, pH 7.4; 1.5 M NaCl; 0.05% Tween-20) for 1 hr at room temperature (RT) and then incubated with primary antibodies at 1:1000–2000 dilution at 4°C overnight. Antibodies were purchased as indicated below: rabbit anti-s6, p-s6, mouse anti-GAPDH (Cell Signaling, Danvers, MA), rabbit anti-M1 and M3 antibodies, rabbit anti-GABA α1 and 3 rabbit anti-KCC2, rabbit anti-NKCC1 (Millipore, Billerica, MA), rabbit anti-NMDA 2B (Abcam, Cambridge, MA) and mouse anti-GluR2 (Zymed, San Francisco, CA). After removal of primary antibodies by washing 3 times with TBST, membranes were incubated with HRP-conjugated secondary antibody (1:10,000 dilution for rabbit antibody; 1:3000 for mouse antibody) in 5% milk in TBST for 1 hr at RT and then washed in TBST 3 times followed by a final wash in TBS. The signals were visualized with ECL reagent (Pierce, Rockford, IL).
Immunocytochemistry
Rats (3–4 weeks old) were divided into four groups: a control group receiving sham injections: a rapamycin group receiving 3 days of i.p. rapamycin at 5 mg/kg; a pilocarpine group receiving 255 mg/kg of pilocarpine; and a rapamycin and pilocarpine group receiving 3 days of i.p. rapamycin at 5 mg/kg followed by i.p. pilocarpine at 255 mg/kg on the fourth day. Ninety minutes after pilocarpine treatment, seizures were terminated with pentobarbital. Two hours after seizure termination, rats were anesthetized using isoflurane and transcardially perfused, first with PBS followed by 4% paraformaldehyde. Whole brains were then removed and placed into 4% paraformaldehyde at 4°C for an additional 24 hrs. Fixed brains were cryoprotected by 30% sucrose solution for 72 hrs until the brains were completely submerged in the sucrose. Brain tissues were sliced into 40-μm coronal sections and stored in PBS containing sodium azide at 4°C. For staining, brain slices were rinsed in PBS for 5 min, followed by a 20-min incubation in 1% H2O2 at RT and then additionally rinsed in PBS. Blocking was performed using 10% NGS and 0.4% Triton X-100 in PBS for 60 min at RT with shaking. Primary antibody incubation was performed with anti-c-fos (1:10,000; Calbiochem, Gibbstown, NJ) in blocking solution overnight at 4°C. c-fos staining was visualized using a Vectastain Elite (Vectors Laboratories, Burlingame, CA) peroxidase staining kit according to the manufacturer’s recommendations. Images were taken using a Zeiss LSM 510 META-NLO laser scanning confocal microscope equipped with a 25× water-immersion lens. Staining was quantified using Image J software. Briefly, each light micrograph was color inverted, and the mean intensity of c-fos staining was measured by selecting a ROI which was encompassed entirely by the cell to be measured. To adjust for variations in background staining, the background intensity was analyzed for each image by measuring the intensity of five regions which contained no distinct staining. Cells that had an intensity of c-fos staining exceeding 2 times the average background were counted as positive. The number of positive cells in the cortex, the thalamus, the entire pyramidal layer in CA1 and CA3, and the entire granule layer in the dentate gyrus was calculated from each image. Only cells which were readily identified as an individual cell with distinct morphology were counted. We acknowledge these criteria may exclude some positively stained cells. A minimum of 3 slices, identified by anatomical structures to be from comparable brain regions, were analyzed and averaged for each animal prior to statistical analysis.
Cannulation
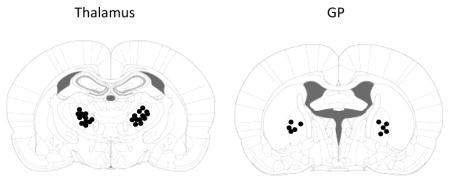
Rats (3–4 weeks old) underwent bilateral cannulation. Briefly, rats were first anesthetized using sodium pentobarbital (25 mg/kg, i.p.) supplemented with inhalation of isoflurane, and placed into a stereotaxic chamber. Guide cannulae were placed into the following locations using bregma as the reference: ventral anterior/ventral lateral (VA/VL) nuclei of the thalamus (AP −1.7 mm, ML 2.2 mm and DV −4.2 mm), GP (AP −0.1 mm, ML 2.9 mm and DV −5.0 mm), according to A Stereotaxic Atlas of the Developing Rat Brain by Nancy M. Sherwood. Note: AP + stands for anterior and AP− for posterior relative to bregma. ML+ stands for lateral to the right and ML− to the left relative to the midline. DV stands for doros-ventral line and “−” stands for the distance below the dura. Cannulae were secured using dental acrylic cements (Harvard Apparatus) and stainless steel miniature screws (1/8″ length by 0.06″ thread flat screws; J. I. Morris Company). Rats were allowed to recover from surgery for 24 hr before drug infusion. This short time of recovery was used to prevent shifting of the cannula position as the young rat brains grow. After experiments were completed, 1 μl of India ink was injected into the cannula and the location was confirmed by slicing brains into 100-μm coronal sections and noting the location of the ink. Dots represent the center of the injection site where the cannula tips were located. Any animal in which a cannula was not in the correct position was excluded from the data analysis.
Drug microinjection
Injection cannulae were connected to Hamilton syringes by fine-bore Portex® polyethylene tubing (Smiths). Injection cannulae extended 1 mm past the guide cannula into the region of interest. Either 1 μl of drug or vehicle was delivered bilaterally at a rate of 0.1–0.2 μl/min. After infusion, the injection cannulae were left in place to allow residual drug access to the region of interest. Rapamycin was administered twice per day for three days, with one injection directly to the region of interest and one supplemental injection into the cannula allowing for free exchange of rapamycin in the cannula with the region of interest. Systemic pilocarpine was administered as previously described on the fourth day. Rapamycin was dissolved to 5 mg/ml in 2% DMSO and injected in a volume of 1 μl. Furosemide was dissolved to 40 mg/ml in NaOH and adjusted to pH 7.4 using HCl, and delivered in a volume of 1 μl. Fifteen minutes after the furosemide injections, systemic pilocarpine was delivered as previously described.
Statistical analysis
T-tests were used for the analysis of seizure duration, average scale, number of stage 4 and 5 seizures following administration of pilocarpine and kainic acid and minimal PTZ dose for behavioral seizures. Data of total duration of seizures, duration of SE, and latency to onset of SE gathered from EEG were also analyzed with t-tests. c-fos cell counts were analyzed by performing ANOVA followed by a Tukey post hoc adjustment. Quantifications of western blots were compared using t-tests. Statistical tests were performed using GraphPad Prism (GraphPad Software, Inc., La Jolla, CA).
Results
Rapamycin decreases the seizure threshold to pilocarpine in immature rats
Rats 3–4 weeks old were pretreated with either rapamycin at 5 mg/kg or vehicle for three days, a dosing regimen sufficient to suppress mTOR activity (Huang et al., 2010). In the present study, we chose to test rapamycin in 3- to 4-week-old immature rats because behavioral seizures are readily identifiable and their severity can be quantified using the Racine scale. Rats were treated with pilocarpine via i.p. at 300 mg/kg. Seizure activity was monitored by video recording, graded based on the Racine scale, and presented as total seizure duration, average seizure scale, and number of seizure episodes at stage 4 and 5. We found that rats that had been treated with rapamycin developed severe seizures (Figure 1A–C) and had a higher mortality rate than controls (Figure 1L). To exclude a possible ceiling effect from a high dose of pilocarpine, a lower dose of pilocarpine at 255 mg/kg was used. While the low dose induced very mild seizures in control rats, it triggered much more severe seizures in the rapamycin-treated group (Figure 1D–F). We also tested rats with a single dose of rapamycin (5 mg/kg i.p.) given 16 hr prior to pilocarpine. We found that seizure activity was slightly increased, but the difference was not statistically significant when compared with the vehicle-treated control (Figure 1M–O), suggesting that altered seizure susceptibility to pilocarpine involves a chronic process. Of particular note, we quantified behavioral seizures only at levels 3–5 of the Racine scale because seizures at levels 1–2 are subtle and therefore hard to quantify. In order to discern the effect of rapamycin on the full spectrum of seizure activity, we performed EEG recording. The electrographic seizures were quantified as total seizure duration, duration of SE, and latency to the onset of seizures. Rats that had been treated with rapamycin developed very severe electrographic seizures to pilocarpine at 255 mg/kg, with much earlier onset of seizures and longer durations of total seizures and SE (Figure G–K). Notably, episodic seizures typically lasted 30–50 sec whereas SE lasted at least 15 min and was the predominant form of seizures induced by pilocarpine. Therefore, the total seizure duration (Figure 1I) and total duration of SE (Figure 1J) were very close. Nevertheless, the EEG data correlate very well with the behavioral seizures. Taken together, we concluded that rapamycin increases seizure susceptibility to pilocarpine in immature rats.
Figure 1.

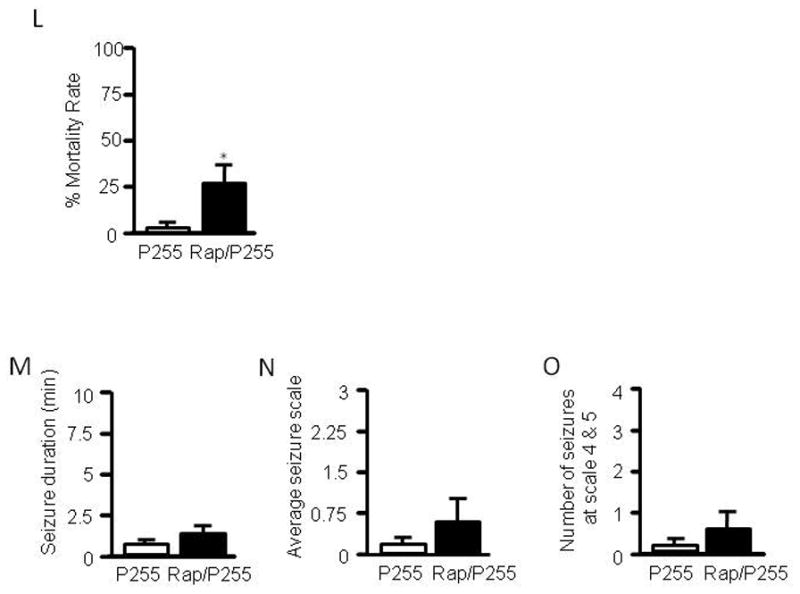
Rapamycin increases seizure susceptibility to pilocarpine in immature rats. Immature rats were treated with rapamycin (labeled as Rap) or vehicle for 3 days prior to induction of seizures by pilocarpine at 300 mg/kg (labeled as P300) (A–C) or 255 mg/kg (labeled as P255) (D–F). Behavioral seizures induced by pilocarpine at 300 mg/kg are presented as average seizure duration (min) (pilocarpine: 3.87 ± 0.94 vs rapamycin/pilocarpine: 7.05 ± 1.10) (A), average seizure scale (pilocarpine: 2.36 ± 0.30 vs rapamycin/pilocarpine: 3.25 ± 1.81) (B), and average number of stage 4 and 5 seizures (pilocarpine: 2.33 ± 0.97 vs rapamycin/pilocarpine: 5.44 ± 1.08) (C). Behavioral seizures induced by pilocarpine at 255 mg/kg are presented as average seizure duration (min) (pilocarpine: 0.04 ± 0.02 vs rapamycin/pilocarpine: 7.98 ± 1.53) (D), average seizure scale (pilocarpine: 0.18 ± 0.10 vs rapamycin/pilocarpine: 2.07 ± 0.26) (E), and average number of stage 4 and 5 seizures (pilocarpine: 0 ± 0 vs rapamycin/pilocarpine: 2.67 ± 0.76) (F). (mean ± SEM; n=10–12; *<0.05; t-test). Typical electrographic seizures recorded from cortex in immature rats that were treated with pilocarpine at 255 mg/kg (G) or rapamycin plus pilocarpine at 255 mg/kg (H). Quantification of electrographic seizures presented as total seizure duration (min) (pilocarpine: 20.9 ± 9.4 vs rapamycin/pilocarpine: 52.7 ± 6.0) (I), average of total SE duration (min) (pilocarpine: 18.0 ± 8.5 vs rapamycin/pilocarpine: 50.2 ± 5.0) (J), and latency to onset of seizures (min) (pilocarpine: 38.6 ± 9.3 vs rapamycin/pilocarpine: 13.9 ± 2.8) (K). (mean ± SEM; n=7–8; *<0.05; t-test). Pilocapine elicited higher mortality in the rapamycin-treated group (L). Rats (3–4 weeks old) were treated with 5 mg/kg rapamycin or vehicle for 3 days prior to induction of SE by pilocarpine at 255 mg/kg. Seizures were terminated with sodium pentobarbital (25 mg/kg, i.p.) 60 min after pilocarpine administration. Mortality rates (%) were calculated within 16 hr after pilocarpine treatment (pilocarpine: 0.1563 ± 0.0146 vs. rapamycin/pilocarpine: 23.7798 ± 3.8091). (mean ± SEM; n=49–50; t-test, * indicates p<0.05, ** indicates p<0.01). Single dose of rapamycin does not significantly change seizure susceptibility to pilocarpine in immature rats (M–O). Immature rats were treated with 5 mg/kg rapamycin or vehicle 1 day (16 hr) prior to induction of seizures by pilocarpine at 255 mg/kg. Behavioral seizures induced by pilocarpine are presented as average seizure duration (min) (pilocarpine: 0.9600 ± 0.1815 vs rapamycin/pilocarpine: 1.3783 ± 0.4588) (A), average seizure scale (pilocarpine: 0.35 ± 0.0825 vs rapamycin/pilocarpine: 0.94 ± 0.3365) (B) and average number of stage 4 and 5 seizures (pilocarpine: 0.33 ± 0.1925 vs. rapamycin/pilocarpine: 0.500 ± 0.2041) (mean ± SEM; n=6; t-test).
Rapamycin reduces the seizure threshold to PTZ
We also measured the seizure threshold to PTZ, a GABAA receptor antagonist. Immature rats were first treated with rapamycin 5 mg/kg or vehicle for three days followed by i.p. injections of PTZ with an initial dose at 25 mg/kg followed by multiple injections at 5 mg/kg at 5-min intervals until a clonic seizure was induced. We found that rapamycin reduced the minimal PTZ dose needed to induce clonic seizures in immature rats (Figure 2).
Figure 2.
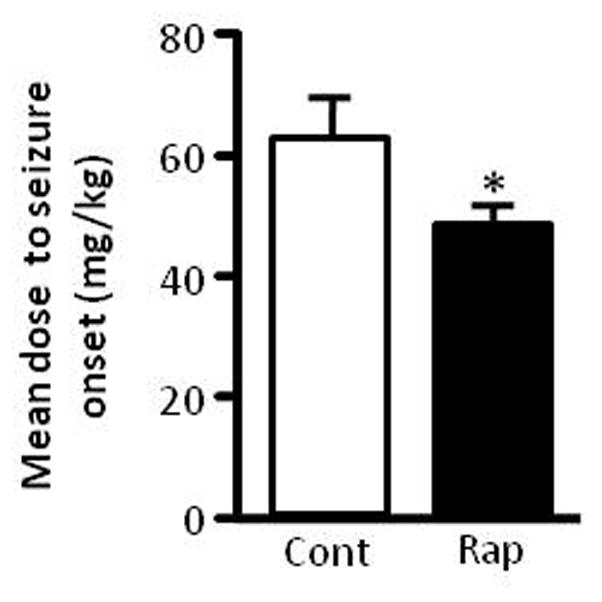
Rapamycin reduces seizure threshold to PTZ. Immature rats were treated with rapamycin or vehicle for three days followed by PTZ. Data are presented as average minimal PTZ doses (mg/kg) (Control: 61.5 ± 6.63 vs rapamycin 48 ± 2.13). (mean ± SEM; n=10; *p < 0.05; t-test).
Rapamycin does not significantly change seizure susceptibility to kainate in immature rats
We next examined if rapamycin alters sensitivity to another convulsant, kainate, a glutamate receptor agonist. We first tested kainate at 10 mg/kg, representing a low dose which may help to reveal rapamycin’s effect. We did not see a significant increase in overall seizure activity in the rapamycin group (Figure 3A–C). We were concerned that kainate at 10 mg/kg may be too low to elicit severe behavioral seizures, which could mask the effects of rapamycin. We therefore treated rats with kainate at 20 mg/kg and used EEG to record electrographic seizures. We observed that rats in both the control and rapamycin-treated groups developed episodic seizures, with only a few rats developing SE (Figure 3D–E). EEG quantification reveals that there is no significant difference in total duration of seizures, duration of SE, and latency to onset of seizures between the two groups (Figure 3F–H). We observed more episodic seizures and less SE in the kainate model than in the pilocarpine model. This may explain why the total seizure duration (Figure 3F) is significantly longer than the total duration of SE (Figure 3G). However, total duration of SE still constitutes a significant portion of the total duration of seizures.
Figure 3.
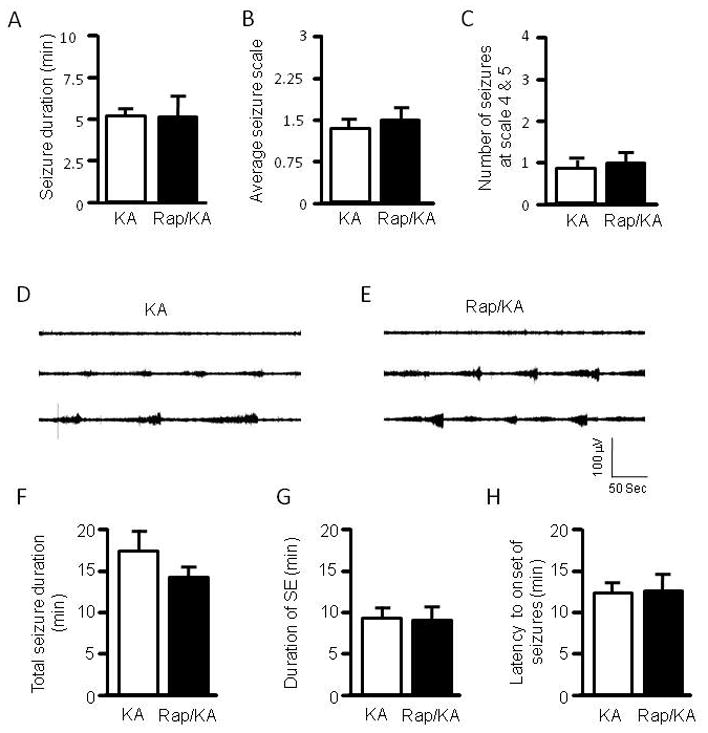
Rapamycin does not change seizure susceptibility to kainate. Rats were treated with vehicle or rapamycin for three days prior to induction of seizures by kainate (labeled as KA and Rap/KA, respectively) at 10 mg/kg (A–C). Behavioral seizures are presented as average seizure duration (min) (kainate: 5.26 ± 0.51 vs rapamycin/kainate: 5.13 ± 1.48) (A), average seizure scale (kainate: 1.39 ± 0.21 vs rapamycin/kainate: 1.46 ± 0.39) (B), and average number of stage 4 and 5 seizures (kainate: 0.88 ± 0.23 vs rapamycin/kainate: 1.0 ± 0.27) (C). (mean ± SEM; n=9–10). Typical electrographic seizures recorded from cortex in immature rats that were treated with kainate at 20 mg/kg (D) or rapamycin plus kainate at 20 mg/kg (E). Quantification of electrographic seizures presented as total seizure duration (min) (kainate: 17.165± 2.098 vs rapamycin/kainate: 14.217 ± 1.502) (F), average of total SE duration (min) (kainate: 8.315 ± 2.177 vs rapamycin/kainate: 8.074 ± 2.446) (G), and latency to onset of seizures (min) (kainate: 13.15 ± 0.998 vs rapamycin/kainate: 13.330 ± 1.717) (H). (mean ± SEM; n=9).
Rapamycin does not significantly increase seizure susceptibility to pilocarpine and PTZ in adult rats
Having found that rapamycin increases seizure susceptibility to pilocarpine and PTZ in immature rats, we asked if this effect is age-dependent. We therefore performed the same experiment in 8-to 10-week-old adult rats. Rats were first treated with rapamycin followed by pilocarpine at 255 mg/kg. We did not see a significant increase in seizure activity in the rapamycin group (Figure 4A–C). To exclude the possibility that the 255 mg/kg dose of pilocarpine we used was too low to induce seizures in adult rats, we also treated rats with pilocarpine at 300 mg/kg. Rats at this higher dose developed much more severe seizures in both the control and rapamycin-treated groups (4D–F) compared to those induced by pilocarpine at 255 mg/kg. Although the rapamycin group showed a slight increase of seizure activity, the difference was not significant when compared with the control group. We also did not find any significant change in the minimal dose of PTZ needed to elicit a clonic seizure (Figure 4G).
Figure 4.
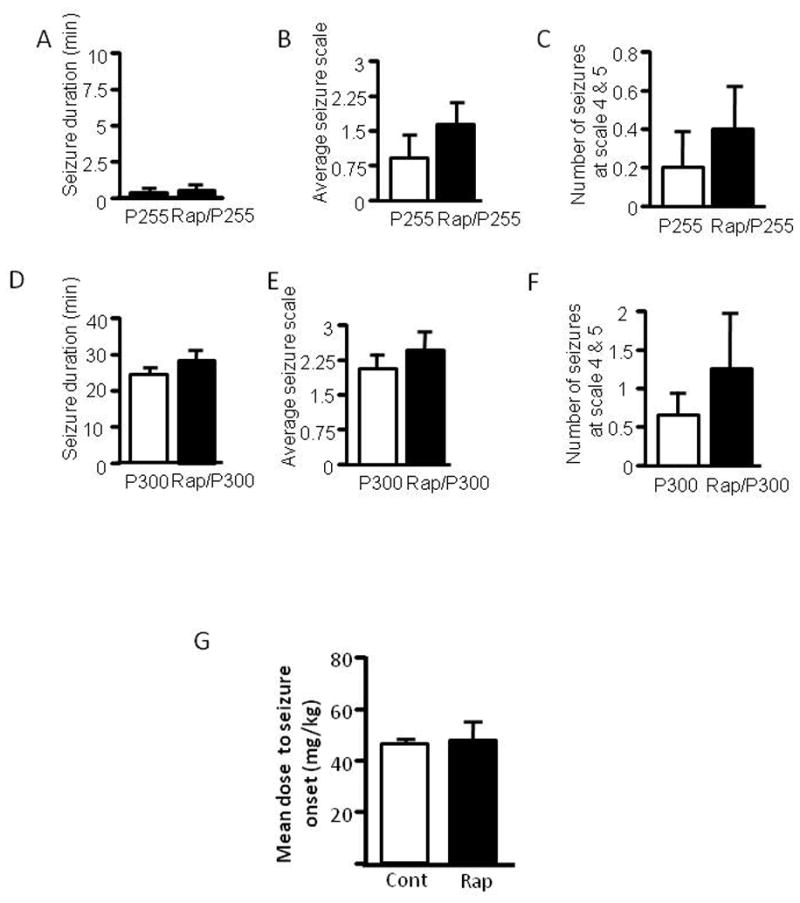
Rapamycin does not change seizure susceptibility to pilocarpine and PTZ in adult rats. Adult rats were treated with rapamycin (labeled as Rap) or vehicle for three days prior to induction of seizures by pilocarpine at 255 mg/kg (labeled as P255) (A–C) or 300 mg/kg (labeled as P300) (D–F). Behavioral seizures induced by pilocarpine at 255mg/kg are presented as average seizure duration (min) (pilocarpine: 0.36 3 ± 0.211vs rapamycin/pilocarpine: 0.507 ± 0.244) (A), average seizure scale (pilocarpine: 0.950 ± 0.477 vs. rapamycin/pilocarpine: 1.65 ± 0.504) (B) and average number of stage 4 and 5 seizures (pilocarpine: 0.200 ± 0.200 vs. rapamycin/pilocarpine: 0.400 ± 0.245) (C). Behavioral seizures induced by pilocarpine at 300 mg/kg are presented as average seizure duration (min) (pilocarpine: 23.18 ± 2.75 vs. rapamycin/pilocarpine: 26.81 ± 6.03) (D), average seizure scale (pilocarpine: 1.87 ± 0.51 vs. rapamycin/pilocarpine: 2.29 ± 0.27) (E) and average number of stage 4 and 5 seizures (pilocarpine: 0.600 ± 0.240 vs. rapamycin/pilocarpine: 1.25 ± 0.63) (F). Adult rats were treated with rapamycin or vehicle for three days followed by PTZ. Data are presented as average minimal PTZ doses (Control: 46 ± 2.92 vs. rapamycin 48 ± 7 mg) (G). (mean ± SEM; n=6–10).
Rapamycin increases c-fos activation evoked by pilocarpine in the hippocampus, cortex and thalamus
Activation of c-fos is generally used as a marker of hyperactivated neurons following seizure activity (Morgan et al., 1987). To further confirm that rapamycin increases seizures induced by pilocarpine in immature rats, we performed c-fos staining in brain slices prepared from control rats and those treated with either rapamycin or pilocarpine individually or both. We found that rapamycin alone had little, if any, effect on c-fos expression in the hippocampus, cortex, or thalamus (Figure 5A–B). Pilocarpine at 255 mg/kg, a dose that elicits very mild seizures (Figure 1D–K), was able to induce mild but significant expression of c-fos in a fair number of neurons in these brain regions when compared to control or rapamycin-treated animals. However, we observed a further increase in c-fos positive neurons in the hippocampus, cortex and thalamus of the group treated with both pilocarpine and rapamycin, which was significantly higher than all other groups (Figure 5A–B). Thus, these data echo the video/EEG recording data and further confirm that rats pretreated with rapamycin developed severe seizures to pilocarpine.
Figure 5.
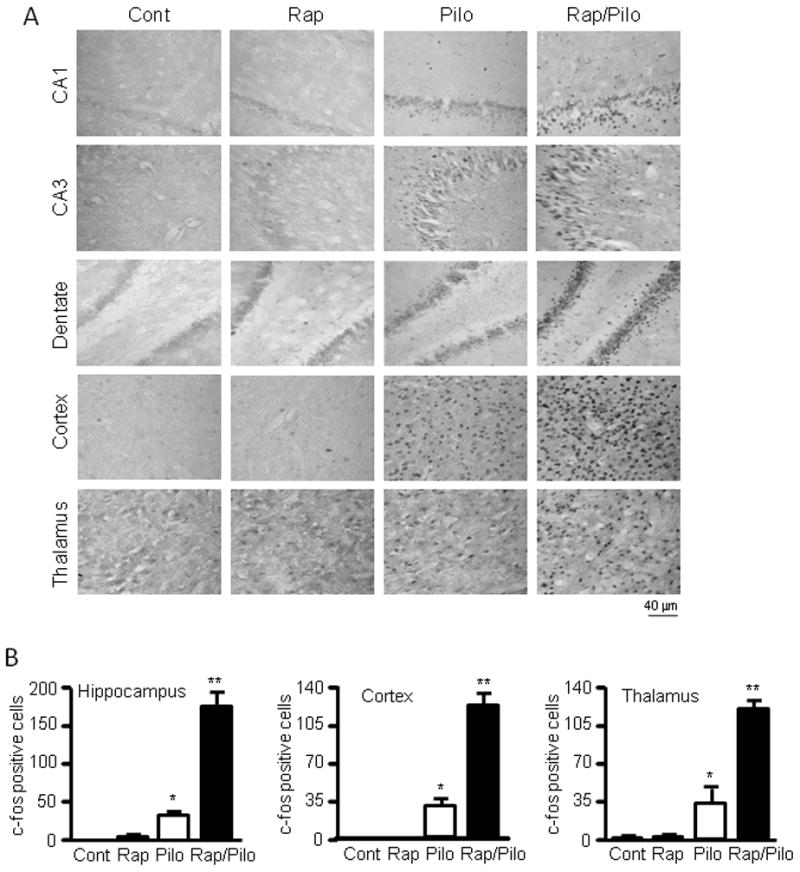
Rapamycin increases c-fos staining in the hippocampus, cortex and thalamus by pilocarpine. (A) Representative images (magnification 25×) of c-fos staining in CA1, CA3, dentate gyrus (DG), cortex and thalamus in immature rats treated with vehicle (Cont) or rapamycin (Rap) with or without pilocarpine (pilo). (B) Quantification of c-fos expression. The number of identifiable individual cells with c-fos positive staining is 0 ± 0 for the control, 0.5 ± 0.5 for rapamycin, 31.8 ± 4.4 for pilocarpine alone, and 173.7 ± 17.8 for both rapamycin and pilocarpine in the hippocampus; 0 ± 0 for the control, 0 ± 0 for rapamycin, 30.5 ± 6.7 for pilocarpine alone, and 124.8 ± 10.1 for both rapamycin and pilocarpine in the cortex; 0.5 ± 0.5 for the control, 1.0 ± 1.0 for rapamycin, 36.0 ± 13.2 for pilocarpine alone, and 118.3 ± 8.4 for both rapamycin and pilocarpine in the thalamus. * indicates significant increase of c-fos expression in the pilocarpine group compared to the control or rapamycin groups (p<0.05) and ** indicates significant difference between the group treated with both rapamycin and pilocarpine versus groups treated with vehicle, rapamycin or pilocarpine (p<0.05). (mean ± SEM; n=5; ANOVA with Tukey post hoc adjustment).
Rapamycin reduces KCC2 expression in the thalamus and hippocampus
The mTOR pathway is known to regulate protein translation (Burnett et al., 1998). Having demonstrated that mTOR inhibition by rapamycin increases seizure susceptibility to PTZ, a GABAA antagonist, we wondered whether rapamycin treatment influences the expression of KCC2 or NKCC1, Cl− transporters that are known to influence GABAergic transmission (Dzhala et al., 2005) (Galanopoulou, 2007) (Rivera et al., 1999). Accordingly, we treated immature rats with rapamycin at 5 mg/kg for three days and harvested brain tissues for western blot analysis of KCC2 and NKCC1 expression. We found that rapamycin treatment significantly reduced KCC2 expression in the thalamus and caused a mild reduction in the hippocampus (Figure 6A–6C), but not in the cortex, substantia nigra (SNR) and globus pallidus/caudate putamen (GP/CP) (Figure 6A, 6D–F). There was no detectable change in NKCC1 expression in control or rapamycin-treated rats (Figure 6G and H). We also asked if rapamycin influences the expression of muscarinic receptors and GABAA receptors because rapamycin-treated rats showed increased seizure susceptibility to pilocarpine and PTZ. Rapamycin treatment caused a small but statistically insignificant change in expression of muscarinic receptors M1 and M3 in the hippocampus, cortex, SNR and thalamus, nor did it alter the expression of GABAA receptors α1 or α3 (Figure 6G, 6I–L). Additionally, rapamycin did not have any noticeable impact on the expression of other neuronal genes, including glutamate receptor NMDA receptor 2B (Figure 6G and 6M) and AMPA receptor GluR2 (Figure 6G and 6N). The level of phosphorylated S6 was reduced in the rapamycin-treated groups, reflecting inhibition of mTOR (Figure 6O). Rapamycin also does not change KCC2 levels in the thalamus, SNR, cortex and hippocampus of mature rats (Figure 6P–S).
Figure 6.

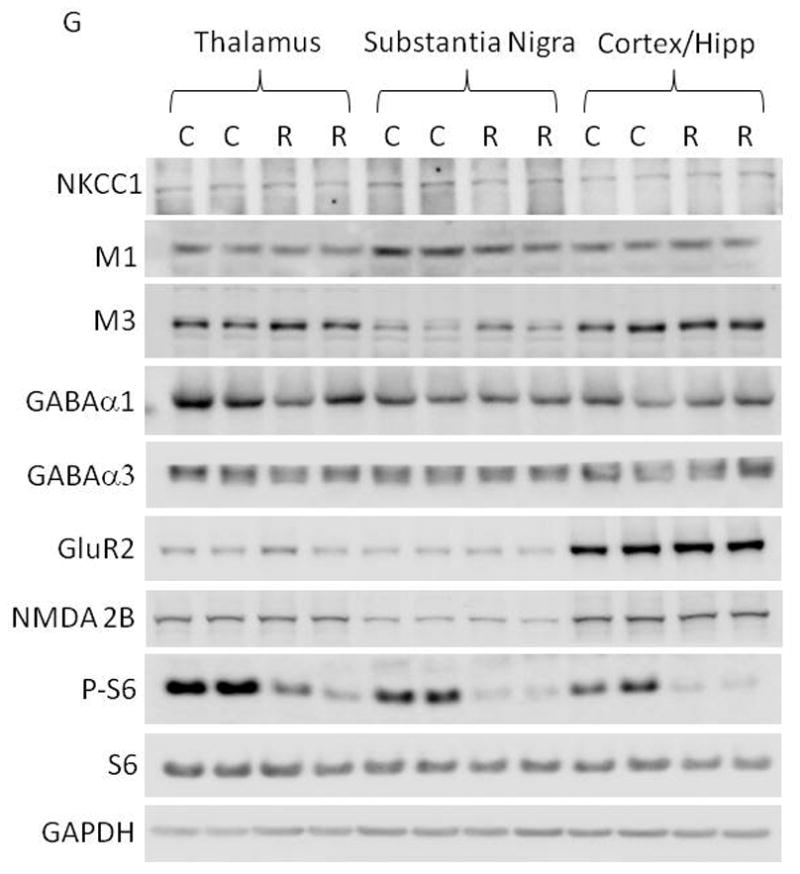
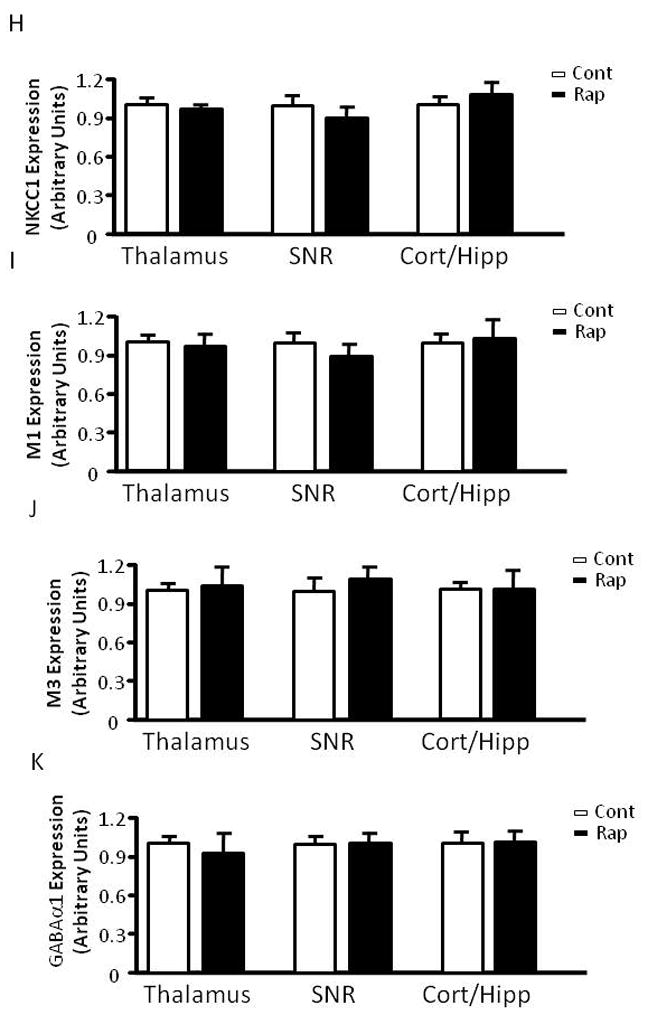
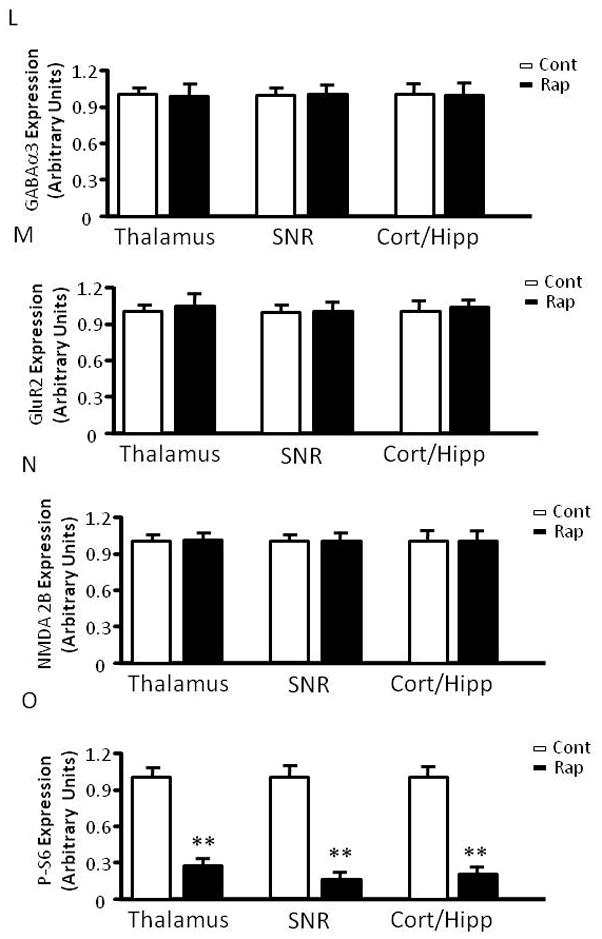

Rapamycin treatment reduces KCC2 levels in the hippocampus and thalamus of immature rats. (A) Immunoblot of KCC2 and GAPDH after vehicle or rapamycin treatment in tissues from the hippocampus (Hip), thalamus, (Thal), cortex (Ctx), SNR and GP/CP. (B–F) Quantification of KCC2 expression in the hippocampus, thalamus, cortex, SNR and GP/CP of control and rapamycin-treated rats (Hip: 1.000 ± 0.04023 vs 0.8560 ± 0.04201; Thal: 1.000 ± 0.04964 vs 0.7506 ± 0.04873; Cortex: 1.000 ± 0.05097 vs 1.021 ± 0.05772; SNR: 1.000 ± 0.04115 vs 1.062 ± 0.1345;GP/CP:1.000 ± 0.1543 vs 1.0858 ± 0.2158). (mean ± SEM; n=10–14; t-test, * indicates p<0.05, ** indicates p<0.01). (G) Immunoblot of NKCC1, S6, phosphorylated S6 (P-S6), M1, M3, GABAα1, GABAα3, GluR2, NMDA2B and GAPDH after 3 days of vehicle (C) or rapamycin treatment (R). Brain tissues were harvested, including thalamus, SNR, hippocampus (Hipp) and cortex. (H–O) Quantification of NKCC1, M1, M3, GABAα1, GABAα3, GluR2, NMDA2B and phosphorylated S6 (P-S6) expression in thalamus, SNR, hippocampus (Hipp) and cortex. (H)NKCC1 expression (Thal:1.000 ± 0.1436 vs. 0.9324 ± 0.1023; SNR: 1.000 ± 0.1523 vs 0.8960 ± 0.2306; Cort/Hipp: 1.000 ± 0.1478 vs 1.1432 ± 0.2480). (I) M1 expression (Thal:1.000 ± 0.1212 vs 0.9422 ± 0.1112; SNR: 1.000 ± 0.1323 vs 0.8882 ± 0.2431; Cort/Hipp: 1.000 ± 0.1231 vs 1.1202 ± 0.3510). (J) M3 expression (Thal:1.000 ± 0.1212 vs 0.9422 ± 0.1112; SNR: 1.000 ± 0.1323 vs 0.8882 ± 0.2431; Cort/Hipp: 1.000 ± 0.1231 vs. 1.1202 ± 0.3510). (K) GABAα1 expression (Thal: 1.000 ± 0.1145 vs 0.8422 ± 0.3203; SNR: 1.000 ± 0.1108 vs 1.0342 ± 0.1486; Cort/Hipp: 1.000 ± 0.2135 vs 1.1076 ± 0.1265). (L) GABAα3 expression (Thal: 1.000 ± 0.1124 vs 0.9812 ± 0.2406; SNR: 1.000 ± 0.1043 vs 1.0302 ± 0.1124; Cort/Hipp: 1.000 ± 0.2123 vs 1.0086 ± 0.2225). (M) GluR2 expression (Thal: 1.000 ± 0.1123 vs 1.2812 ± 0.2516; SNR: 1.000 ± 0.1231 vs 1.0412 ± 0.1143; Cort/Hipp: 1.000 ± 0.2013 vs 1.2014 ± 0.1215). (N) NMDA2B expression (Thal: 1.000 ± 0.1134 vs. 1.1342 ± 0.1506; SNR: 1.000 ± 0.1112 vs 1.0310 ± 0.1087; Cort/Hipp: 1.000 ± 0.2103 vs 1.0214 ± 0.1335). (O) phosphorylated S6 (P-S6) expression. (Thal: 1.000 ± 0.1309 vs 0.2627 ± 0.0328; SNR: 1.000 ± 0.1095 vs 0.1631 ± 0.0043; Cort/Hipp: 1.000 ± 0.1296 vs 0.2031 ± 0.0165). (mean ± SEM; n=10–14; t-test, * indicates p<0.05, ** indicates p<0.01). (P) Rapamycin does not change KCC2 levels in the thalamus, SNR, cortex and hippocampus of mature rats. Immunoblot of KCC2 and GAPDH after vehicle or rapamycin treatment for three days in tissues from the thalamus, SNR, cortex and hippocampus. (Q) Quantification of KCC2 expression in the thalamus, SNR, cortex and hippocampus of control and rapamycin-treated mature rats. (Thalamus: 1.000 ± 0.1147 vs 1.0526 ± 0.0722; SNR: 1.000 ± 0.0768 vs 1.1332 ± 0.0893; Cortex: 1.000 ± 0.0284 vs 0.9025 ± 0.0424; Hippocampus: 1.000 ± 0.0193 vs 1.0842 ± 0.0513). (mean ± SEM; n=10–14).
Thalamic inhibition of mTOR increases seizure activity induced by pilocarpine
VA/VL nuclei of the thalamus are part of the thalamo-cortical re-exciting loop which has been previously shown to be involved in epilepsy (Sabatino et al., 1988). These nuclei receive neuronal inputs from the basal ganglia, including the SNR and GP, and send neuronal outputs to various motor cortices. To determine if thalamic inhibition of mTOR causes increased seizure susceptibility to pilocarpine, we directly delivered rapamycin into the VA/VL of the thalamus. We observed a significant increase in seizure activity induced by pilocarpine at 255 mg/kg in the rapamycin-treated group compared with the vehicle control (Figure 7A–7C). To exclude a possible effect of non-specific diffusion of rapamycin, we also infused rapamycin into the GP, another subcortical region where KCC2 expression was not altered by systemic treatment of rapamycin (Figure 7A–7C). We did not observe any noticeable difference in seizure intensity when compared with the thalamic-vehicle control.
Figure 7.
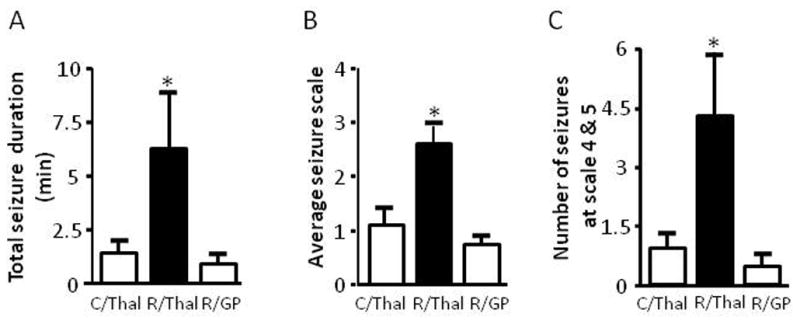
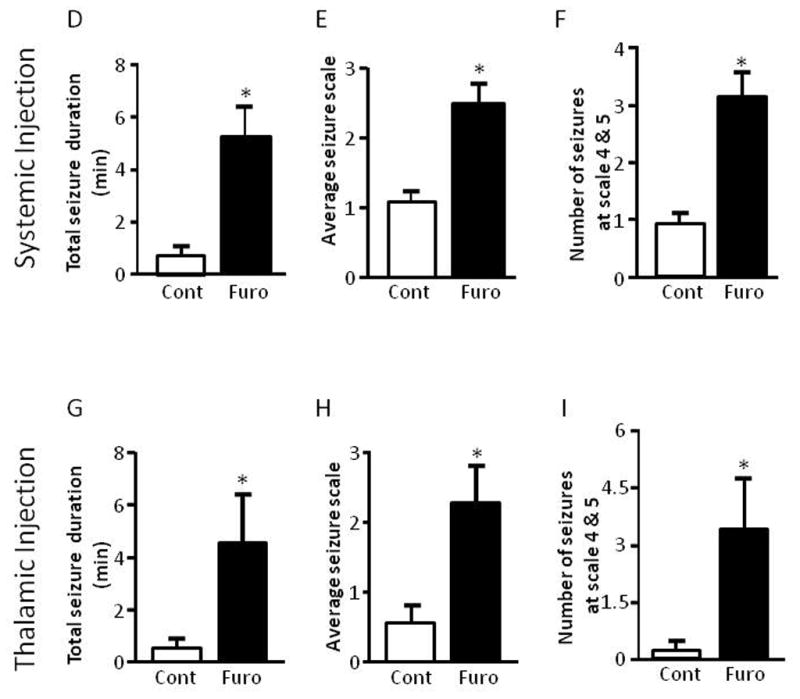
Thalamic inhibition of mTOR or KCC2 increases seizure susceptibility to pilocarpine. (A–C) Rapamycin or vehicle was delivered bilaterally to the thalamus or GP via microinjection twice per day for three days prior to i.p. administration of pilocarpine. Rats that received rapamycin via thalamic injection showed a significant increase in average seizure duration (Veh/thalamus: 1.29 ± 0.59, Rap/thalamus: 7.02 ± 2.74 and Rap/GP 0.82 ± 0.39) (A), average seizure scale (Veh/thalamus: 1.06 ± 0.43, Rap/thalamus: 2.56 ± 0.41 and Rap/GP 0.64 ± 0.27) (B), and average number of stage 4 and 5 seizures (Veh/thalamus: 0.83 ± 0.41, Rap/thalamus: 4.25 ± 1.76 and Rap/GP 0.44 ± 0.29) (C) (ANOVA with Tukey post hoc adjustment; mean ± SEM; * indicates p<0.05; n=8–9). (D–F) Systemic administration of the KCC2 blocker furosemide (40 mg/kg) via i.p. injection 15 min prior to pilocarpine i.p. injection. Rats treated with furosemide showed a significant increase in seizure duration (control: 0.73 ± 0.16 vs furosemide: 5.17 ± 1.17) (D), average seizure scale (control: 1.03 ± 0.16 vs furosemide: 2.48 ± 0.30) (E), and average number of stage 4 and 5 seizures (control: 0.90 ± 0.23 vs furosemide: 3.13 ± 0.40) (F). (G–I) Furosemide or vehicle was delivered bilaterally to the thalamus via microinfusion 15 min prior to i.p. administration of pilocarpine. Rats treated with furosemide locally showed a significant increase in average seizure duration (control: 0.41 ± 0.27 vs furosemide: 4.54 ± 1.84) (G), average seizure scale (control: 0.52 ± 0.30 vs furosemide: 2.25 ± 0.56) (H), and average number of stage 4 and 5 seizures (control: 0.18 ± 0.18 vs furosemide: 3.36 ± 1.36) (I). (mean ± SEM; * indicates p<0.05; t-test; n=6–11).
Furosemide increases seizures evoked by pilocarpine
Rats (3 to 4 weeks old) were treated with the KCC2 inhibitor furosemide at 40 mg/kg 15 min prior to pilocarpine administration. Pilocarpine evoked much more severe seizures in furosemide-treated animals than in vehicle-treated control animals (Figure 7D–F). To minimize unintended effects from systemic treatment, we directly injected furosemide into the thalamus bilaterally 15 min before pilocarpine treatment. Again, rats thus injected with furosemide developed more severe seizures than the control group injected with vehicle (Figure 7G–I).
Discussion
In the present study, we observed that mTOR inhibition by rapamycin markedly increased seizure susceptibility to pilocarpine in 3- to 4-week-old rats, but not in fully mature rats, suggesting a role of the mTOR pathway in age-dependent seizure susceptibility at this late stage of brain development. mTOR inhibition results in increased seizure susceptibility specifically to pilocarpine, but not to kainate. This finding is intriguing, yet hard to interpret. Subcortical structures, including the thalamus and basal ganglia, also play a role in epilepsy. Previous studies have shown that seizures induced by pilocarpine can be blocked by direct activation of GABAA receptors in the SNR by local injection of the GABAA receptor agonist muscimol (McNamara et al., 1984; Turski et al., 1989a), suggesting involvement of the basal ganglia in propagation of seizures evoked by pilocarpine. Interestingly, local activation of N-methyl-D-aspartate (NMDA) receptors in the striatum did not initiate seizures, but rather protected against seizures induced by pilocarpine (Gale, 1992; Turski et al., 1989b). As the thalamus receives excitatory synaptic inputs from the cortex via the cortical-striatal pathway, subcortical structures could conceivably mediate convulsant-dependent seizure susceptibility. Notably, a previous study reported that rapamycin increases excitotoxicity induced by NMDA in primary neuronal cultures (Dawson et al., 1993). However, it is unclear why, in the present study, rapamycin had no significant effect on seizure susceptibility in vivo in the kainate model. The reason for this lack of effect needs to be elucidated in future studies. In the present study, electrographic seizures in the kainate model were monitored by epidural EEG recording. We acknowledge that overall seizure activity in the kainate model could be underestimated because some limbic seizures induced by kainate may go undetected by the epidural EEG technique.
The thalamus is a major subcortical brain structure which forms highly interconnected networks with the cortex via thalamo-cortical circuitry. Apart from its roles in regulating motor activity and sensory processes (McCormick and Bal, 1997), the thalamo-cortical circuitry is also involved in epilepsy (Blumenfeld et al., 2009; Bryant et al., 2009; Schofield et al., 2009; White and Price, 1993). For example, thalamic neurons receive various inhibitory GABAergic synaptic inputs (Schofield et al., 2009). Changes in GABAergic transmission in the thalamus have been shown to be associated with seizures (Bryant et al., 2009; Paz et al., 2007; Schofield et al., 2009). A recent study also reported a role of thalamic Cl− cotransporters in behavioral-electrical uncoupling in immature brains (Glykys et al., 2009). In the present study, we found that rapamycin treatment down-regulates KCC2 expression in the thalamus. Furthermore, direct injection of rapamycin and furosemide into the thalamus resulted in increased seizure susceptibility, suggesting a potential role of the thalamus in susceptibility and propagation of seizures in the brain at a late developmental stage.
KCC2 is a neuronal-specific K-Cl cotransporter which plays an important role in regulating chloride homeostasis in neurons (Blaesse et al., 2009). By Cl− exclusion, it maintains intracellular Cl− concentration below its electrochemical equilibrium potential, thus regulating inhibitory GABA neurotransmission in the brain (Hubner et al., 2001; Rivera et al., 1999; Zhang et al., 1991). KCC2 is also implicated in neuronal maturation (Rivera et al., 1999), neuron migration (Bortone and Polleux, 2009), spine morphogenesis and excitatory synapse formation (Gulyas et al., 2001; Li et al., 2007), and glutamate receptor surface expression (Gauvain et al., 2011). It is generally recognized that the level of KCC2 expression has an inverse relationship with neuronal excitability, as exemplified by the results of studies of both genetic models (Tornberg et al., 2005; Woo et al., 2002) and developing brains (Hubner et al., 2001; Rivera et al., 1999), as well as findings from pathological conditions, including traumatic injury (Bonislawski et al., 2007; Nabekura et al., 2002) and seizures (Barmashenko et al., 2011; Huberfeld et al., 2007; Nardou et al., 2011; Palma et al., 2006; Pathak et al., 2007). Notably, expression of KCC2 is developmentally regulated in a region-specific manner in the brain (Lu et al., 1999). It expresses earlier in subcortical structures such as the thalamus than in the cortex (Rivera et al., 1999) (Li et al., 2002; Wang et al., 2002). The differential maturation of Cl− transporter has been implicated in electroclinical uncoupling in neonatal seizures (Glykys et al., 2009). In the present study, we found that rapamycin treatment down-regulates KCC2 expression in the thalamus and to a lesser degree in the hippocampus. Injection of rapamycin or furosemide into the thalamus recapitulates the increased seizure susceptibility, indicative of possible involvement of thalamic KCC2 in this process. Of particular note, besides KCC2, furosemide has additional targets, including GABA receptors (Nicoll, 1978; Pearce, 1993), carbonic anhydrases (Supuran, 2008) and the Cl− cotransporter NKCC1 (Payne, 1997). It also interferes with homeostasis of osmolarity (Stringer and Pan, 1997) and alters extracellular space (Haglund and Hochman, 2005). We acknowledge that these additional actions could complicate interpretation of the data.
In the present study, we observed that furosemide exacerbates pilocarpine-induced behavioral seizures. A similar loop diuretic, ethacrynic acid, was also reported to induce SE in mice (Inoue et al., 1991). However, several previous studies also reported that furosemide possesses anticonvulsant activity (Reid et al., 2000; Staley, 2002). We believe that differences in the models used, animal ages, treatment protocols, and doses of furosemide could be confounding factors. For example, Holtkamp et al. reported that furosemide at 100 mg/kg terminates limbic SE elicited by continuous electric stimulation in freely moving rats, but the drug was delivered 2 hrs after SE and took 60–90 min to show an effect (Holtkamp et al., 2003). This is different from our experimental procedure in which we treated rats with furosemide 15 min before induction of seizures by pilocarpine. In particular, severe seizures likely increase NKCC1 activity and reduce KCC2 activity (Barmashenko et al., 2011; Dzhala et al., 2010; Nardou et al., 2011; Pathak et al., 2007), which may contribute to the anticonvulsant effect of furosemide. In other studies, furosemide was reported to attenuate seizures in an audiogeneic seizure model (Reid et al., 2000; Stringer and Pan, 1997). However, a recent study raised a concern about whether the anti-seizure activity of furosemide observed specifically in this model indeed reflects the drug’s anti-seizure activity, because a high concentration of furosemide is ototoxic (Frey, 2006). Previous studies also reported that furosemide possesses anticonvulsant activity in an in vitro brain slice model of epilepsy (Hochman et al., 1995). Interestingly, furosemide was still used to probe KCC2 activity in neuronal excitability in brain slice preparations in several recent studies (Barmashenko et al., 2011; Pathak et al., 2007). These later studies suggest that furosemide could increase neuronal excitability at electrophysiological levels. Nevertheless, multiple cellular targets and modes of action of furosemide could also account for these discrepancies.
We found that mTOR inhibition by rapamycin specifically reduces the expression of KCC2, but not other neurotransmitter receptors monitored in the thalamus and hippocampus. This is consistent with the notion that only a subset of genes is regulated by the mTOR pathway (Terada et al., 1994). It remains unclear why KCC2 is down-regulated in the thalamus and hippocampus without a significant change in expression in other brain regions we examined. KCC2 shows region-specific expression during brain development (Glykys et al., 2009; Li et al., 2002; Wang et al., 2002). Conceivably, region-specific inhibition of KCC2 expression by rapamycin is perhaps associated with a specific mechanism during brain development. Finally, it is of interest to know if down-regulation of KCC2 is cell-type specific.
It is worth noting that GABAA receptors and GABAergic interneurons are developmentally regulated. Differential expression of GABAA subunits in several brain areas, including the SNR, thalamus, and dentate granule layers, is associated with age-dependent vulnerability to seizures (Chudomel et al., 2009; Galanopoulou, 2007; Gibbs et al., 1996; Moshe et al., 1992). Conceivably, rapamycin may act via a direct effect on GABAA receptor expression. However, we did not find a noticeable change in the expression of GABAA receptors, including α1 and α3. Perhaps additional work, for example monitoring the expression of other GABAA receptors, is necessary to exclude fully any effect of rapamycin on GABAergic transmission.
Although our results appear contradictory to previous reports that rapamycin is capable of suppressing epileptogenesis and seizures (Huang et al., 2010; Meikle et al., 2008; Raffo et al., 2011; Zeng et al., 2009; Zeng et al., 2008; Zhou et al., 2009), we suggest that this paradoxical effect of rapamycin perhaps reflects a differential role of mTOR in normal immature versus epileptic brains. Rapamycin may exert anti-ictogenic effects by attenuating the pathological manifestation of hyper-excitatory networks in the epileptic brain associated with hyperactive mTOR signaling (Wong, 2010). However, it may also interfere with normal brain development that relies on the mTOR pathway, which could adversely sensitize immature animals to convulsants.
In summary, we found that inhibition of the mTOR pathway by rapamycin during brain development increases seizure susceptibility. Our findings could be clinically relevant at least under two scenarios. First, rapamycin is an immunosuppressant frequently used in organ transplantation and has also been proposed as a novel therapeutic for other diseases, including tumors. Thus, caution is warranted when children or adolescents are exposed to rapamycin because they may be put at risk of seizures, particularly when rapamycin is given together with other drugs such as muscarinic agonists. Second, rapamycin has been increasingly tested clinically in TSC patients. Our findings indicate that the age of TSC patients may be a confounding factor that could influence the overall effectiveness of rapamycin. We acknowledge that rapamycin potentially holds therapeutic value under conditions associated with genetic hyperactivation of the mTOR pathway; however, our results suggest that any rapamycin regimen ought to be empirically adjusted to avoid excessive inhibition of mTOR, particularly in pediatric TSC patients.
Inhibition of mTOR by rapamycin increases seizure susceptibility to pilocarpine in immature rats, but not in mature rats.
Rapamycin down-regulates KCC2 expression in the thalamus and hippocampus
Inhibition of thalamic mTOR and KCC2 increases seizure susceptibility to pilocarpine.
Acknowledgments
We would like to thank Dr. Lindsay Hough and Ms. Julia Nalwalk for assistance with animal cannulation. This work was funded by grants from the National Institute of Neurological Disorders and Strokes NS062068 (Y.H.).
Footnotes
Publisher's Disclaimer: This is a PDF file of an unedited manuscript that has been accepted for publication. As a service to our customers we are providing this early version of the manuscript. The manuscript will undergo copyediting, typesetting, and review of the resulting proof before it is published in its final citable form. Please note that during the production process errors may be discovered which could affect the content, and all legal disclaimers that apply to the journal pertain.
References
- Barmashenko G, et al. Positive shifts of the GABAA receptor reversal potential due to altered chloride homeostasis is widespread after status epilepticus. Epilepsia. 2011;52:1570–8. doi: 10.1111/j.1528-1167.2011.03247.x. [DOI] [PubMed] [Google Scholar]
- Blaesse P, et al. Cation-chloride cotransporters and neuronal function. Neuron. 2009;61:820–38. doi: 10.1016/j.neuron.2009.03.003. [DOI] [PubMed] [Google Scholar]
- Blumenfeld H, et al. Cortical and subcortical networks in human secondarily generalized tonic-clonic seizures. Brain. 2009;132:999–1012. doi: 10.1093/brain/awp028. [DOI] [PMC free article] [PubMed] [Google Scholar]
- Bonislawski DP, et al. Brain injury impairs dentate gyrus inhibitory efficacy. Neurobiology of disease. 2007;25:163–9. doi: 10.1016/j.nbd.2006.09.002. [DOI] [PMC free article] [PubMed] [Google Scholar]
- Bortone D, Polleux F. KCC2 expression promotes the termination of cortical interneuron migration in a voltage-sensitive calcium-dependent manner. Neuron. 2009;62:53–71. doi: 10.1016/j.neuron.2009.01.034. [DOI] [PMC free article] [PubMed] [Google Scholar]
- Bough KJ, et al. Mitochondrial biogenesis in the anticonvulsant mechanism of the ketogenic diet. Ann Neurol. 2006;60:223–35. doi: 10.1002/ana.20899. [DOI] [PubMed] [Google Scholar]
- Bryant AS, et al. Maintenance of thalamic epileptiform activity depends on the astrocytic glutamate-glutamine cycle. Journal of neurophysiology. 2009;102:2880–8. doi: 10.1152/jn.00476.2009. [DOI] [PMC free article] [PubMed] [Google Scholar]
- Buckmaster PS, et al. Inhibition of the mammalian target of rapamycin signaling pathway suppresses dentate granule cell axon sprouting in a rodent model of temporal lobe epilepsy. J Neurosci. 2009;29:8259–69. doi: 10.1523/JNEUROSCI.4179-08.2009. [DOI] [PMC free article] [PubMed] [Google Scholar]
- Buckmaster PS, Lew FH. Rapamycin suppresses mossy fiber sprouting but not seizure frequency in a mouse model of temporal lobe epilepsy. The Journal of neuroscience: the official journal of the Society for Neuroscience. 2011;31:2337–47. doi: 10.1523/JNEUROSCI.4852-10.2011. [DOI] [PMC free article] [PubMed] [Google Scholar]
- Burnett PE, et al. RAFT1 phosphorylation of the translational regulators p70 S6 kinase and 4E-BP1. Proc Natl Acad Sci U S A. 1998;95:1432–7. doi: 10.1073/pnas.95.4.1432. [DOI] [PMC free article] [PubMed] [Google Scholar]
- Chudomel O, et al. Age- and gender-related differences in GABAA receptor-mediated postsynaptic currents in GABAergic neurons of the substantia nigra reticulata in the rat. Neuroscience. 2009;163:155–67. doi: 10.1016/j.neuroscience.2009.06.025. [DOI] [PMC free article] [PubMed] [Google Scholar]
- Crino PB. Rapamycin and tuberous sclerosis complex: from Easter Island to epilepsy. Ann Neurol. 2008;63:415–7. doi: 10.1002/ana.21369. [DOI] [PubMed] [Google Scholar]
- Crino PB, et al. The tuberous sclerosis complex. The New England journal of medicine. 2006;355:1345–56. doi: 10.1056/NEJMra055323. [DOI] [PubMed] [Google Scholar]
- Dawson TM, et al. Immunosuppressant FK506 enhances phosphorylation of nitric oxide synthase and protects against glutamate neurotoxicity. Proceedings of the National Academy of Sciences of the United States of America. 1993;90:9808–12. doi: 10.1073/pnas.90.21.9808. [DOI] [PMC free article] [PubMed] [Google Scholar]
- Dzhala VI, et al. Progressive NKCC1-dependent neuronal chloride accumulation during neonatal seizures. The Journal of neuroscience: the official journal of the Society for Neuroscience. 2010;30:11745–61. doi: 10.1523/JNEUROSCI.1769-10.2010. [DOI] [PMC free article] [PubMed] [Google Scholar]
- Dzhala VI, et al. NKCC1 transporter facilitates seizures in the developing brain. Nature medicine. 2005;11:1205–13. doi: 10.1038/nm1301. [DOI] [PubMed] [Google Scholar]
- Frey HH. Antiepileptic effect of loop diuretics? Comment to “Differential effects of cation-chloride co-transport-blocking diuretics in a rat hippocampal slice model of epilepsy” by Margineanu, Klitgaard. Epilepsy Res. 2006;69:93–99. doi: 10.1016/j.eplepsyres.2006.01.005. [DOI] [PubMed] [Google Scholar]; Epilepsy research. 71:237–8. author reply 239–40. [Google Scholar]
- Galanopoulou AS. Developmental patterns in the regulation of chloride homeostasis and GABA(A) receptor signaling by seizures. Epilepsia. 2007;48(Suppl 5):14–8. doi: 10.1111/j.1528-1167.2007.01284.x. [DOI] [PubMed] [Google Scholar]
- Gale K. Subcortical structures and pathways involved in convulsive seizure generation. J Clin Neurophysiol. 1992;9:264–77. doi: 10.1097/00004691-199204010-00007. [DOI] [PubMed] [Google Scholar]
- Gauvain G, et al. The neuronal K-Cl cotransporter KCC2 influences postsynaptic AMPA receptor content and lateral diffusion in dendritic spines. Proceedings of the National Academy of Sciences of the United States of America. 2011;108:15474–9. doi: 10.1073/pnas.1107893108. [DOI] [PMC free article] [PubMed] [Google Scholar]
- Gibbs JW, 3rd, et al. GABAA receptor function in developing rat thalamic reticular neurons: whole cell recordings of GABA-mediated currents and modulation by clonazepam. J Neurophysiol. 1996;76:2568–79. doi: 10.1152/jn.1996.76.4.2568. [DOI] [PubMed] [Google Scholar]
- Glykys J, et al. Differences in cortical versus subcortical GABAergic signaling: a candidate mechanism of electroclinical uncoupling of neonatal seizures. Neuron. 2009;63:657–72. doi: 10.1016/j.neuron.2009.08.022. [DOI] [PMC free article] [PubMed] [Google Scholar]
- Gulyas AI, et al. The KCl cotransporter, KCC2, is highly expressed in the vicinity of excitatory synapses in the rat hippocampus. The European journal of neuroscience. 2001;13:2205–17. doi: 10.1046/j.0953-816x.2001.01600.x. [DOI] [PubMed] [Google Scholar]
- Haglund MM, Hochman DW. Furosemide and mannitol suppression of epileptic activity in the human brain. Journal of neurophysiology. 2005;94:907–18. doi: 10.1152/jn.00944.2004. [DOI] [PubMed] [Google Scholar]
- Hochman DW, et al. Dissociation of synchronization and excitability in furosemide blockade of epileptiform activity. Science. 1995;270:99–102. doi: 10.1126/science.270.5233.99. [DOI] [PubMed] [Google Scholar]
- Holmes GL, Stafstrom CE. Tuberous sclerosis complex and epilepsy: recent developments and future challenges. Epilepsia. 2007;48:617–30. doi: 10.1111/j.1528-1167.2007.01035.x. [DOI] [PubMed] [Google Scholar]
- Holtkamp M, et al. Furosemide terminates limbic status epilepticus in freely moving rats. Epilepsia. 2003;44:1141–4. doi: 10.1046/j.1528-1157.2003.14003.x. [DOI] [PubMed] [Google Scholar]
- Huang X, et al. Pharmacological inhibition of the mammalian target of rapamycin pathway suppresses acquired epilepsy. Neurobiology of disease. 2010;40:193–9. doi: 10.1016/j.nbd.2010.05.024. [DOI] [PMC free article] [PubMed] [Google Scholar]
- Huang Y, et al. Altered histone acetylation at glutamate receptor 2 and brain-derived neurotrophic factor genes is an early event triggered by status epilepticus. J Neurosci. 2002;22:8422–8. doi: 10.1523/JNEUROSCI.22-19-08422.2002. [DOI] [PMC free article] [PubMed] [Google Scholar]
- Huang Y, et al. The cationic amino acid transporters CAT1 and CAT3 mediate NMDA receptor activation-dependent changes in elaboration of neuronal processes via the mammalian target of rapamycin mTOR pathway. J Neurosci. 2007;27:449–58. doi: 10.1523/JNEUROSCI.4489-06.2007. [DOI] [PMC free article] [PubMed] [Google Scholar]
- Huberfeld G, et al. Perturbed chloride homeostasis and GABAergic signaling in human temporal lobe epilepsy. The Journal of neuroscience: the official journal of the Society for Neuroscience. 2007;27:9866–73. doi: 10.1523/JNEUROSCI.2761-07.2007. [DOI] [PMC free article] [PubMed] [Google Scholar]
- Hubner CA, et al. Disruption of KCC2 reveals an essential role of K-Cl cotransport already in early synaptic inhibition. Neuron. 2001;30:515–24. doi: 10.1016/s0896-6273(01)00297-5. [DOI] [PubMed] [Google Scholar]
- Inoue M, et al. Ethacrynic acid-induced glutamate release from mouse brain synaptosomes. Brain research. 1991;543:160–2. doi: 10.1016/0006-8993(91)91060-e. [DOI] [PubMed] [Google Scholar]
- Jaworski J, et al. Control of dendritic arborization by the phosphoinositide-3′-kinase-Akt-mammalian target of rapamycin pathway. J Neurosci. 2005;25:11300–12. doi: 10.1523/JNEUROSCI.2270-05.2005. [DOI] [PMC free article] [PubMed] [Google Scholar]
- Krueger DA, et al. Everolimus for subependymal giant-cell astrocytomas in tuberous sclerosis. The New England journal of medicine. 2010;363:1801–11. doi: 10.1056/NEJMoa1001671. [DOI] [PubMed] [Google Scholar]
- Kumar V, et al. Regulation of dendritic morphogenesis by Ras-PI3K-Akt-mTOR and Ras-MAPK signaling pathways. J Neurosci. 2005;25:11288–99. doi: 10.1523/JNEUROSCI.2284-05.2005. [DOI] [PMC free article] [PubMed] [Google Scholar]
- Lenz G, Avruch J. Glutamatergic regulation of the p70S6 kinase in primary mouse neurons. J Biol Chem. 2005;280:38121–4. doi: 10.1074/jbc.C500363200. [DOI] [PubMed] [Google Scholar]
- Li H, et al. KCC2 interacts with the dendritic cytoskeleton to promote spine development. Neuron. 2007;56:1019–33. doi: 10.1016/j.neuron.2007.10.039. [DOI] [PubMed] [Google Scholar]
- Li H, et al. Patterns of cation-chloride cotransporter expression during embryonic rodent CNS development. The European journal of neuroscience. 2002;16:2358–70. doi: 10.1046/j.1460-9568.2002.02419.x. [DOI] [PubMed] [Google Scholar]
- Ljungberg MC, et al. Rapamycin suppresses seizures and neuronal hypertrophy in a mouse model of cortical dysplasia. Dis Model Mech. 2009;2:389–98. doi: 10.1242/dmm.002386. [DOI] [PMC free article] [PubMed] [Google Scholar]
- Lu J, et al. Developmental regulation of the neuronal-specific isoform of K-Cl cotransporter KCC2 in postnatal rat brains. Journal of neurobiology. 1999;39:558–68. [PubMed] [Google Scholar]
- McCormick DA, Bal T. Sleep and arousal: thalamocortical mechanisms. Annu Rev Neurosci. 1997;20:185–215. doi: 10.1146/annurev.neuro.20.1.185. [DOI] [PubMed] [Google Scholar]
- McDaniel SS, Wong M. Therapeutic role of mammalian target of rapamycin (mTOR) inhibition in preventing epileptogenesis. Neuroscience letters. 2011;497:231–9. doi: 10.1016/j.neulet.2011.02.037. [DOI] [PMC free article] [PubMed] [Google Scholar]
- McNamara JO, et al. Evidence implicating substantia nigra in regulation of kindled seizure threshold. J Neurosci. 1984;4:2410–7. doi: 10.1523/JNEUROSCI.04-09-02410.1984. [DOI] [PMC free article] [PubMed] [Google Scholar]
- Meikle L, et al. Response of a neuronal model of tuberous sclerosis to mammalian target of rapamycin (mTOR) inhibitors: effects on mTORC1 and Akt signaling lead to improved survival and function. J Neurosci. 2008;28:5422–32. doi: 10.1523/JNEUROSCI.0955-08.2008. [DOI] [PMC free article] [PubMed] [Google Scholar]
- Morgan JI, et al. Mapping patterns of c-fos expression in the central nervous system after seizure. Science. 1987;237:192–7. doi: 10.1126/science.3037702. [DOI] [PubMed] [Google Scholar]
- Moshe SL, et al. Age-dependent changes in substantia nigra GABA-mediated seizure suppression. Epilepsy Res Suppl. 1992;8:97–106. doi: 10.1016/b978-0-444-89710-7.50018-5. [DOI] [PubMed] [Google Scholar]
- Nabekura J, et al. Reduction of KCC2 expression and GABAA receptor-mediated excitation after in vivo axonal injury. The Journal of neuroscience: the official journal of the Society for Neuroscience. 2002;22:4412–7. doi: 10.1523/JNEUROSCI.22-11-04412.2002. [DOI] [PMC free article] [PubMed] [Google Scholar]
- Nardou R, et al. Neuronal chloride accumulation and excitatory GABA underlie aggravation of neonatal epileptiform activities by phenobarbital. Brain: a journal of neurology. 2011;134:987–1002. doi: 10.1093/brain/awr041. [DOI] [PubMed] [Google Scholar]
- Nicoll RA. The blockade of GABA mediated responses in the frog spinal cord by ammonium ions and furosemide. The Journal of physiology. 1978;283:121–32. doi: 10.1113/jphysiol.1978.sp012491. [DOI] [PMC free article] [PubMed] [Google Scholar]
- Palma E, et al. Anomalous levels of Cl- transporters in the hippocampal subiculum from temporal lobe epilepsy patients make GABA excitatory. Proceedings of the National Academy of Sciences of the United States of America. 2006;103:8465–8. doi: 10.1073/pnas.0602979103. [DOI] [PMC free article] [PubMed] [Google Scholar]
- Pathak HR, et al. Disrupted dentate granule cell chloride regulation enhances synaptic excitability during development of temporal lobe epilepsy. The Journal of neuroscience: the official journal of the Society for Neuroscience. 2007;27:14012–22. doi: 10.1523/JNEUROSCI.4390-07.2007. [DOI] [PMC free article] [PubMed] [Google Scholar]
- Payne JA. Functional characterization of the neuronal-specific K-Cl cotransporter: implications for [K+]o regulation. The American journal of physiology. 1997;273:C1516–25. doi: 10.1152/ajpcell.1997.273.5.C1516. [DOI] [PubMed] [Google Scholar]
- Paz JT, et al. Activity of ventral medial thalamic neurons during absence seizures and modulation of cortical paroxysms by the nigrothalamic pathway. The Journal of neuroscience: the official journal of the Society for Neuroscience. 2007;27:929–41. doi: 10.1523/JNEUROSCI.4677-06.2007. [DOI] [PMC free article] [PubMed] [Google Scholar]
- Pearce RA. Physiological evidence for two distinct GABAA responses in rat hippocampus. Neuron. 1993;10:189–200. doi: 10.1016/0896-6273(93)90310-n. [DOI] [PubMed] [Google Scholar]
- Racine RJ. Modification of seizure activity by electrical stimulation. I. After-discharge threshold. Electroencephalogr Clin Neurophysiol. 1972;32:269–79. doi: 10.1016/0013-4694(72)90176-9. [DOI] [PubMed] [Google Scholar]
- Raffo E, et al. A pulse rapamycin therapy for infantile spasms and associated cognitive decline. Neurobiology of disease. 2011;43:322–9. doi: 10.1016/j.nbd.2011.03.021. [DOI] [PMC free article] [PubMed] [Google Scholar]
- Reid KH, et al. Agents which block potassium-chloride cotransport prevent sound-triggered seizures in post-ischemic audiogenic seizure-prone rats. Brain research. 2000;864:134–7. doi: 10.1016/s0006-8993(00)02121-1. [DOI] [PubMed] [Google Scholar]
- Rivera C, et al. The K+/Cl- co-transporter KCC2 renders GABA hyperpolarizing during neuronal maturation. Nature. 1999;397:251–5. doi: 10.1038/16697. [DOI] [PubMed] [Google Scholar]
- Sabatino M, et al. Inhibitory control by substantia nigra of generalized epilepsy in the cat. Epilepsy Res. 1988;2:380–6. doi: 10.1016/0920-1211(88)90049-6. [DOI] [PubMed] [Google Scholar]
- Sarbassov DD, et al. Growing roles for the mTOR pathway. Curr Opin Cell Biol. 2005;17:596–603. doi: 10.1016/j.ceb.2005.09.009. [DOI] [PubMed] [Google Scholar]
- Schofield CM, et al. A gain in GABAA receptor synaptic strength in thalamus reduces oscillatory activity and absence seizures. Proceedings of the National Academy of Sciences of the United States of America. 2009;106:7630–5. doi: 10.1073/pnas.0811326106. [DOI] [PMC free article] [PubMed] [Google Scholar]
- Staley KJ. Diuretics as antiepileptic drugs: should we go with the flow? Epilepsy currents/American Epilepsy Society. 2002;2:35–38. doi: 10.1046/j.1535-7597.2002.00018.x. [DOI] [PMC free article] [PubMed] [Google Scholar]
- Stringer JL, Pan E. Effect of seizures and diuretics on the osmolality of the cerebrospinal fluid. Brain research. 1997;745:328–30. doi: 10.1016/s0006-8993(96)01253-x. [DOI] [PubMed] [Google Scholar]
- Sunnen CN, et al. Inhibition of the mammalian target of rapamycin blocks epilepsy progression in NS-Pten conditional knockout mice. Epilepsia. 2011;52:2065–75. doi: 10.1111/j.1528-1167.2011.03280.x. [DOI] [PMC free article] [PubMed] [Google Scholar]
- Supuran CT. Diuretics: from classical carbonic anhydrase inhibitors to novel applications of the sulfonamides. Current pharmaceutical design. 2008;14:641–8. doi: 10.2174/138161208783877947. [DOI] [PubMed] [Google Scholar]
- Tang SJ, et al. A rapamycin-sensitive signaling pathway contributes to long-term synaptic plasticity in the hippocampus. Proc Natl Acad Sci U S A. 2002;99:467–72. doi: 10.1073/pnas.012605299. [DOI] [PMC free article] [PubMed] [Google Scholar]
- Tavazoie SF, et al. Regulation of neuronal morphology and function by the tumor suppressors Tsc1 and Tsc2. Nat Neurosci. 2005;8:1727–34. doi: 10.1038/nn1566. [DOI] [PubMed] [Google Scholar]
- Terada N, et al. Rapamycin selectively inhibits translation of mRNAs encoding elongation factors and ribosomal proteins. Proceedings of the National Academy of Sciences of the United States of America. 1994;91:11477–81. doi: 10.1073/pnas.91.24.11477. [DOI] [PMC free article] [PubMed] [Google Scholar]
- Thiele EA. Managing and understanding epilepsy in tuberous sclerosis complex. Epilepsia. 2010;51(Suppl 1):90–1. doi: 10.1111/j.1528-1167.2009.02458.x. [DOI] [PubMed] [Google Scholar]
- Tornberg J, et al. Behavioural phenotypes of hypomorphic KCC2-deficient mice. Eur J Neurosci. 2005;21:1327–37. doi: 10.1111/j.1460-9568.2005.03959.x. [DOI] [PubMed] [Google Scholar]
- Turski L, et al. The basal ganglia, the deep prepyriform cortex, and seizure spread: bicuculline is anticonvulsant in the rat striatum. Proc Natl Acad Sci U S A. 1989a;86:1694–7. doi: 10.1073/pnas.86.5.1694. [DOI] [PMC free article] [PubMed] [Google Scholar]
- Turski L, et al. Review: cholinergic mechanisms and epileptogenesis. The seizures induced by pilocarpine: a novel experimental model of intractable epilepsy. Synapse. 1989b;3:154–71. doi: 10.1002/syn.890030207. [DOI] [PubMed] [Google Scholar]
- Wang C, et al. Developmental changes in KCC1, KCC2, and NKCC1 mRNA expressions in the rat brain. Brain research. Developmental brain research. 2002;139:59–66. doi: 10.1016/s0165-3806(02)00536-9. [DOI] [PubMed] [Google Scholar]
- White LE, Price JL. The functional anatomy of limbic status epilepticus in the rat. I. Patterns of 14C-2-deoxyglucose uptake and Fos immunocytochemistry. J Neurosci. 1993;13:4787–809. doi: 10.1523/JNEUROSCI.13-11-04787.1993. [DOI] [PMC free article] [PubMed] [Google Scholar]
- Wong M. Mammalian target of rapamycin (mTOR) inhibition as a potential antiepileptogenic therapy: From tuberous sclerosis to common acquired epilepsies. Epilepsia. 2010;51:27–36. doi: 10.1111/j.1528-1167.2009.02341.x. [DOI] [PMC free article] [PubMed] [Google Scholar]
- Woo NS, et al. Hyperexcitability and epilepsy associated with disruption of the mouse neuronal-specific K-Cl cotransporter gene. Hippocampus. 2002;12:258–68. doi: 10.1002/hipo.10014. [DOI] [PubMed] [Google Scholar]
- Zeng LH, et al. The mammalian target of rapamycin signaling pathway mediates epileptogenesis in a model of temporal lobe epilepsy. J Neurosci. 2009;29:6964–72. doi: 10.1523/JNEUROSCI.0066-09.2009. [DOI] [PMC free article] [PubMed] [Google Scholar]
- Zeng LH, et al. Rapamycin prevents epilepsy in a mouse model of tuberous sclerosis complex. Ann Neurol. 2008;63:444–53. doi: 10.1002/ana.21331. [DOI] [PMC free article] [PubMed] [Google Scholar]
- Zhang L, et al. Development of GABA-mediated, chloride-dependent inhibition in CA1 pyramidal neurones of immature rat hippocampal slices. The Journal of physiology. 1991;444:25–49. doi: 10.1113/jphysiol.1991.sp018864. [DOI] [PMC free article] [PubMed] [Google Scholar]
- Zhou J, et al. Pharmacological inhibition of mTORC1 suppresses anatomical, cellular, and behavioral abnormalities in neural-specific Pten knock-out mice. J Neurosci. 2009;29:1773–83. doi: 10.1523/JNEUROSCI.5685-08.2009. [DOI] [PMC free article] [PubMed] [Google Scholar]