

Abstract
We discuss a novel atomic force microscope-based method for identifying individual short DNA molecules (<5000 bp) within a complex mixture by measuring the intra-molecular spacing of a few sequence-specific topographical labels in each molecule. Using this method, we accurately determined the relative abundance of individual DNA species in a 15-species mixture, with fewer than 100 copies per species sampled. To assess the scalability of our approach, we conducted a computer simulation, with realistic parameters, of the hypothetical problem of detecting abundance changes in individual gene transcripts between two single-cell human messenger RNA samples, each containing roughly 9000 species. We found that this approach can distinguish transcript species abundance changes accurately in most cases, including transcript isoforms which would be challenging to quantitate with traditional methods. Given its sensitivity and procedural simplicity, our approach could be used to identify transcript-derived complementary DNAs, where it would have substantial technical and practical advantages versus established techniques in situations where sample material is scarce.
Keywords: bionanoscience, atomic force microscopy, bioinformatics
1. Introduction
Detection of and counting the copy number of a particular species of short DNA molecule (<5000 bp) in a heterogeneous mixture of relatively small sample quantity, such as might be derived from a tissue biopsy, occupies a central role in many biotechnology applications (e.g. transcription profiling, exome sequencing, polymorphism detection, RNA seq, chromatin immunoprecipitation seq, and so on). In these applications, detection methods require very high signal-to-noise ratios and the ability to yield a signal from small numbers (<100) of positive events [1]. Over the last decades, these applications have been addressed by PCR, in situ hybridization of species-specific fluorescent oligos, microarrays and next-generation sequencing, but not without certain shortfalls and shortcomings [2]. PCR and in situ probe hybridization techniques, which rely on the assembly of highly specific molecular complexes, satisfy the high gain requirements, but suffer serious problems when used with high-complexity mixtures. In situations with many different targets present at low abundance, the kinetics of molecular complex formation is unfavourable and many probe species are required. Typically, this diversity leads to unacceptable cross-talk between probes or requires the use of secondary sorting methods to reduce the complexity of the sample. Microarrays and nextgen-sequencing technologies are relatively insensitive and require enzymatic amplification of low-abundance samples. The amplification process is slow, technically complex and distorts the relative abundance of species, particularly those with high sequence similarity (i.e. transcript variants, gene family members, and so on) [3].
Nanotechnology-based single molecule approaches provide a competing approach to such applications requiring molecular recognition, thus opening new avenues to medical diagnostics, genetic tests and pathogen detection. In this paper, we explore a novel, alternative method for identifying individual DNA molecules within a complex mixture, whereby the target molecule itself becomes the identifying probe, thereby avoiding many of the problems inherent in the established methods discussed above. In our approach, the backbone of each DNA molecule is decorated with a few topographical labels, introduced at nicking endonuclease recognition sites which are measured very precisely with atomic force microscopy (AFM), to form a pattern unique to that species. A key advantage of this approach is that the labelling chemistry is simple, highly parallel (a single label used for all molecules) and no amplification is required. We illustrate this method based on a ‘self-labelling’ approach in the context of potential application to an important problem in molecular biology: identifying individual cDNA molecules in a low-abundance sample (e.g. single cell) for the purpose of gene-expression profiling.
2. Material and methods
2.1. DNA labelling protocol
DNA samples are diluted in 1× NEBuffer 4 (50 mM potassium acetate, 20 mM Tris-acetate, 10 mM magnesium acetate, 1 mM dithriothreitol, pH 7.9; New England Biolabs) enzymatically tagged with 1 U nicking enzyme nt.BsmAI (New England Biolabs) for 1 h at 37°C. Linearized and nicked DNA is spin-purified and eluted with purified water, pH 8.3, or 10 mM Tris–Cl, pH 8.5 (Qiagen QIAquick Gel Extraction Kit). Sample concentration is determined by fluorometric quantitation (Qubit Fluorometer) before biotin incorporation. Biotin dUTP labelling at 3′ ends is incorporated at nick sites through a terminal transferase reaction in 1× terminal transferase buffer (Roche), 5 mM CoCl2 (Roche), 0.05 mM Biotin-16-dUTP (Roche) and 20 U terminal transferase enzyme (New England Biolabs) for 1 h at 37°C. The biotinylated DNAs are spin-purified and eluted with 10 mM Tris–Cl, pH 8.5 (Qiagen QIAquick Gel Extraction Kit). For AFM visualization of tagged nick sites, approximately 1 μg Streptavidin (New England Biolabs) is added to the biotinylated sample and incubated at room temperature for more than 2 h or overnight at 4°C.
For the experiments with lambda phage DNA, samples were prepared from N6-methyladenine-free lambda DNA (New England Biolabs), cut into 15 fragments in 1×NEBuffer 4 and 5 U ClaI restriction endonuclease (New England Biolabs) for 1 h at 37°C. Enzyme-digested lambda fragments are spin-purified and eluted with 10 mM Tris–Cl, pH 8.5 (Qiagen) and fluorometrically quantified (Qubit Fluorometer). Equimolar amounts, determined fluorometrically, of SphI-linearized pUC19 plasmid is linearized and added as an additional species. The lambda plus pUC19 mixture are then nicked and labelled as described above.
2.2. Atomic force microscopy imaging
Samples are deposited on NiCl2-derivatized mica substrates by fluid shear flow and washed three times with purified water before being spin-dried in a spin coater at 4000 r.p.m. for 30 s. Samples are imaged in tapping mode in air with the Dimension ICON AFM (Bruker Metrology) using k = approximately 3 N m−1 silicon probes (Nanosensors). Image resolution was 2 nm pixel−1. DNA contour lengths and streptavidin label locations were measured manually with NIH ImageJ. Classification of individual molecule as belonging to a particular species is accomplished using the same alignment algorithm as in the simulation (see §2.4.2), with the following exceptions: the universe of available hypotheses was limited to the 15 fragments known to be present in the mixture; to be conservative, the allowed label alignment precision and overall length measurement precision were taken as 4 per cent, and the estimated label rate was taken as 50 per cent and both forward and reverse alignments were scored.
2.3. Analysis of measurement errors
2.3.1. Unlabelled DNA fragments
Eight fragments, ranging in length from 33 to 450 nm were derived from RsaI restriction digestion of plasmids pUC19 and pTZ19R, and from a 100 bp sizing ladder (New England Biolabs).
2.3.2. Linearized, labelled pUC19 and pTZ19R plasmids
Label positions were measured relative to one end of the template molecule. PUC19 contains four ntBsmAI sites, and pTZ19R contains two sites. Precision and mean label position for the streptavidin-labelled sites in the plasmids was estimated by fitting a mixture of normal distributions to the ensemble of aligned data, using a standard expectation maximization algorithm (Matlab). Measured lengths are scaled by a factor of 1.02, which corrects for the average compression in DNA pitch under the experimental conditions versus the canonical pitch of BDNA (0.33 nm bp−1). This scaling factor is stable between experiments using the same surface deposition conditions.
2.4. Simulation and database matching
2.4.1. Simulated single-cell transcriptomes
Expression data from two distinct reference RNA samples, Stratagene Universal Human Reference RNA (UHRR, catalogue no. 740000) and Ambion Human Brain Reference RNA (HBRR, catalogue no. 6050), were taken from the publicly available National Center for Biotechnology Information (NCBI) Gene Expression Omnibus (GEO) record GSE5350, generated by the MicroArray Quality Control (MAQC) project [4]. MAQC expression profile data were generated at multiple test sites using a variety of microarray-based and alternative technology platforms (Taq-MAN PCR, StartPCR, and so on). Gene-expression levels for each species were according to those measured by the AFFX platform and TAQMAN platform. Roughly 9000 distinct transcripts were detected in each sample. Normalized to reference gene RNA polymerase II (POLR2A), the relative levels of expression ranged from log10 −3.5 to log10 +1.5, excluding ribosomal RNA. For the purposes of simulation, we normalized transcript counts to the abundance of gene POLR2A as well, and roughly 1 500 000 cDNA molecules for each transcriptome were simulated (roughly equivalent to three single-cell complements of mRNA [5,6]), assuming a POLR2A abundance of 200 copies per sample.
We located the recognition sites 5′-GTCTC-3′ and 3′-CAGAG-5′ of nicking endonuclease nt.BsmAI on each transcript in the NCBI Reference Sequence (RefSeq) database of human mRNAs and obtained its restriction map. Synthetic transcripts in the database were excluded. The poly(A) tails at the 3′ end of the mRNAs were removed. Median ATP-binding cassette (ABC) transcript length is 4.4 kb or 1.47 μm using a constant 0.33 nm-to-bp conversion factor. Ninety eight per cent of the transcripts are longer than 500 nm, so for topographic labelling, the expected label positioning error is of the order of 1.5 per cent of total transcript length.
2.4.2. Matching single molecule sparse label patterns to transcript database
The process of assigning fully and partially decorated cDNA molecules to the library of possible matches proceeded as follows: a simulated data molecule (𝒟) and an individual hypothesis molecule (ℋ) are aligned from the 3′ end, which was taken to be labelled. A score is calculated for each possible alignment:
| 2.1 |
where
| 2.2 |
and
| 2.3 |
Here L equals the number of aligned labels between 𝒟 and ℋ, M equals the number of label sites in ℋ but missed in 𝒟, F equals the number of false labels (i.e. labels in 𝒟 but not in ℋ), pl equals expected true label rate per site, pf equals expected false label rate per molecule, d equals distance between label pairs and error is the estimated average label position error. The best score is taken to be the maximum of the scores from all possible alignments between ℋ and 𝒟.
2.4.3. Matching single molecule short sequence reads with transcript database
The method used to assign simulated single molecule short sequence reads with transcripts of origin relied on standard dynamic programming techniques, and is detailed by Lipson et al. [7] and used here without modification. The algorithm results in an alignment score of 5 for a perfect alignment and lower scores for imperfect alignments. Following the study of Lipson et al. [7], only alignments with scores of ≥ 4.3 were considered. We called a true positive if a short-read obtained the highest alignment score (and score of ≥ 4.3) when it is aligned uniquely with its corresponding correct hypothesis. Otherwise, it was recognized as false positive. By varying the alignment score from 5 to 4.3, we obtained the receiver-operating characteristic (ROC) curves of using the single molecule sequencing approach.
3. Results
3.1. Labelling efficiency and measurement errors
To introduce topographic labels, DNA molecules were nicked multiple times using a frequent cutting nicking endonuclease (e.g. nt.BsmAI, ‘5GTCTC3’), followed by enzymatic addition of biotinylated nucleotides at each nick site via terminal transferase. The biotin-labelled molecules were then reacted with an excess of streptavidin in solution, for the purpose of rendering the site readily identifiable in an AFM image. The position of the streptavidin labels, and their spacing along the molecule, corresponds with high accuracy to the pattern of nicking enzyme recognition sequences predicted from the molecule's underlying base-by-base sequence. Figure 1a–c depicts the imaging and measurement process flow, and shows actual AFM height profiles of labelled molecules. Achievable label site position error and labelling efficiencies are the key determinants of matching specificity in this approach. We conducted a series of experiments using topographically labelled, linearized plasmids and short unlabelled restriction fragments to ascertain the functional form and variance of point-to-point positional error, and to determine achievable label decoration efficiency per nick site (figure 2). Median labelling efficiency per site was 79 per cent (range 67–96%). Incorrect labels, taken as labels located greater than 5 per cent from their predicted position, were observed on average once per 33 molecules. These false labels were owing either to spurious nicks or non-specific binding of the streptavidin. The DNA contour length measured by AFM was directly proportional to the theoretical contour length over the range of interest, 0–1000 nm, a result consistent with other studies [8–10]. The standard deviation of length/label position measurement, shown in figure 2d, was 2.2 per cent of the measured contour length, plus constant term, 3.6 nm.
Figure 1.
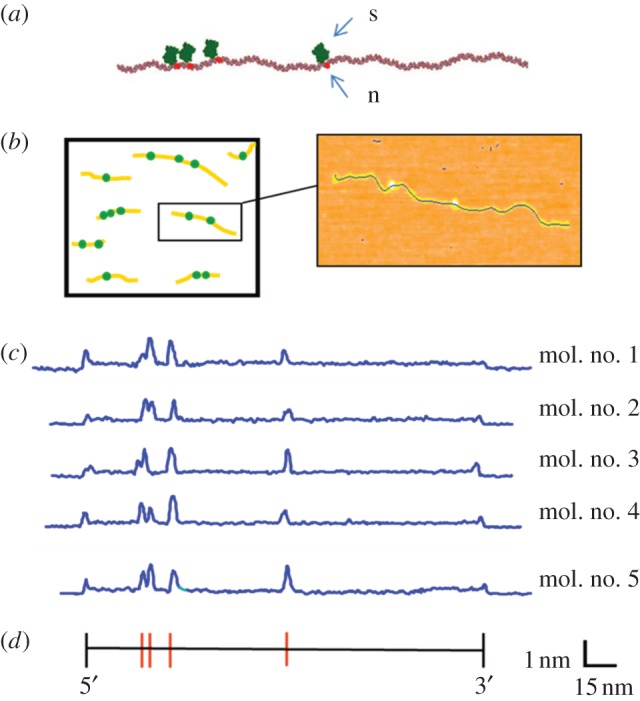
Topographic labelling with nicking restriction endonucleases. (a) A free 3′OH group is generated on one strand of the double helix by a nicking enzyme (n), followed by enzymatic addition of biotin and streptavidin (s) at the modified site, for the purpose of rendering the site readily identifiable in an AFM image. This chemistry can be performed in solution, followed by deposition of the sample on mica for AFM imaging. (b) Many individual molecules are imaged together, and the number and spacing of streptavidin labels is subsequently determined. (c) Experimentally measured AFM height profiles of linearized pUC19 plasmids labelled at the nt.BsmAI recognition sequence (5′-GTCTC-3′), indicated by the red bars in the sequence map, below. The backbone profiles of five fully labelled molecules are identical, demonstrating the repeatability of the process.
Figure 2.

Labelling efficiency and functional form of label positioning error. (a) Four constructs derived from linearized plasmids pUC19 and pTZ19R used to estimate topographic labelling efficiency and positional measurement error. Red marks indicate the location, in nanometres, of the nt.BsmAI nick sites with respect to the left end of each molecule. (b) Labelling efficiency per site determined from measurement of populations of each of the four constructs. (c) Plot of measured versus expected label position and total contour length for labelled constructs (green) and unlabelled DNA molecules (blue), as determined by AFM. The error bars represent ±1 s.d. about the mean. (d) Plot of measurement precision (s.d.) versus size for labelled constructs (green) and unlabelled DNA molecules (blue).
We define label position error as the uncertainty in localizing a topographic label occurring somewhere between the 3′- and 5′-ends of the molecule. Taking the ‘average’ label position to be the centre of the molecule and thus average label position error is (ε × L)/2, where ε is the overall precision achievable for measuring the total length, L, of a given molecule. This estimate allows us to obtain a lower bound for the achievable label position error for a species of a given length. The actual label position error will also include the effect of the random variation in absolute accuracy of label position, α, after correcting for systematic bias. This is estimated from the standard error of the residuals in the linear regression of the absolute sizing data (figure 2c) to be of the order of 5 nm. The covariance between the error ε and α is unknown, but following the logic above, we can estimate the range of the convoluted errors to be  on the lower end, and (ε + α)/2 on the higher end. Given ε is equal to 2.2% × L and α equal to 5 nm, this step yields an expected range for average label position error of between 1 and 2 per cent for molecules of total length 400–1000 nm.
3.2. Identifying and counting DNA species in a complex mixture
We used the topographic labelling scheme to identify individual nt.BsmAI-labelled species, molecule-by-molecule, from within a mixture of short DNA molecules (figure 3a). Within this mixture, eight of the 15 fragments contained at least one nt.BsmAI recognition site. Figure 3b shows typical AFM-derived height profiles of single, labelled molecules (blue trace) and the accompanying predicted location of the nicking restriction endonuclease recognition sites (red bars), determined by nucleotide sequence. Figure 3c shows experimental results from AFM analysis of a mixture of 2000 cDNA-sized molecules, comprising equal amounts of species a–o. These data were pooled from four independent, similar replicates and measured blindly—the experimenter knew neither the number of species in the mixture nor their sizes and labelling patterns. In this experiment, each molecule was measured and converted to a ‘fingerprint,’ which was matched uniquely to the known patterns for the 15 species (see §2). In the figure, results of the matching process are depicted schematically: the data are represented as a 2000 row × 15 column matrix, where each row represents a single molecule, randomly ordered, and the likelihood that it matches one of the 15 patterns, a–o, is given by the colour in the corresponding column. A large majority of the counts were assigned to a specific species with high confidence (green colour, probability of match greater than 80%). For the ‘raw data’, the columns of the data matrix are ordered by pattern length. To better visualize the relationship between the different patterns, the columns were re-ordered using a pairwise hierarchical clustering algorithm, whereby the probability that a specific molecule matches a specific pattern is treated as a ‘distance’, and all the ‘closely spaced’ molecules are grouped together; the resulting order of the columns represents the relative similarity between the species' nt.BsmAI labelling pattern and the area of the ‘blocks’ in each column is proportional to the number of assigned counts for that species.
Figure 3.

Identifying individual species in a mixture. (a) Nt.BsmAI sequence maps (red bars) of 15 fragments from a ClaI digest of lambda phage genomic DNA ordered by total length. The smallest fragment, species ‘a’, is 354 bp or 177 nm, and the longest fragment, species ‘o’, is 4398 bp or 1451 nm. (b) Height profiles of 2000 molecules, comprising equal amounts of species a-o, were matched uniquely to the known patterns for the 15 species. The data are represented as 2000 row×15 column matrix, where each row represents a single molecule, and the likelihood that it matches one of the 15 patterns, a-o, is given by the colour in the corresponding column. (Note that not all 2000 rows are resolved owing to the resolution of the printed figure). The large majority of molecules were assigned to a specific species with high confidence (green colour, probability of match >80%). The ‘raw data’ are ordered column-wise by pattern length. The data were re-ordered using a pairwise hierarchical clustering algorithm; the resulting order of the columns represents the relative similarity between the species' nt.BsmAI labelling pattern and the area of the ‘blocks’ in each column is proportional to the number of assigned counts for that species. (c) Typical AFM-derived height profiles of single, labelled molecules (blue trace), and the accompanying predicted location of nt.BsmAI recognition sites (red bars). (d) Plot of the total counts (log2) determined by AFM analysis of approximately 2000 tagged molecules. The median number of counts per species is 90. The solid line is a linear fit to the abundance of fragments versus length, excluding the outlier ‘a’. The standard error, indicated by the dashed lines on the plot, is ±15 counts (0.28 log2). This corresponds to a median estimated coefficient of variation (CV) of approximately 17%.
We recorded a median of 90 counts per species, and individual members of the mixture were correctly quantified within the range of log2 typically demanded by gene-expression studies (figure 3d). There is a clear inverse relationship between counts per species and species length, a behaviour consistent with the known adsorption kinetics of DNA on derivatized mica [11]. In the size range most typical of mRNAs/full-length cDNAs, 500–2500 bp, the coefficient of variation (CV) of counts per species is approximately 0.5 log2. Adjusted for surface capture bias, the CV is less than 0.3 log2, or ±15 counts (CV 17%), which is in line with the typical variance for qPCR quantification of 75–100 molecules per species [4]. Note that approximately 60 per cent of the observed variance in counts is owing to stochastic sampling noise. Depending on the stringency parameters used in the matching algorithm, 67–75% of all molecules were uniquely identified. Therefore, one could expect the lower limit of absolute sensitivity to surface adsorbed molecules to be less than 10.
3.3. Identifying transcript isoforms—comparison with direct single-molecule sequencing
We considered the efficiency with which one could use our method to uniquely identify transcript isoforms—alternatively spliced mRNAs and transcripts from evolutionarily related gene families—which share sequence homology and thus are hard to differentiate using hybridization probes, microarrays or short-read sequencing. As a test case, we considered transcript variants from the ABC gene family, a highly homologous family of genes encoding multi-subunit membrane transporter proteins; it contains 81 members, 54 of which are variants. Among the members of this family include the cystic fibrosis transmembrane conductance regulator gene (CFTR), which in mutant form is responsible for cystic fibrosis, and MDR, MRP1 and MXR, a group of proteins that confer multi-drug resistance when overexpressed.
For comparison, we have conducted a similar analysis of a simulated single molecule base-by-base sequencing experiment, using the sequencing method proposed by Pushkarev et al. [12]. We have chosen this technology for comparison because it is by far the most mature and well-published alternative unamplified, small sample transcript profiling method which does not rely on species-specific oligonucleotide probes. It is also the only one of the single molecule sequencing approaches to have been demonstrated to be able to directly sequence unamplified cDNA from relatively low abundance samples (approx. 1000 cells) [13].
Figure 4 shows a schematic of the simulated experiment using the AFM method. We generated 100 hypothetical cDNA molecules originating from each of the 81 ABC transcripts. Each hypothetical cDNA was ‘corrupted’ using a stochastic model that follows experimental and measurement errors: 5′ truncation owing to incomplete reverse transcription, incomplete nick site labelling, inaccurate label positioning and spurious false labelling. In particular, each simulated cDNA molecule was derived from its hypothetical mRNA while truncating 0–20% (uniformly distributed) of length from the 5′ end simulating less than full-length cDNA synthesis. We assumed that site-labelling efficiency is 80 per cent, false labels occur in every three of 100 molecules and site position error owing to imaging varies in the range of ±0.5–2% (normally distributed). Each simulated cDNA molecule was compared with 29 563 human mRNA transcripts from the NCBI RefSeq database, and scored pairwise using the alignment procedure described in §2. We quantitatively evaluated the matching performance using ROC analysis. ROC analysis is a common method for quantifying the tradeoff between sensitivity and specificity of discrimination methods or diagnostic tests across a series of sensitivity thresholds. The results of the ROC analyses are typically displayed as a two-dimensional plot of the true positives versus false positives achieved by the method under study, for any one sensitivity threshold. For the ROC analysis, we define an alignment as a true positive if the simulated molecule matches with its corresponding hypothesis molecule (i.e. yields the highest alignment score among the population) and the alignment score is higher than the given threshold; otherwise, the alignment is regarded as a false positive. By varying the alignment score threshold, we obtained the ROC curve of each transcript in the ABC gene family by counting the number of true and false positives out of 100 simulated molecules.
Figure 4.

Schematic of simulated experiment distinguishing 81 individual transcripts from the ATP-binding cassette (ABC) superfamily from a background of 30 000 alternative human transcripts. For each ABC transcript, 100 hypothetical cDNA molecules were generated. Each hypothetical cDNA was ‘corrupted’ using a stochastic model that follows experimental and measurement errors: 5′ truncation owing to incomplete reverse transcription, incomplete nick site labelling, inaccurate label positioning and spurious false labelling. Each simulated cDNA molecule was compared with 29 563 human mRNA transcripts from the National Center for Biotechnology Information (NCBI) Reference Sequence (RefSeq) database, and scored pairwise for alignment quality.
For the single-molecule sequencing approach, the simulation schema was identical to that described in figure 4, with the exception that simulated short reads, generated from random locations within each cDNA, replace simulated nt.BsmAI sparse tag patterns. We employed the read length distribution present in Pushkarev [12], and applied errors of deletions 3 per cent, insertions 1 per cent and substitutions 0.5 per cent, to simulate 100 short-reads for each of the 81 ABC genes. These 8100 simulated short-reads are aligned with all the 29 563 hypothetical background transcripts in the database using the Smith–Waterman-based alignment algorithm described by Lipson et al. [7] (see §2) and the ROC analysis was conducted as described above.
Figure 5 compares the ROC results yielded by both approaches. To better illustrate the difference in performance, we have divided the genes into two sets: transcript variants and non-variants. In figure 5a, the successful rate of the single molecule sequencing method in identifying 27 non-variants was about 55 per cent owing to the fact that only reads greater than or equal to 24 bp match the transcript sequences uniquely. On the contrary, the AFM approach obtained a 65–90% successful rate depending on label site positioning error. Increasing the site position error from 0.5 to 2 per cent would increase the probability of faulty alignment and, thus, the number of false positives. In figure 5b, owing to the high similarity of subsequences among transcript isoforms, the single molecule sequencing approach fails to uniquely identify most variants in the ABC family. The AFM approach reports about a 50–68% successful rate in uniquely distinguishing a transcript variant.
Figure 5.

Receiver-operating characteristic (ROC) analysis of matching 100 simulated transcripts from each member of the ABC gene family using either topographic labels, as determined by AFM, or single molecule tag sequencing. Separate ROC curves are shown for a range of label position errors, from 0.5 to 2.0%. Results from single molecule sequencing are shown using all simulated reads, and reads greater than 24 nucleotides in length. (a) Results for transcripts with only one variant (27 species). (b) Results for transcripts with two or more variants (54 species).
3.4. Simulation of full transcriptomic profiling of single cells
ROC analysis demonstrates superior performance of topographic labelling versus single molecule short-read sequencing. It is true, however, that expression levels of the same gene can vary greatly between samples in some cases, and that the quantities of potential interfering transcripts (false positives) in the same sample can also vary by orders of magnitude.
To address this question further, we conducted an additional simulation of two full single-cell transcriptomic profiles and assessed the ability of the topographic labelling scheme to accurately determine the relative changes in transcript abundance. The measured abundances of roughly 9000 transcripts from two representative human samples, Stratagene UHRR and Ambion HBRR, were obtained from the NCBI GEO database. These two samples have been extensively profiled with various microarray and PCR platforms as part of the ongoing MAQC project [4]. A single cell's worth of mRNA (roughly 1 500 000 molecules) from each sample type were generated, with the abundances of each individual species taken from the MAQC data and normalized to the abundance of RNA polymerase II gene POLR2A.
Eight thousand seven hundred species were present in both the UHRR and HBRR samples. After matching the simulated transcripts to the RefSeq database, 5600 species were identified with high confidence. Roughly 4500 species were detected with counts above a hypothetical limit of detection of two background transcripts. The fold-change in transcript abundance of the HBRR sample versus the UHRR sample is plotted in figure 6a. On the x-axis is the actual log2 change in transcript abundance used in the simulation, and on the y-axis is the measured abundance recovered after matching the simulated transcripts to the RefSeq database. The data are linear (slope = 0.98, r2 = 0.91) across the entire fold-change range of −6 log2 to +8 log2. The performance of topographic labelling compares favourably with that obtained by the MAQC study for the same samples between replicates of RT–PCR and StartPCR, for example (slope = 0.78, r2 = 0.81) [4]. Twenty-four distinct ABC isoforms were present in both samples (all were detected), and the measured fold-change for those transcripts is plotted separately in figure 6b, for clarity. Here, the fold change is well preserved even accounting for the potential interfering effects of thousands of alternative transcripts.
Figure 6.

Correlation of actual versus predicted fold change between the Human Brain (HBRR) versus Universal Reference (UHRR) samples as predicted by simulation. Fold changes (log2) for each gene common between the two samples were subjected to bivariate analysis. (a) All genes that were detected in both samples (n = 4454; slope = 0.98, r2 = 0.91). (b) The 24 ABC transcripts present in both samples (all were detected) were plotted separately for clarity.
4. Discussion
Our results address several critical issues with regard to the potential effectiveness of this ‘self-labelling’ strategy for identifying cDNA transcript abundance. (i) The ability to distinguish transcript species in a mixture is a strong function of (a) label decoration efficiency and (b) accurate measurement of label site position within the molecule. Our experiments establish both (a) and (b) in the context of the nick-labelling chemistry. We have carefully modelled the label positioning error to show that the variance is a linear function of label-to-label distance, plus a small constant term. (ii) In addition to the label positioning error, our simulation explicitly addresses the likelihood that sample preparation, labelling efficiency and measurement accuracy will be imperfect in practice. It included the stochastic effects of incomplete cDNA synthesis, incomplete label site decoration and spurious false decoration, using parameters derived from experiment. The results confirm our earlier analysis that a minimum level of label efficiency and positional measurement accuracy are required in order to resolve many species in a complex mixture. (iii) Finally, the potential effectiveness of this method to distinguish transcript isoforms is one of its primary strengths. This advantage stems from the fact that rather than sampling the molecule in one location, as in the case of probe hybridization or ‘tag’ sequencing, the topographic labels are distributed along the entire molecule length and precise measurement of their spacing reveals alternative exon splicing in many cases. Answering the question of whether the experimentally achievable label efficiencies and positional accuracies will allow isoform discrimination was a key motivation for simulating experiments with the highly isomorphic ABC gene family. The estimated success of this approach for this ‘hard case’ strongly suggests that many human transcripts will be similarly distinguishable.
The engineering details of cost and throughput are beyond the scope of this manuscript, however we note that automated sample-handling and image analysis can be easily implemented using standard methods, as we and others have shown previously [10,14], and that AFM technology has progressed to the point that image capture rates can approach that of optical microscopy [15–19], which would allow deep and sensitive sampling of a wide range of cDNA samples in many practical applications (see the electronic supplementary material).
Like all transcription profiling methods relying on cDNA, which includes qPCR, amplified microarrays and direct sequencing, this AFM method is subject to biases of the reverse transcription process. Molecules shorter than approximately 100 nm (300 bp) will be challenging to identify using a single nicking enzyme label because of the few sites available on average and the minimum label positioning error, which becomes limiting for very short molecules. The use of the proposed method will be limited by how efficiently the transcriptomes of a small number of cells can be isolated, converted to cDNA, labelled and captured on the surface for AFM imaging. These issues are beyond the scope of the present work and need to be addressed in future studies. The subject of efficiently purifying cDNA from small samples, down to single cells, is currently an active area of research by many groups (for example, [20]). The simulation presented here does not include the effects of ‘confounding’ background molecules such as genomic DNA fragments that would be confused with cDNA or inadvertently reverse-transcribed ribosomal RNAs (rRNAs). However, we note that both genomic DNA and rRNAs can be greatly reduced or eliminated using DNase and RNase at the appropriate steps in the cDNA synthesis procedure.
From a methodological perspective, this study is, to our knowledge, the first time sequence mapping using nicking restriction enzymes has been applied to short molecules in any context, and the first time it has been used to detect individual nucleic acids in a complex mixture. Previous studies [21,22] have shown that sequence-specific topographic labelling of DNA is possible, but the labelling chemistries used could not produce tags with the needed frequency and fidelity for recognizing large numbers of cDNA-sized nucleic acid species in a mixture, as do the nicking enzymes used here. Nicking enzymes have been used previously with fluorescent labelling to map sequences on single DNA molecules using optical microscopy [23,24]. However, because of resolution limitations, only rare cutting nicking enzymes could be used, so that the average distance between label sites is large (e.g. 7-cutter nb.BbvCI, average spacing 16 kb or 5.4 μm), and mapping was necessarily confined exclusively to long molecules, such as 48 kb (approx. 16 μm) lambda phage genomic DNA, which are approximately 10–100 times longer than a typical cDNA. Furthermore, to achieve the required accuracy and precision, these mapping studies average results from a large ensemble of identical molecules. By contrast, here we have demonstrated high accuracy and precision in localizing many individual, distinct labels on many individual single molecules.
5. Conclusions
In this report, we address specifics of topographic labelling chemistry and investigate the effect of experimental variables on transcript isoform detectability through computer simulations. As a demonstration, we accurately measured the abundance of individual cDNA-sized DNA species from a complex, 15-species mixture. We then extrapolated those results, via computer simulation with realistic parameters, to the hypothetical case of distinguishing 81 individual transcripts from the highly isomorphic ABC superfamily from a background of 30 000 alternative human transcripts. This simulation indicated that topographic labelling identified the ABC transcripts accurately, including transcript isoforms which would be challenging to differentiate using traditional methods. We conducted an additional simulation of two full single-cell transcriptomic profiles and assessed the ability of the topographic labelling scheme to accurately determine the relative changes in transcript abundance. We found that this approach can distinguish transcript species abundance changes accurately in most cases, including transcript isoforms which would be challenging to quantitate with traditional methods. Taken together, these two simulations show that transcripts from the ABC gene family can be identified with high sensitivity and specificity, even in the background of tens of thousands of alternate transcripts.
A key advantage of the topographic labelling approach is that the labelling chemistry is simple, highly parallel (single label used for all molecules) and no amplification is required. Nicking enzymes retain the main advantages of regular restriction enzymes: extreme specificity and low cost. In theory, this labelling process can be conducted with multiple nicking restriction endonucleases, applied in a serial fashion and labelled with different chemical moieties to identify several different sequence motifs on a single molecule simultaneously, with the AFM.
Acknowledgements
Funding for this work was provided by National Institutes of Health grant R01GM094388 to J.R. and R21GM080999 to J.K.G.
References
- 1.Burbulis I., Yamaguchi K., Gordon A., Carlson R., Brent R. 2005. Using protein–DNA chimeras to detect and count small numbers of molecules. Nat. Methods 2, 31–37 10.1038/nmeth729 (doi:10.1038/nmeth729) [DOI] [PubMed] [Google Scholar]
- 2.Nygaard V., Hovig E. 2009. Methods for quantitation of gene expression. Front. Biosci. 14, 552–569 10.2741/3262 (doi:10.2741/3262) [DOI] [PubMed] [Google Scholar]
- 3.Nygaard V., Holden M., Loland A., Langaas M., Myklebost O., Hovig E. 2005. Limitations of mRNA amplification from small-size cell samples. BMC Genom. 6, 147. 10.1186/1471-2164-6-147 (doi:10.1186/1471-2164-6-147) [DOI] [PMC free article] [PubMed] [Google Scholar]
- 4.Shi L. M., et al. 2006. The MicroArray Quality Control (MAQC) project shows inter- and intraplatform reproducibility of gene expression measurements. Nat. Biotechnol. 24, 1151–1161 10.1038/nbt1239 (doi:10.1038/nbt1239) [DOI] [PMC free article] [PubMed] [Google Scholar]
- 5.Bishop J. O., Morton J. G., Rosbash M., Richards M. 1974. Three abundance classes in HeLa-cell messenger-RNA. Nature 250, 199–204 10.1038/250199a0 (doi:10.1038/250199a0) [DOI] [PubMed] [Google Scholar]
- 6.Hastie N. D., Bishop J. O. 1976. Expression of three abundance classes of messenger-RNA in mouse tissues. Cell 9, 761–774 10.1016/0092-8674(76)90139-2 (doi:10.1016/0092-8674(76)90139-2) [DOI] [PubMed] [Google Scholar]
- 7.Lipson D., et al. 2009. Quantification of the yeast transcriptome by single-molecule sequencing. Nat. Biotechnol. 27, 652–658 10.1038/nbt.1551 (doi:10.1038/nbt.1551) [DOI] [PubMed] [Google Scholar]
- 8.Ficarra E., Benini L., Macii E., Zuccheri G. 2005. Automated DNA fragments recognition and sizing through AFM image processing. IEEE Trans. Inform. Technol. Biomed. 9, 508–517 10.1109/TITB.2005.855546 (doi:10.1109/TITB.2005.855546) [DOI] [PubMed] [Google Scholar]
- 9.Sanchez-Sevilla A., Thimonier J., Marilley M., Rocca-Serra J., Barbet J. 2002. Accuracy of AFM measurements of the contour length of DNA fragments adsorbed on mica in air and in aqueous buffer. Ultramicroscopy 92, 151–158 10.1016/S0304-3991(02)00128-6 (doi:10.1016/S0304-3991(02)00128-6) [DOI] [PubMed] [Google Scholar]
- 10.Fang Y., Spisz T. S., Wiltshire T., D'Costa N. P., Bankman I. N., Reeves R. H., Hoh J. H. 1998. Solid-state DNA sizing by atomic force microscopy. Anal. Chem. 70, 2123–2129 10.1021/ac971187o (doi:10.1021/ac971187o) [DOI] [PubMed] [Google Scholar]
- 11.Hansma H. G., Laney D. E. 1996. DNA binding to mica correlates with cationic radius: assay by atomic force microscopy. Biophys. J. 70, 1933–1939 10.1016/S0006-3495(96)79757-6 (doi:10.1016/S0006-3495(96)79757-6) [DOI] [PMC free article] [PubMed] [Google Scholar]
- 12.Pushkarev D., Neff N. F., Quake S. R. 2009. Single-molecule sequencing of an individual human genome. Nat. Biotechnol. 27, 847–850 10.1038/nbt.1561 (doi:10.1038/nbt.1561) [DOI] [PMC free article] [PubMed] [Google Scholar]
- 13.Ozsolak F., Ting D. T., Wittner B. S., Brannigan B. W., Paul S., Bardeesy N,, Ramaswamy S., Milos P. M., Haber, D. A. 2010. Amplification-free digital gene expression profiling from minute cell quantities. Nat. Methods 7, 619–621 10.1038/nmeth.1480 (doi:10.1038/nmeth.1480) [DOI] [PMC free article] [PubMed] [Google Scholar]
- 14.Jing J. P., et al. 1998. Automated high resolution optical mapping using arrayed, fluid-fixed DNA molecules. Proc. Natl Acad. Sci. USA 95, 8046–8051 10.1073/pnas.95.14.8046 (doi:10.1073/pnas.95.14.8046) [DOI] [PMC free article] [PubMed] [Google Scholar]
- 15.Kodera N., Yamamoto D., Ishikawa R., Ando T. 2011. Video imaging of walking myosin V by high-speed atomic force microscopy. Nature 468, 72–76 10.1038/nature09450 (doi:10.1038/nature09450) [DOI] [PubMed] [Google Scholar]
- 16.Carberry D. M., Picco L., Dunton P. G., Miles M. J. 2009. Mapping real-time images of high-speed AFM using multitouch control. Nanotechnology 20, 434018. 10.1088/0957-4484/20/43/434018 (doi:10.1088/0957-4484/20/43/434018) [DOI] [PubMed] [Google Scholar]
- 17.Picco L. M., Dunton P. G., Ulcinas A., Engledew D. J., Hoshi O., Ushiki T., Miles M. J. 2008. High-speed AFM of human chromosomes in liquid. Nanotechnology 19, 384018. 10.1088/0957-4484/19/38/384018 (doi:10.1088/0957-4484/19/38/384018) [DOI] [PubMed] [Google Scholar]
- 18.Hansma P. K., Schitter G., Fantner G. E., Prater C. 2006. Applied physics: high-speed atomic force microscopy. Science 314, 601–602 10.1126/science.1133497 (doi:10.1126/science.1133497) [DOI] [PubMed] [Google Scholar]
- 19.Humphris A. D. L., Miles M. J., Hobbs J. K. 2005. A mechanical microscope: high-speed atomic force microscopy. Appl. Phys. Lett. 86, 034106. 10.1063/1.1855407 (doi:10.1063/1.1855407) [DOI] [Google Scholar]
- 20.Bontoux N., Dauphinot L., Vitalis T., Studer V., Chen Y., Rossier J., Potier M. C. 2008. Integrating whole transcriptome assays on a lab-on-a-chip for single cell gene profiling. Lab Chip. 8, 443–450 10.1039/b716543a (doi:10.1039/b716543a) [DOI] [PubMed] [Google Scholar]
- 21.Allison D. P., et al. 1997. Mapping individual cosmid DNAs by direct AFM imaging. Genomics 41, 379–384 10.1006/geno.1997.4686 (doi:10.1006/geno.1997.4686) [DOI] [PubMed] [Google Scholar]
- 22.Woolley A. T., Guillemette C., Cheung C. L., Housman D. E., Lieber C. M. 2000. Direct haplotyping of kilobase-size DNA using carbon nanotube probes. Nat. Biotechnol. 18, 760–763 10.1038/77760 (doi:10.1038/77760) [DOI] [PubMed] [Google Scholar]
- 23.Xiao M., et al. 2007. Rapid DNA mapping by fluorescent single molecule detection. Nucl. Acids Res. 35, e16. 10.1093/nar/gkl1044 (doi:10.1093/nar/gkl1044) [DOI] [PMC free article] [PubMed] [Google Scholar]
- 24.Das S. K., Austin M. D., Akana M. C., Deshpande P., Cao H., Xiao M. 2010. Single molecule linear analysis of DNA in nano-channel labeled with sequence specific fluorescent probes. Nucleic Acids Res. 38, e177. 10.1093/nar/gkq673 (doi:10.1093/nar/gkq673) [DOI] [PMC free article] [PubMed] [Google Scholar]