Abstract
The manner in which the superficial retinal vascular plexus (RVP) develops in neonatal wild-type mice is relatively well documented and poses an interesting challenge to the mathematical modelling community. Prior to birth, astrocyte sprouting and proliferation begin around the edge of the optic nerve head, and subsequent astrocyte migration in response to a chemotactic gradient of platelet-derived growth factor (PDGF)-A results in the formation of a dense scaffold on the surface of the inner retina. Astrocytes express a variety of chemotactic and haptotactic proteins that subsequently induce endothelial cell sprouting and modulate growth of the RVP. An experimentally informed, two-dimensional hybrid partial differential equation-discrete model is derived to track the outward migration of individual astrocyte and endothelial tip cells in response to the appropriate biochemical cues. Blood perfusion is included throughout the development of the plexus, and the evolving retinal trees are allowed to adapt and remodel by means of several biological stimuli. The resulting wild-type in silico RVP structures are compared with corresponding experimental whole mounts taken at various stages of development, and agreement between the respective vascular morphologies is found to be excellent. Subsequent numerical predictions help elucidate some of the key biological processes underlying retinal development and demonstrate the potential of the virtual retina for the investigation of various vascular-related diseases of the eye.
Keywords: retinopathy, angiogenesis, blood flow, vascular remodelling
1. Introduction
Embryogenesis, organ growth and wound healing are characterized by the development of functional vascular networks that are adapted to serve the metabolic requirements of the tissue, and the way in which such networks evolve in both time and space is an important regulator of tissue function. Formation of the retinal vasculature occurs predominantly by angiogenesis and, in the case of the post-natal mouse eye, the means by which the superficial retinal vascular plexus (RVP) develops are relatively well understood [1,2]. Directed movement of endothelial cells (ECs) is coupled to the migration of an astrocytic network that travels from the optic nerve region towards the periphery of the retina: a process that begins 4 to 5 days prior to the emergence of the first angiogenic sprouts. Astrocytes express the platelet-derived growth factor (PDGF)-A receptor (PDGFR-α), and are induced to migrate in response to critically regulated levels of PDGF-A produced by retinal ganglion cells (RGCs) [3,4]. Transgenic over-expression of PDGF-A from either RGCs [4] or astrocytes [5] reduces the extent of astrocyte migration supporting the hypothesis that astrocyte migration is dependent on a gradient of PDGF-A. Poorly oxygenated astrocytes are known to produce vascular endothelial growth factor (VEGF)-A, and this induces migration of ECs, leading to the expansion of a nascent vascular network over the inner surface of the retina. EC sprouting from the ophthalmic vein begins around the day of birth, and a dense plexus arrives at the retinal periphery by post-natal day 8 (P8). Blood flow in the developing network delivers oxygen to the migrating astrocytes, causing them to progressively downregulate VEGF-A expression [5,6]. In addition to its role as a chemotactic agent, VEGF-A also affects EC viability [5], and any reduction in VEGF-A concentration consequently leads to a reduction in EC numbers—this manifests itself as an outward wave of vascular pruning. Extensive pruning, predominantly around highly oxygenated arteriolar segments, is a crucial feature of long-term RVP development and maturation.
Although a number of different splice variants of VEGF-A have been identified, we will focus here on the role of the most widely expressed human splice variant, VEGF-A165, and its murine homologue, VEGF-A164, both of which can bind to extracellular matrix (ECM) and diffuse in the extracellular milieu. VEGF-A164 is the major isoform responsible for the formation of the RVP [7,8], and its role has been investigated in a number of studies: intra-ocular injection of VEGF-A sequestering antibodies has been found to inhibit endothelial migration and delay plexus formation [6], as has removal of the VEGF gradient in the retina, via increased expression of VEGF-A in transgenic mouse models [8,9]. Haptotactic factors, expressed on astrocytes, are also known to be important, as inhibition of the ability of ECs to bind fibronectin, via intra-ocular injection of anti-integrin αβ1 antibodies, prevents EC migration [6].
Retinal vascular development is an excellent target for mathematical modelling, with comparisons between experimental and simulated vasculatures posing a rigorous test for in silico studies. Conversely, pathological angiogenesis, which has been extensively explored by the mathematical modelling community in the context of tumours and wounds, often results in highly heterogeneous vasculatures that are more straightforward to reproduce numerically. Such models consider a number of important angiogenic mechanisms, including EC proliferation and migration in response to both diffusible angiogenic factors (chemotaxis) and insoluble ECM molecules (haptotaxis). The processes have primarily been modelled using systems of nonlinear partial differential equations (PDEs) that describe the migration of capillaries from a parent vessel towards a solid tumour [10–12], and a number of PDE systems incorporate a discrete element to model the spatio-temporal progression of individual endothelial tip cells and capillary loop formation [12–15]. A comprehensive overview of this work can be found in the review papers of Mantzaris et al. [16] and Peirce [17]. The inclusion of blood perfusion in growing capillary networks has only been considered fairly recently [18–22], and a review of this work can be found in Chaplain et al. [23]. Models coupling perfused angiogenesis to the growth of the tumour itself have also been reported [24–26]. There have been a number of continuum PDE approaches to modelling wound healing [27–30], but very few attempts to include discrete aspects of the angiogenic response to injury [31].
The growth and differentiation of the mammalian retina occurs in a well-ordered and highly reproducible manner, and the relationship between the developing vasculature, its constituent cell types and the molecular cues that regulate its formation is well recognized [6]. However, there have been few attempts at modelling this fascinating developmental process. Maggelakis & Savakis [32,33] have employed a continuum PDE approach to investigate the interplay between VEGF, oxygen and capillary density in pathological retinal angiogenesis, whereas Liu et al. [34] have used a small digitized network taken from the human retina to predict distributions of flow and oxygen partial pressure. A numerical haemodynamic analysis has recently been reported by Ganesan et al. [35], predicting haematocrit and shear stress distributions in a fully developed adult murine retinal network. However, none of these studies consider retinal development.
As a foundation for modelling the developing murine retina, the authors have recently published a one-dimensional continuum model of the superficial RVP, focusing on the migration of astrocyte and endothelial tip cells [36]—to our knowledge, this represents the first attempt to model vascular plexus formation in the retina during normal physiological development. A more complete hybrid PDE-discrete modelling approach, however, is required to adequately reproduce wild-type retinae and go on to make predictions of RVP development in experimental mouse models where vascular growth is perturbed. The hybrid formulation allows for the tracking of individual cells, visualization of blood vessel topology and remodelling phenomena associated with in vivo retinal perfusion. Note that, subsequent to P8, vertical sprouting from the superficial RVP into the deeper neural retina leads to the formation of two additional interconnected layers. This process is not explicitly considered here, but will be the focus of a future publication.
2. Material and methods
2.1. Murine superficial retinal vascular plexus formation in vivo
Pertinent experimental data were obtained from C57BL/6J mice, which were euthanized and, following enucleation and fixation of the globe, retinal whole mounts prepared as previously described [8]. Prior to euthanasia, some animals were transcardially perfused under terminal anaesthesia with 150 kDa FITC–dextran (Sigma-Aldrich, UK) in order to image flowing microvascular segments at the leading edge of the expanding RVP. All animal experimental procedures conformed to UK Home Office Guidelines. Astrocyte nuclei were detected with the pan-astrocytic antibody rabbit anti-Pax2 (Covance, Leeds, UK) and ECs identified using isolectin-B4 biotin conjugate (Griffonia simplicifolia (GSI-B4); Sigma, Gillingham, UK). Rabbit anti-fibronectin and mouse anti-GFAP-Cy3 conjugate (Sigma) were used to detect the astrocyte network. Streptavidin-conjugated or anti-rabbit Alexa-Fluor 488 and 633 secondary antibodies (Invitrogen, Paisley, UK) were used as appropriate fluorophores. Images were captured using a SP5 confocal microscope (Leica Microsystems GmbH, Wetzlar, Germany) at a range of objective magnifications.
2.2. Murine superficial retinal vascular plexus formation in silico
Full details of the mathematical modelling approach can be found in the electronic supplementary materials; only the key components and assumptions will be briefly outlined here. The model was informed both from the literature and the experiments described in §2.1—data were collected at various developmental stages, from embryonic day 15.5 (E15.5) to P8. The simulated discrete RVP growth employs an extension of an established hybrid discrete-continuum tumour-induced angiogenesis model [12], whereby discrete astrocyte and endothelial tip cells migrate on a lattice driven by random movement and gradients in the continuum representations of diffusible, soluble chemical factors (chemotaxis) and insoluble ECM components (haptotaxis).
In order to model RVP formation, we consider a system of eight coupled PDEs (see electronic supplementary material, equations (SM1)–(SM8)) that describe the migration of the relevant cell types (astrocytes, ECs), evolution of the associated chemical factors (PDGF-A, VEGF-A) and ECM degradation by astrocyte and endothelial tip cell-derived matrix-degrading enzymes. At E15, astrocyte sprouts around the central optic nerve as well as an RGC-derived gradient of PDGF-A are initialized in the model. The sprouts migrate radially outwards towards the retinal periphery, primarily via a chemotactic response to the PDGF-A, which itself diffuses, decays and is bound by astrocyte tip cells. Initially, in the absence of a functional vasculature, all astrocytes produce VEGF-A and, by P0, via a combination of diffusion and decay, a gradient emerges that allows the EC sprouts at the optic nerve head to migrate outwards over the underlying astrocyte scaffold. Thus, the migration of the nascent capillary structures is strongly coupled to the behaviour of the underlying astrocytes. This interaction is further reinforced through a feedback mechanism, whereby VEGF-A expression is downregulated in astrocytes that are well served by nearby functioning capillary structures. Note that this, in turn, effectively couples endothelial viability to local oxygen tension. In addition, two matrix-degrading enzymes are assumed to be produced by the astrocytes and ECs, creating gradients in the two bound matrix components and promoting migration of each respective cell type. Tip cells of each type also have the ability to branch—the probability of which is enhanced by increasing local growth factor concentration—encouraging the formation of anastomoses by endothelial tip cells that encounter either one another or pre-existing capillaries.
Anastomosis formation is crucial in allowing blood flow to occur in the nascent vascular networks. Perfusion takes place on the superficial plexus via interconnections that link higher pressure arteriolar structures to lower pressure venous vessels and it is extremely important to construct inlet and outlet parent vessels that isolate the different pressure systems prior to connection on the retinal surface. To this end, a three-layer model was designed, with arteriolar and venular parent vessel manifolds positioned in separate layers below the retinal plexus. Alternating arteriolar and venular EC sprouts around the optic nerve are connected to their appropriate parent manifold beneath the RVP (figure 1; see electronic supplementary material for further details). Erythrocytes are fed into each arteriolar inlet at a fixed haematocrit, and a standard network modelling approach is used to calculate the nodal pressure distribution and capillary flows (see electronic supplementary material, equation (SM11)). The empirical laws derived by Pries et al. [37–40] inform the flow model throughout: our flow calculation incorporates both an empirical in vivo viscosity law (see electronic supplementary material, equation (SM12)) and a generalized model of phase separation at bifurcations (see electronic supplementary material, equations (SM13)–(SM16)), whereas a dynamic feedback loop is also introduced by allowing angioadaptation in response to a number of flow-related stimuli (see electronic supplementary material, equations (SM17)–(SM24)).
Figure 1.
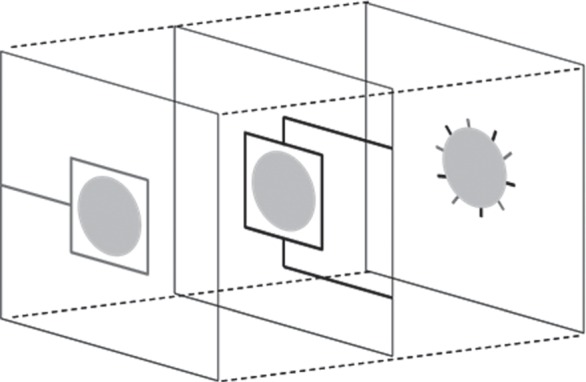
Initial conditions for all simulations showing 10 endothelial cells sprouts evenly spaced around the optic nerve and the set up of underlying parent vessel manifolds. Arterial segments are identified in black, whereas venous segments are grey.
The resultant distribution of vessel radii, flow and haematocrit all plays vital roles in determining oxygen delivery from the vasculature to the surrounding tissue. Blood-borne erythrocytes are assumed to dominate oxygen delivery, carrying it into the domain from the optic nerve inlets at a fixed (haematocrit-dependent) concentration. The oxygen is convected downstream and is partitioned at bifurcations in proportion to daughter vessel erythrocyte concentrations. Throughout the simulation, oxygen is transported from each perfused capillary element at a rate governed by the vessel surface area and permeability. Upon entering the surrounding tissue, the oxygen diffuses and is consumed at a fixed rate (see electronic supplementary material, equations (SM25) and (SM26)). For realistic parameter values, the oxygen delivery model is seen to produce arteriolar–venular gradients in oxygen tension that prove to be crucial to the development of the final component of the mathematical model: capillary pruning. The mathematical approach adopted here affords a detailed description of the spatial retinal oxygen concentration to be generated at any point in time—a key feature of RVP development that is highly dependent upon the evolving vascular architecture. Local oxygen tensions have a profound impact on the spatial distribution of capillary remodelling, and the model uses this as a criterion for pruning. This is biologically consistent, because astrocyte expression of VEGF-A—an important EC survival factor—is downregulated in well-oxygenated regions [5]. Hence, it is apparent that the migration model (e.g. vascular plexus architecture), flow model (e.g. haematocrit distribution) and oxygen transport model (e.g. oxygen diffusibility) all have a direct impact on the pruning process (see §5 of electronic supplementary materials for full details of how the pruning process has been implemented).
In summary, the simulation algorithm is briefly outlined as follows:
At E15, begin simulating the migration of astrocytes, and the evolution of the PDGF-A and VEGF-A concentration profiles.
At P0, initiate the endothelial sprouts. Simulate EC migration, concurrently with the components in step 1, over a growth interval (typically 30 h—see §4.1).
At the end of a growth interval, simulate blood flow in the current vasculature until the network approaches steady-state. This includes the update of the haematocrit and vessel radii at each time step (input haematocrit = 0.45).
Simulate the delivery of oxygen from the vasculature to the tissue using the final distributions of flow and radii obtained in step 3.
Prune the capillary network in the light of the relevant criteria.
Resume cell migration and growth factor evolution for the next growth interval.
Repeat steps 3–6 until the end of the simulation is reached.
3. Results
3.1. Experimental observations in neonatal wild-type (C57Bl/6J) mice
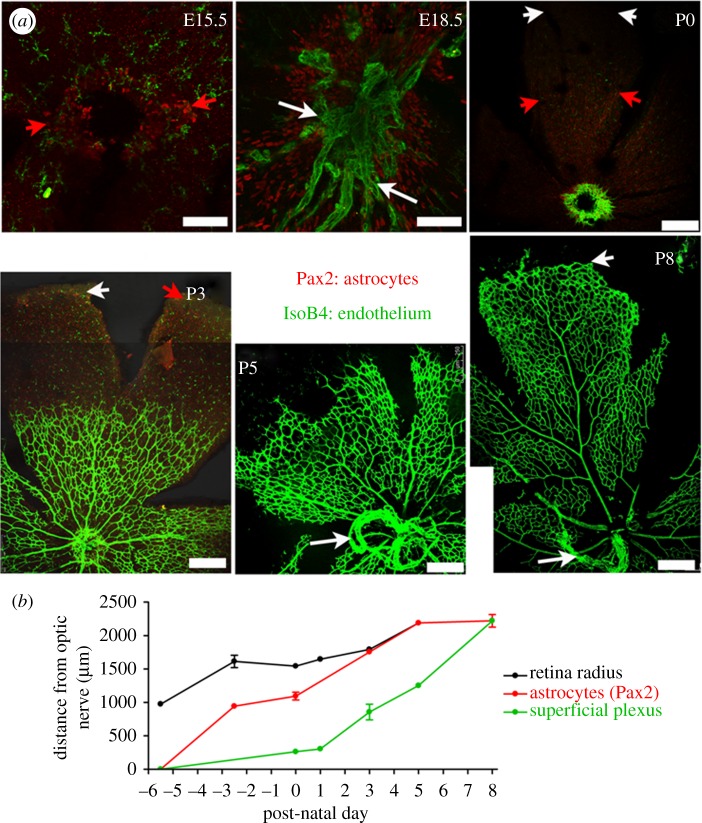
A number of different aspects of RVP development are highlighted in figure 2: figure 2a shows retinal whole mounts of superficial RVP development from P0 to P8, whereas figure 2b demonstrates that significant retinal growth occurs throughout both astrocyte migration and endothelial plexus formation. The radial extent of the retina (measured as the distance from the centre of the optic nerve head to the retinal edge) approximately doubles between E15.5 and P5 (mean ± s.e.m. of 975.6 ± 6.5 µm and 2189.1 ± 13.1 µm, respectively), and Pax2 immunoreactive astrocytes are observed within the border of the optic nerve head at E15.5. By E18.5, a dense network of Pax2 positive nuclei is observed around the optic nerve, extending halfway across the retinal surface (figure 2a)—astrocytes reach the retinal periphery at P3. Formation of the superficial RVP begins at P0, when a dense network of GSI-B4 immunoreactive ECs can be detected surrounding the rim of the optic nerve (figure 2a). The mean ± s.e.m. number of angiogenic sprouts at P0 was quantified as 68 ± 7 (n = 5). The EC plexus spreads across the retinal surface, and a distinct vessel plexus architecture becomes established by P3: this reaches approximately halfway across the retina by P5 and the periphery by P8. At P3, the superficial RVP is characterized by a dense, highly branched vessel network. Differentiated arterioles and venules can be seen at P3; and by P5, a stable pattern of five pairs of alternating arterioles and venules has emerged. The dense plexus is subject to a wave of perfusion-related pruning and remodelling, which begins near the optic nerve head around P3, and extends radially outwards as the immature RVP approaches the retinal periphery. At P5, a capillary free zone is evident near the optic nerve that extends along developing arterioles: venules, in contrast, are not extensively pruned. By P8, pruning of vessels is conspicuous around primary arterioles across approximately 70 per cent of the retinal radius, with clear vessel free zones surrounding secondary arterioles (figure 2a).
Figure 2.
Astrocyte and endothelial migration occur in parallel to retinal growth during formation of the superficial RVP. (a) Extent of astrocyte (Pax2, red) and endothelial cells (isolectin-B4, green) migration in confocal images of immunohistochemically stained murine retinal whole mounts at various embryonic and post-natal stages (day of birth P0 = E21.5). Note the retina has been cut and flattened into a petal-like shape. Images at E15.5 and E18.5 are high-power magnifications of the optic nerve head region, from which astrocyte and endothelial cells migration occur (Scale bar, 75 µm). The P0–P8 images show a single ‘leaf’ of the flattened retina with the optic nerve head at the bottom of each (Scale bar, 120 µm). White arrowheads at P0, P3 and P8 indicate the edge of the retina; red arrowheads at E15.5, P0 and P3 indicate the extent of astrocyte migration; white arrows at E18.5, P5 and P8 indicate remnants of the embryonic hyaloid blood vessels. (b) Quantification of retinal radius, and extent of astrocyte and endothelial migration during formation of the superficial RVP in neonatal mice. Distances are measured from the centre of the optic nerve; mean ± s.e.m., n ≥ 4 at each time point.
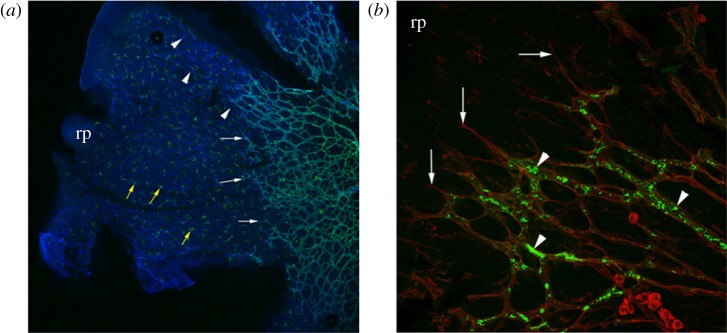
Further experimental micrographs highlight the most important interactions between astrocytes and ECs during RVP formation. Although no fibronectin immunoreactivity is detected on the retinal surface at E15.5 (prior to astrocyte migration), the pattern of fibronectin immunoreactivity is seen to closely match the pattern of Pax2 immunoreactivity at both E18.5 and P3. Moreover, endothelial tip cells are seen to extend slender filopodial processes along the fibronectin networks produced by astrocytes (figure 3a). To investigate whether flow-mediated remodelling could play a significant role in the pruning of the plexus during the earliest stages of RVP development, we determined the extent of blood flow in the plexus at P3. Perfused vessels were detected up to the leading edge of the plexus, excluding tip cells, implying that even the most immature frontal periphery of the RVP contains flowing vessels (figure 3b).
Figure 3.
Low-power (a) and high-power (b) micrographs of flat mounted, post-natal day 3 mouse retina. (a) Dual-staining with isolectin-B4 (green) and an anti-fibronectin antibody (blue) reveals leading edge endothelial tip cells (white arrows) migrating towards the retinal periphery (rp) guided by underlying fibronectin matrix (arrowheads). Numerous microglial cells, also stained with isolectin-B4, are conspicuous in the avascular region of the retina (yellow arrows). (b) Dual immunolabelling of the leading edge of the vascular plexus with isolectin-B4 (red) and transcardially administered FITC–dextran (green) reveals perfused retinal vascular plexus (arrowheads) segments immediately behind endothelial tip cells (arrows).
3.2. Simulation of retinal vascular plexus development in neonatal wild-type (C57Bl/6J) mice
The results presented in this section comprise a simulation of normal murine (wild-type) RVP development followed by two model sensitivities that illustrate the importance of different aspects of the developmental process. Unless otherwise stated, all of the simulations used the model equations and base case parameters detailed in the electronic supplementary materials. The domain size considered for the computational simulations is a 4.4 × 4.4 mm retinal surface—the maximum murine retinal diameter observed experimentally up to day P20.
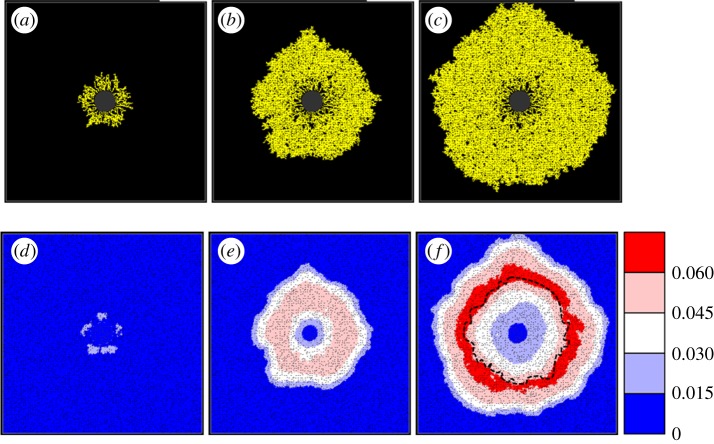
In figures 4 and 5, we present a variety of results from the wild-type simulation illustrating the behaviour of each of the different model components. The progression of the astrocyte network as well as the associated VEGF-A gradients provides an important mechanistic link between the initial stages of retinal development and the later advancement of a nutrient-rich capillary network. It is apparent that the astrocyte front moves rapidly away from the optic nerve head (figure 4a–c) and simultaneous VEGF-A production creates an initial travelling wavefront, with the peak concentration lying behind the migrating astrocyte tip cells (figure 4d,e). EC migration commences at P0, with growth largely driven by the chemotactic response to the evolving VEGF-A gradients. The downregulation of VEGF-A production by astrocytes in proximity to perfused vasculature is crucial in this respect, ensuring that the peak concentration lies in advance of the migrating EC front (figure 4f; note the dotted line indicating the extent of EC migration). In the absence of this coupling, the domain becomes flooded with VEGF-A, and gradients are significantly reduced (results not shown).
Figure 4.
(a–c) Growth of the simulated retinal astrocyte network. (d–f) Simultaneous evolution of the VEGF-A concentration profile. Migration of astrocytes begins at E15—the snapshots shown here correspond to (a,d) E17.1, (b,e) P0.4 and (c,f) P4.0. (f), Dotted line illustrates the extent of endothelial cells migration. All simulated VEGF-A concentrations are as per the colour bar provided.
Figure 5.
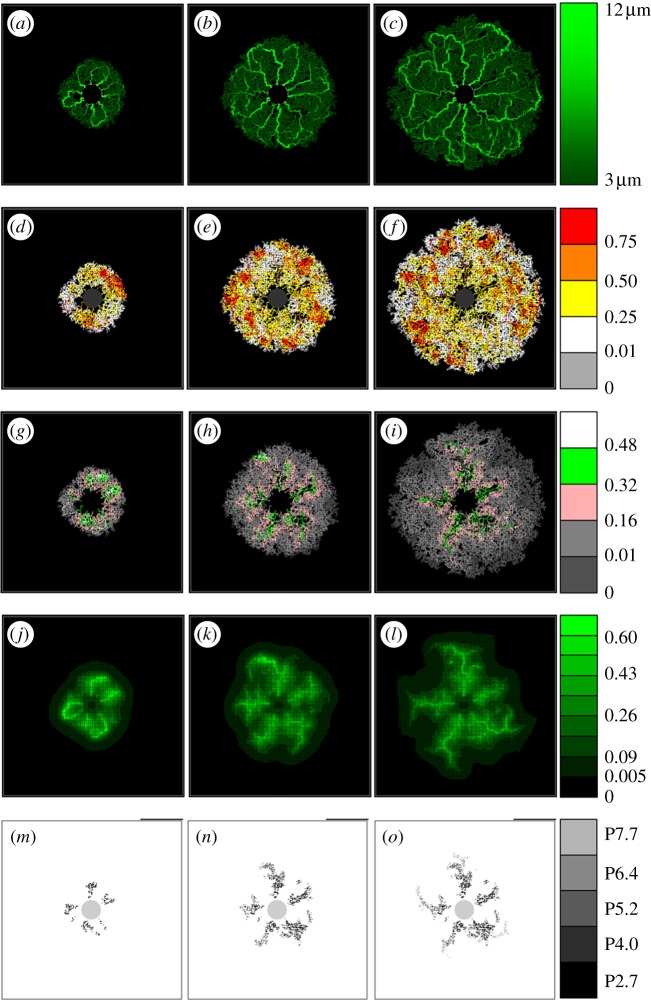
Schematic of a simulated developing RVP showing (a–c) vessel radii, (d–f) haematocrit, (g–i) vessel oxygen concentration, (j–l) tissue oxygen concentration and (m–o) pruned capillary segments (i.e. a graph displaying the position of each pruned vessel segment, with greyscale indicating the time point at which it was removed). Each column corresponds to a particular time point, namely (a–m) P2.7, (b–n) P5.2 and (c–o) P7.7. Images from intermediate days have been omitted.
The simulated retinal vasculature generated from the wild-type model, together with a variety of adjuvant data, is presented in figure 5. Each image highlights the behaviour of a particular model component throughout development: from the commencement of flow at P2.7 (when the EC network was fully connected and of an appreciable size) until the network approaches the domain boundaries at P8. Specifically, figures show the post-flow, steady-state distribution of capillary architecture, haematocrit, vessel oxygen concentration, tissue oxygen concentration and capillary pruning (i.e. a graph displaying the position of each pruned vessel segment, with greyscale indicating the time point at which it was removed). The pruning graph has been included to emphasize the extent of vessel removal, which is less easy to discern in the capillary architecture images themselves. A small sensitivity study determined that perfusion of the capillary bed roughly every 30 h (beyond P2.7) was adequate without compromising the architecture of the final plexus.
After the first period of flow, a structured vasculature begins to emerge from the originally homogeneous capillary bed (figure 5a), with a number of the arterioles forming dilated anastomoses with each of their neighbouring veins. A striking feature of the haematocrit distribution at this early stage is its large degree of spatial heterogeneity (figure 5d), induced primarily by phase separation at bifurcations. Furthermore, we note the presence of a number of vessel segments characterized by haematocrits exceeding 0.75, i.e. more than 66 per cent higher than the input haematocrit. We observe only a small degree of oxygen-induced vascular pruning at this stage, accentuating the presence of the small dilated arteriolar–venular loops. A spatial map highlighting all of the capillary segments pruned by day P2.7 is shown in figure 5m.
For brevity, we exclude intermediate days and proceed to consider the retinal plexus at P5.2 (after the third cycle of perfusion). The dynamic nature of capillary plexus development can be immediately inferred from a comparison between figure 5a and b. The small dilated loops prevalent near the optic nerve head at earlier times are remodelled as the vascular bed grows: the sensitivity of the angioadaptation stimuli to changes in the network architecture is emphasized by the emergence of larger arteriolar–venular loops that serve to transport blood efficiently towards peripheral regions of the domain. An interesting consequence of this is that the radii of arteriolar inlet segments evolve to be consistently smaller than their venous outlet counterparts (figure 5b; see also Ganesan et al. [35]). Unlike P2.7, the haematocrit (figure 5e) is not as strongly correlated to the vessel oxygen profile (figure 5h), with many of the high haematocrit regions displaying low vessel oxygen concentrations. Owing to the increased plexus size, and the limited capacity of narrow capillaries to supply oxygen to equatorial regions, much of the oxygen transported transmurally from vessel to tissue occurs proximal to the arteriolar sources. Furthermore, it is clear from the tissue oxygen profile (figure 5k) that the majority of oxygen is supplied by the dilated anastomoses, with oxygen tensions dipping significantly as the venous sinks are approached. Consequently, a large degree of pruning of small capillaries can now be seen to have taken place in the immediate vicinity of the main arterioles (figure 5n).
The final time period covered by the base case simulation ends at P7.7, and corresponding results demonstrate the significant role played by flow and vascular remodelling in determining the final form of the retinal vasculature (figure 5c). The removal of many of the smaller capillaries on either side of the main arteriolar vessels increases their prominence as major flow pathways, ensuring that they are retained as the network continues to expand towards the edge of the RGC plexus. The emergence of this highly structured network architecture has a large impact on the distribution of retinal haematocrit (figure 5f). The regions of greatest haematocrit are found in the vicinity of the dilated arteriolar–venular loops, whereas lower haematocrits characterize regions lying between the main vessels. The haematocrit increases downstream of each bifurcation on the arteriolar side, peaking at the retinal equator before gradually decreasing towards the outlet veins. We note the correlation with the work of Ganesan et al. [35], who observed similar behaviour, although in a sparser, three-layered adult murine retinal vascular network. This phenomenon also has an interesting impact upon the delivery of oxygen from the vasculature to the tissue. Because the oxygen is fed into the network at a constant concentration and leaves the vessels transmurally, the absence of phase separation would cause a decreasing gradient of vessel oxygen concentration as we move downstream through bifurcating arteriolar trees—starving the outer regions of the retina of oxygen. However, phase separation actually leads to an increasing gradient of haematocrit away from the optic nerve, with the result that peak tissue and vessel oxygen tensions can occur far from the network inlets (figure 5i,l). This reinforces the degree of vascular pruning of small capillaries around a number of the dilated arterioles, which now extends more than halfway towards the retinal periphery (figure 5o).
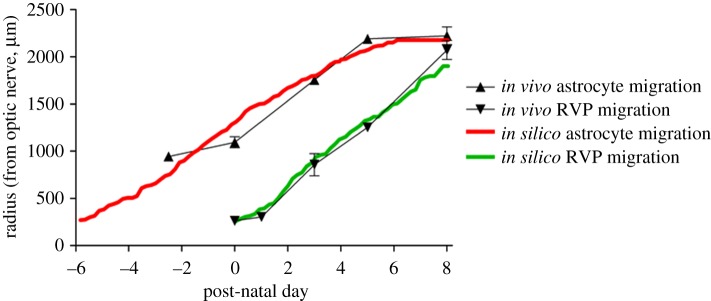
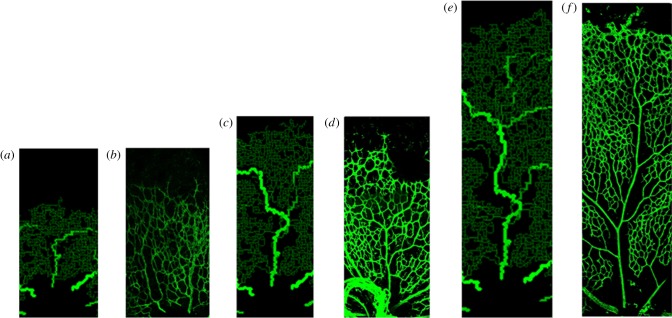
These results correlate well with experimentally observed outcomes and provide a number of valuable insights into the developmental process that would be difficult to obtain experimentally. For example, the mathematical model provides plausible predictions of the dynamics of RVP growth, with particular regard to the spatial and temporal evolution of VEGF-A concentration; the importance of purported upstream-convected and downstream-conducted angioadaptation stimuli; the role played by phase separation in vascular pruning and the subsequent impact on the overall plexus architecture; the temporal variation in haematocrit, vessel oxygen concentration and tissue oxygen concentration distributions throughout RVP growth. The latter of these is particularly significant: obtaining physiological measures from neonatal mice is challenging as they do not open their eyes until around P16. A comparison between in vivo and model data describing temporal development of the astrocyte and EC fronts is shown in figure 6—the two sets of results are in excellent quantitative agreement. Furthermore, in figure 7, we also observe a qualitative similarity between in vivo and in silico network architectures at specific time points (note that no effort was made to explicitly reproduce the experimental whole mount data quantitatively: the capillary architectures emerged naturally from the adopted modelling approach). Specifically, figure 7 shows images in the vicinity of the uppermost arteriole of the wild-type simulation at P2.7, P5.2 and P7.7, against typical arteriolar regions observed experimentally at P3, P5 and P8. We note, in particular, the similarities in the distribution and extent of oxygen-induced capillary pruning.
Figure 6.
Plot comparing the rate of frontal advance of astrocytes and endothelial cells obtained experimentally with those obtained by simulation. Astrocyte migration is represented by triangles with error bars (in vivo) or a solid red line (in silico), whereas endothelial cells migration is represented by inverted triangles with error bars (in vivo) or a solid green line (in silico).
Figure 7.
Detailed comparisons between in vivo and in silico capillary migration and remodelling in the developing retina. Specifically, the snapshots show (a) in silico P2.7, (b) in vivo P3, (c) in silico P5.2, (d) in vivo P5, (e) in silico P7.7 and (f) in vivo P8. The colours of the in silico vessel segments correspond to the colour bar in figure 6.
Having benchmarked the mathematical model against available experimental data from wild-type mice, some sensitivity analyses were carried out to gain additional insight into abnormal development. While a large number of sensitivities have been undertaken using the model—including sensitivity to astrocyte chemotactic response, input haematocrit, retinal blood pressure, VEGF-A isoform and capillary pruning potential—for brevity, we present results corresponding to only the latter two aspects of the developmental process.
3.3. Aberrant plexus formation I: VEGF-A isoform over-expression
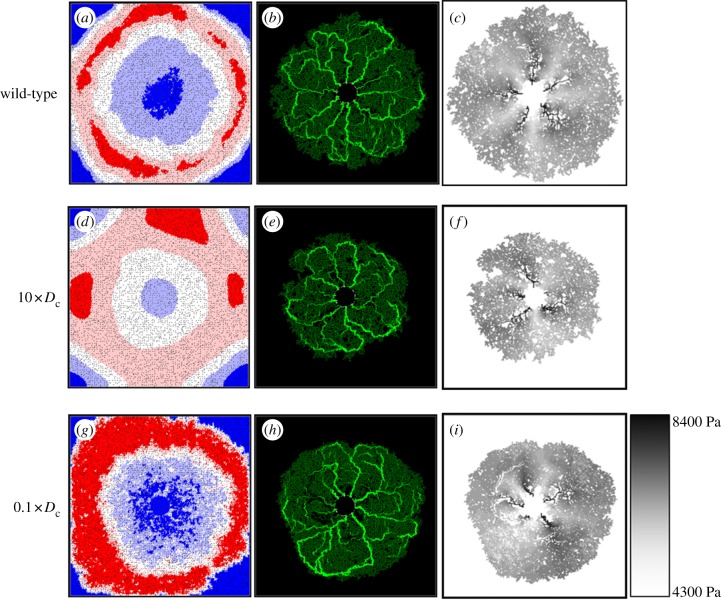
Variations in the diffusive properties of different VEGF-A isoforms are well documented, and a number of murine transgenic mouse models specifically expressing (or over-expressing) a single isoform have been reported [7,9,41,42]. In order to investigate the implications of this aspect of VEGF-A isoform mis-expression on capillary migration, the in silico model was run using a VEGF-A diffusion coefficient (Dc) an order of magnitude greater than that characterizing the wild-type case (a numerical analogue of isoform VEGF-A120, for example). The resulting network at P7.7 is shown in figure 8, where we observe retarded capillary migration in comparison with that seen in the base case—increased diffusion produces a shallower overall VEGF-A profile and lower concentrations at the leading edge (figure 8d versus 8a). This result compares favourably with data from studies describing the RVP structure in transgenic mice [8,9], where removal of the VEGF-A gradient, by increased VEGF-A expression, reduces the extent of endothelial migration. In the in silico setting here, both chemotaxis and capillary branching are impaired, resulting in a vascular network of irregular shape with numerous unperfused islands of retinal tissue (figure 8e). The impact of this irregularity is particularly emphasized by examining the underlying nodal pressure distribution. The wild-type network exhibits a high degree of pressure symmetry, with alternating high-pressure arteriolar and low-pressure venular regions fanning out from the optic nerve head (figure 8c). However, the more irregular mutant network produces an aberrant pressure distribution (figure 8f)—the extent of the high- and low-pressure regions varies erratically, causing some arterioles to become compromised and constricted. It is clear that this would have significant implications for oxygen delivery to the retinal tissue (results not shown).
Figure 8.
Snapshots at P7.7 displaying the simulated VEGF-A concentrations (a,d,g), vessel radii (b,e,h) and nodal pressures (c,f,i) for a range of VEGF-A diffusion coefficient (Dc) values. Specifically, the values were (a–c) 0.005 (base case), (d–f) 0.05 and (g–i) 0.0005. The VEGF-A concentrations and vessel radii correspond to the appropriate colour bars in figures 5 and 6, respectively. The nodal pressures are as per the colour bar provided.
Decreasing the VEGF-A diffusion coefficient in the model (again by an order of magnitude) allows us to predict the gross morphology of the RVP in mutant mice that over-express VEGF-A isoforms having a greater binding affinity to the ECM (VEGF-A188, for example). Results from these simulations indicate that there is a slower rate of EC migration owing to localized pooling of VEGF-A and a weaker (i.e. saturated) chemotactic response at high VEGF-A concentrations (figure 8g–i). It is clear that the dominant VEGF-A isoform has a profound effect upon retinal development through its interaction with migrating ECs during angiogenesis. The sensitivities suggest that the wild-type VEGF-A diffusion coefficient is optimum in producing a rate of plexus expansion that is most favourable for delivering oxygen and nutrients to the developing retina.
3.4. Aberrant plexus formation II: capillary pruning
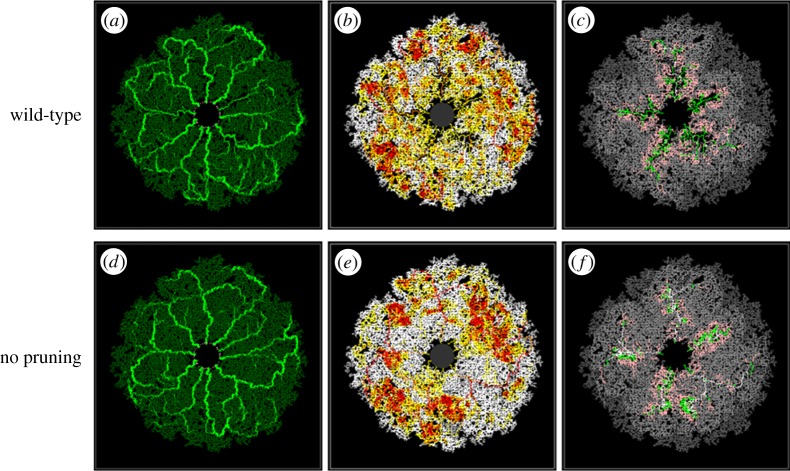
The second model perturbation illustrates the benefits of constructing a mathematical model that can be used to conduct simple numerical experiments, and potentially help to focus future in vivo experimentation. Specifically, we consider simulating the development of the RVP in a ‘numerical mutant’, where the potential for capillary pruning is greatly reduced. Such an evaluation provides useful insight into the role played by capillary pruning, and its importance in the natural progression of wild-type plexus development in vivo. For ease of comparison, we perform this simulation on a vascular network that evolves in an identical fashion to the wild-type case—that is, at each flow period, the vasculatures are exactly the same except for the absence of any previously pruned segments in the wild-type network. The two endpoint vasculatures at P7.7 are presented in figures 9a,d, where it is apparent that, despite the extensive pruning in the wild-type case (figure 5o), the spatial distribution of dilated vessels between the two final structures is broadly similar. In the absence of pruning, the angioadaptation algorithm still produces dilated arteriolar–venular loops, although there are slightly fewer dilated secondary arterioles (figure 9d). However, the key aspect of the sensitivity is highlighted when considering the underlying blood rheology and flow properties of the capillary structures. Comparing the distributions of haematocrit (figure 9b versus 9e) and vessel oxygen concentration (figure 9c versus 9f), it is clear that, in the absence of pruning, the haematocrit is distributed far less homogeneously in the retinal plane, with a large number of erythrocytes remaining within dilated vessels throughout their journey owing to the increased potential for plasma skimming at capillary junctions (i.e. red blood cells in the main feeder vessel bypass slow-flowing side branches such that these vessels receive predominantly plasma). This is particularly evident in the arteriole at the ‘4 o'clock’ position in figure 9e, where pure plasma skimming (i.e. side branches receiving only plasma) is observed—something that was never seen in the wild-type simulation. As a consequence of increased skimming, the distribution of vessel oxygen is also highly concentrated around the dilated arteriolar segments. From these results, we can conclude that vascular pruning reduces the extent of phase separation in the developing RVP, thereby preventing the build-up of large arteriolar haematocrits and high vessel oxygen concentrations. Rather than distributing flow from the main arterioles among many neighbouring capillaries, pruning of some segments induces an increased share of blood flow to those that are poorly supplied. These segments are then more likely to dilate and carry erythrocytes as well as oxygen to more distal areas of the superficial plexus. This is reflected in the contour plot of figure 10, where we present the distribution of the differences in tissue oxygen concentration between the two simulations at P7.7 (light colour indicates areas of the retina that were better oxygenated in the wild-type simulation, whereas dark colour indicates areas that were better oxygenated in the mutant). The plot shows that the pruned network delivers oxygen to the tissue in a more efficient manner, with lower oxygen tensions around the main arterioles and increased tensions in venous regions. It should be remarked that, although the endpoint vasculatures did not evolve to be completely identical, the evidence presented would discount this as the sole reason for the observed differences in tissue oxygen concentration. In summary, the model predicts that, under the influence of phase separation of plasma and red blood cells at bifurcations, capillary pruning in the developing murine retinal vasculature is a major factor in promoting the efficient delivery of oxygen to distal regions of the plexus.
Figure 9.
Snapshots at P7.7 displaying the simulated vessel radii (a,d), haematocrit (b,e) and vessel oxygen (c,f) distributions in the presence (a–c) and absence (d–f) of capillary pruning. The vascular architecture in each simulation evolves identically, with the exception of any occurrences of pruning in the wild-type simulation. The relevant colour bars can be found in figure 6.
Figure 10.
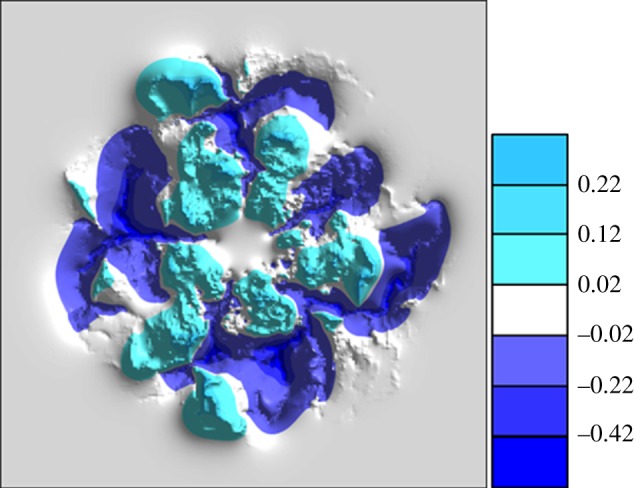
Contour plot displaying the differences in tissue oxygen concentration between the two simulations presented in figure 9. Light-coloured regions indicate a greater concentration in the wild-type simulation (figure 9(a–c)), while dark-coloured regions indicate a greater concentration in the mutant simulation (figure 9(d–f)).
4. Discussion and conclusions
The spatial and temporal development of nascent capillary networks plays a major role in determining tissue patterning and function and it is important to understand how various cellular and molecular cues interact with migrating cells throughout angiogenic responses. The growth and differentiation of the mammalian neural retina—a process that depends upon the formation of a multi-layered, interconnected vascular supply—provides an excellent in vivo system for investigating angiogenesis and represents an exquisitely balanced objective for mathematical modelling.
The governing migratory mechanisms have been considered in a previously reported one-dimensional study of retinal angiogenesis [36]. However, this approach was, by definition, unable to generate spatial information for the entire retinal surface, and a more realistic two-dimensional hybrid PDE-discrete model has been derived here in order to track the migration of individual astrocyte and endothelial tip cells towards the outer retinal boundary. The developing RVP is not an inert structure, however, as the vascular bed adapts and remodels in response to a variety of flow-induced metabolic and chemical stimuli. Hence, the complex hierarchical capillary architectures observed in vivo in the retina can never be reproduced using simple migration equations alone; perfusion-modified vessel adaptation and remodelling mechanisms must be included. Indeed, the inclusion of upstream-convected and downstream-conducted stimuli throughout perfusion [39,40] prove to be critical factors in reproducing simulated vasculature networks that more closely resemble the morphological features of those observed in the murine retina. Throughout the modelling work, our approach has been firmly coupled to the experimental biology, and we have attempted to honour the underlying cellular and vascular processes as closely as possible. The main focus of the investigation has been to understand how the various cellular, molecular and metabolic cues regulate RVP growth and form.
In the wild-type simulation, VEGF-A produced by migrating astrocytes exhibited a radial, wave-like profile, travelling outwards into the domain from the optic nerve. A peak in VEGF-A concentration was seen to form between the two cell types—lagging behind the leading edge of astrocytes, but guiding the EC progression behind. The predicted spatial and temporal evolution of the in silico VEGF-A concentration, which thus far requires experimental verification, illustrates the finely balanced nature of the interaction between retinal astrocytes and ECs. Model data concerning the temporal development of the two cellular fronts were found to be in excellent quantitative agreement with the laboratory observations. A range of wild-type data were presented highlighting the distribution of capillary structure, haematocrit, vessel oxygen concentration, tissue oxygen concentration and areas of capillary remodelling. During retinal angiogenesis, a structured vasculature was seen to emerge from the originally homogeneous capillary bed, and the dynamic nature of capillary plexus development was vividly demonstrated. Small dilated loops prevalent near the optic nerve head at earlier times were remodelled as the vascular bed grew, replaced by more extensive arteriolar–venular loops that served to transport blood efficiently towards equatorial regions of the domain. An interesting consequence of the angioadaptation model was that the radii of inlet arteriolar segments evolved naturally to be consistently smaller than their venous counterparts. The in silico RVP structures at various time points were compared with data from in vivo experiments, and there was a high degree of both qualitative and quantitative agreement. Clearly, only a limited number of metrics has been applied in making in vivo and in silico comparisons. Comprehensive model validation would require significantly more quantitative experimental measures to be produced, such as temporal data relating to the distributions of vessel density and capillary radii. Note, that there are some minor differences between the simulated and observed architectures: viz. the mathematical model tends to predict large calibre arteries all the way up to the growing front, whereas in vivo vessels tend to taper off towards the periphery. This is principally due to a slight underestimation of decay in the upstream-convected angioadaptation stimulus coupled with an underestimation of the maturity level required for nascent vessels to remodel. The model also predicts vascular plexuses that are slightly denser than the observed retinal vasculatures (cf. figure 7), and this is mainly attributable to the fact that they are grown discretely on an underlying distorted lattice—a slightly increased nodal spacing may have helped optimize the comparison.
The large degree of spatial heterogeneity in haematocrit within the capillary plexus was of particular note, with some distal areas of the retina containing haematocrits exceeding 0.75—a considerable increase on the input value of 0.45 and caused predominantly by phase separation at capillary junctions. In general, retinal haematocrit was predicted to increase downstream of each bifurcation on the arteriolar side, peaking at the retinal equator before gradually decreasing towards the outlet veins. This result correlates well with the recent work of Ganesan et al. [35], who used an image-based model of a fully developed (adult mouse) vasculature to extract a wide variety of flow-related parameters. It is interesting to note that the absence of phase separation would cause a decreasing gradient of vessel oxygen concentration as blood moved downstream through bifurcating arteriolar trees—starving the outer regions of the retina of oxygen. However, phase separation actually leads to an increasing gradient of haematocrit away from the optic nerve, with the beneficial result that peak tissue and vessel oxygen tensions can manifest themselves far away from the arteriolar inlets. This novel result strongly suggests phase separation at bifurcations as having a key role in determining the developing network architecture, particularly with regard to the pruning of capillaries distal to the optic nerve.
It is known that isoforms of VEGF-A have different molecular weights and a varying ability to bind heparin residues in the ECM and diffuse freely [43–46]. Moreover, removal of the VEGF gradient in the retina via increased VEGF-A expression in transgenic mouse models also reduces the extent of EC migration [7–9]. In order to investigate this aspect of the developmental process, a model sensitivity was executed to study the importance of the specific VEGF-A isoform over-expressed in the mouse eye. Enhanced VEGF-A diffusion resulted in a shallower overall concentration profile and lower concentrations at the leading edge, impairing both chemotaxis and capillary branching. Consequently, a highly irregular vascular network developed with numerous unperfused islands of retinal tissue, an aberrant distribution of pressure, compromised arteriolar inlets and, furthermore, poor oxygen delivery. Our results clearly demonstrate that the dominant VEGF-A isoform (VEGF-A164 in mouse or VEGF-A165 in human) has a profound effect upon retinal development through its interaction with migrating ECs during angiogenesis. Further to this, however, we also predict that the maintenance of an appropriate distribution of pressure in the retinal network depends crucially on the regularity of the overall architecture. Hence, irregular retinal network development and abnormal pressure distributions are excellent targets for future experimental verification.
Vascular pruning in the vicinity of arterioles is widespread in the developing superficial plexus, extending outwards from the optic nerve around P3 and reaching across 70 per cent of the retinal radius by P8. This phenomenon was incorporated into the mathematical model by assuming that a fundamental trigger for EC apoptosis is the occurrence of a large local tissue oxygen tension. A comparison was made between the development of the wild-type vasculature and a numerical mutant with reduced potential for capillary pruning. Although the angioadaptation algorithm resulted in similar endpoint capillary radii distributions, profound differences were observed in the corresponding haematocrit and oxygen distributions. In the absence of pruning, erythrocytes were distributed in a highly heterogeneous manner with large concentrations around the main dilated loops and low concentrations in all other regions. A further comparison between the tissue oxygen distributions led to the hypothesis that the removal of vessel segments around primary and secondary arterioles actually increases the efficiency of oxygen delivery to distal regions of the developing superficial plexus. Again a target for future experimental verification, this result predicts that the extensive vascular pruning occurring throughout RVP development optimizes the network for nutrient delivery.
A major advantage in studying the retinal vasculature is that it provides a capillary system that can be observed with relative clarity both in vivo and post-mortem and, as a complete understanding of the developing retinal circulation is still lacking, it provides an excellent target for both theoretical and in silico studies. The hierarchical structure of the RVP poses a rigorous test of any angiogenesis model—such patterning is generally absent in the context of tumour-induced angiogenesis, for example—and it would appear that rather complex perfusion-related stimuli hold the key to understanding how these structures develop in vivo. It is hoped that the model developed here could serve as a useful starting point for future research in this area, particularly with a view towards a better understanding of pathological ocular conditions.
Acknowledgements
The authors gratefully acknowledge financial support from the BBSRC grant nos. BB/F002254/1 and BB/F002807/1.
References
- 1.Fruttiger M. 2002. Development of the mouse retinal vasculature: angiogenesis versus vasculogenesis. Invest. Ophthalmol. Vis. Sci. 43, 522–527 [PubMed] [Google Scholar]
- 2.Gariano R. F. 2003. Cellular mechanisms in retinal vascular development. Prog. Retin. Eye Res. 22, 295–306 10.1016/S1350-9462(02)00062-9 (doi:10.1016/S1350-9462(02)00062-9) [DOI] [PubMed] [Google Scholar]
- 3.Mudhar H. S., Pollock R. A., Wang C., Stiles C. D., Richardson W. D. 1993. PDGF and its receptors in the developing rodent retina and optic nerve. Development 118, 539–552 [DOI] [PubMed] [Google Scholar]
- 4.Fruttiger M., Calver A. R., Kruger W. H., Mudhar H. S., Michalovich D., Takakura N., Nishikawa S., Richardson W. D. 1996. PDGF mediates a neuron-astrocyte interaction in the developing retina. Neuron 17, 1117–1131 10.1016/S0896-6273(00)80244-5 (doi:10.1016/S0896-6273(00)80244-5) [DOI] [PubMed] [Google Scholar]
- 5.West H., Richardson W. D., Fruttiger M. 2005. Stabilization of the retinal vascular network by reciprocal feedback between blood vessels and astrocytes. Development 132, 1855–1862 10.1242/dev.01732 (doi:10.1242/dev.01732) [DOI] [PubMed] [Google Scholar]
- 6.Uemura A., Kusuhara S., Wiegand S. J., Yu R. T., Nishikawa S. 2006. Tlx acts as a proangiogenic switch by regulating extracellular assembly of fibronectin matrices in retinal astrocytes. J. Clin. Invest. 116, 369–377 10.1172/JCI25964 (doi:10.1172/JCI25964) [DOI] [PMC free article] [PubMed] [Google Scholar]
- 7.Stalmans I., et al. 2002. Arteriolar and venular patterning in retinas of mice selectively expressing VEGF isoforms. J. Clin. Invest. 109, 327–336 10.1172/JCI14362 (doi:10.1172/JCI14362) [DOI] [PMC free article] [PubMed] [Google Scholar]
- 8.Gerhardt H., et al. 2003. VEGF guides angiogenic sprouting utilizing endothelial tip cell filopodia. J. Cell. Biol. 161, 1163–1177 10.1083/jcb.200302047 (doi:10.1083/jcb.200302047) [DOI] [PMC free article] [PubMed] [Google Scholar]
- 9.Mitchell C. A., et al. 2006. Unique vascular phenotypes following over-expression of individual VEGFA isoforms from the developing lens. Angiogenesis 9, 209–224 10.1007/s10456-006-9056-7 (doi:10.1007/s10456-006-9056-7) [DOI] [PubMed] [Google Scholar]
- 10.Olsen L., Sherratt J. A., Maini P. K., Arnold F. 1997. A mathematical model for the capillary endothelial cell–extracellular matrix interactions in wound-healing angiogenesis. J. Math. Appl. Med. Biol. 14, 261–281 10.1093/imammb/14.4.261 (doi:10.1093/imammb/14.4.261) [DOI] [PubMed] [Google Scholar]
- 11.Orme M. E., Chaplain M. A. J. 1997. Two-dimensional models of tumour angiogenesis and anti-angiogenesis strategies. J. Math. Appl. Med. Biol. 14, 189–205 10.1093/imammb/14.3.189 (doi:10.1093/imammb/14.3.189) [DOI] [PubMed] [Google Scholar]
- 12.Anderson A. R. A., Chaplain M. A. J. 1998. Continuous and discrete mathematical models of tumour-induced angiogenesis. Bull. Math. Biol. 60, 857–899 10.1006/bulm.1998.0042 (doi:10.1006/bulm.1998.0042) [DOI] [PubMed] [Google Scholar]
- 13.Stokes C. L., Lauffenburger D. A. 1991. Analysis of the roles of microvessel endothelial cell random motility and chemotaxis in angiogenesis. J. Theor. Biol. 152, 377–403 10.1016/S0022-5193(05)80201-2 (doi:10.1016/S0022-5193(05)80201-2) [DOI] [PubMed] [Google Scholar]
- 14.Levine H. A., Pamuk S., Sleeman B. D., Nielsen-Hamilton M. 2001. Mathematical modeling of the capillary formation and development in tumor angiogenesis: penetration into the stroma. Bull. Math. Biol. 63, 801–863 10.1006/bulm.2001.0240 (doi:10.1006/bulm.2001.0240) [DOI] [PubMed] [Google Scholar]
- 15.Plank M. J., Sleeman B. D. 2004. Lattice and non-lattice models of tumour angiogenesis. Bull. Math. Biol. 66, 1785–1819 10.1016/j.bulm.2004.04.001 (doi:10.1016/j.bulm.2004.04.001) [DOI] [PubMed] [Google Scholar]
- 16.Mantzaris N. V., Webb S., Othmer H. G. 2004. Mathematical modeling of tumor-induced angiogenesis. J. Math. Biol. 49, 111–187 10.1007/s00285-003-0262-2 (doi:10.1007/s00285-003-0262-2) [DOI] [PubMed] [Google Scholar]
- 17.Peirce S. M. 2008. Computational and mathematical modelling of angiogenesis. Microcirculation 15, 739–751 10.1080/10739680802220331 (doi:10.1080/10739680802220331) [DOI] [PMC free article] [PubMed] [Google Scholar]
- 18.McDougall S. R., Anderson A. R. A., Chaplain M. A. J., Sherratt J. A. 2002. Mathematical modelling of flow through vascular networks: implications for tumour-induced angiogenesis and chemotherapy strategies. Bull. Math. Biol. 64, 673–702 10.1006/bulm.2002.0293 (doi:10.1006/bulm.2002.0293) [DOI] [PubMed] [Google Scholar]
- 19.Alarcon T., Byrne H., Maini P. K. 2003. A cellular automaton model for tumour growth in inhomogeneous environment. J. Theor. Biol. 225, 257–274 10.1016/S0022-5193(03)00244-3 (doi:10.1016/S0022-5193(03)00244-3) [DOI] [PubMed] [Google Scholar]
- 20.Stephanou A., McDougall S. R., Anderson A. R. A., Chaplain M. A. J. 2005. Mathematical modelling of flow in 2D and 3D vascular networks: applications to anti-angiogenic and chemotherapeutic drug strategies. Math. Comput. Model. 41, 1137–1156 10.1016/j.mcm.2005.05.008 (doi:10.1016/j.mcm.2005.05.008) [DOI] [Google Scholar]
- 21.Stephanou A., McDougall S. R., Anderson A. R. A., Chaplain M. A. J. 2006. Mathematical modelling of the influence of blood rheological properties upon adaptative tumour-induced angiogenesis. Math. Comput. Model. 44, 96–123 10.1016/j.mcm.2004.07.021 (doi:10.1016/j.mcm.2004.07.021) [DOI] [Google Scholar]
- 22.McDougall S. R., Anderson A. R. A., Chaplain M. A. J. 2006. Mathematical modelling of dynamic adaptive tumour-induced angiogenesis: clinical implications and therapeutic targeting strategies. J. Theor. Biol. 241, 564–589 10.1016/j.tbi.2005.12.022 (doi:10.1016/j.tbi.2005.12.022) [DOI] [PubMed] [Google Scholar]
- 23.Chaplain M. A. J., McDougall S. R., Anderson A. R. A. 2006. Mathematical modeling of tumour-induced angiogenesis. Annu. Rev. Biomed. Eng. 8, 233–257 10.1146/annurev.bioeng.8.061505.095807 (doi:10.1146/annurev.bioeng.8.061505.095807) [DOI] [PubMed] [Google Scholar]
- 24.Macklin P., McDougall S., Anderson A. R. A., Chaplain M. A. J., Cristini V., Lowengrub J. 2008. Multiscale modelling and nonlinear simulation of vascular tumour growth. J. Math. Biol. 58, 765–798 10.1007/s00285-008-0216-9 (doi:10.1007/s00285-008-0216-9) [DOI] [PMC free article] [PubMed] [Google Scholar]
- 25.Welter M., Bartha K., Rieger H. 2009. Vascular remodelling of an arterio-venous blood vessel network during solid tumour growth. J. Theor. Biol. 259, 405–422 10.1016/j.jtbi.2009.04.005 (doi:10.1016/j.jtbi.2009.04.005) [DOI] [PubMed] [Google Scholar]
- 26.Cai Y., Shixiong X., Wu J., Long Q. 2011. Coupled modelling of tumour angiogenesis, tumour growth and blood perfusion. J. Theor. Biol. 279, 90–101 10.1016/j.jtbi.2011.02.017 (doi:10.1016/j.jtbi.2011.02.017) [DOI] [PubMed] [Google Scholar]
- 27.Pettet G. J., Byrne H. M., McElwain D. L. S., Norbury J. 1996. A model of wound-healing angiogenesis in soft tissue. Math. Biosci. 136, 35–63 10.1016/0025-5564(96)00044-2 (doi:10.1016/0025-5564(96)00044-2) [DOI] [PubMed] [Google Scholar]
- 28.Schugart R. C., Friedman A., Zhao R., Sen C. K. 2008. Wound angiogenesis as a function of tissue oxygen tension: a mathematical model. Proc. Natl Acad. Sci. USA 105, 2628–2633 10.1073/pnas.0711642105 (doi:10.1073/pnas.0711642105) [DOI] [PMC free article] [PubMed] [Google Scholar]
- 29.Xue C., Friedman A., Sen C. K. 2009. A mathematical model of ischemic cutaneous wounds. Proc. Natl Acad. Sci. USA 106, 16782–16787 10.1073/pnas.0909115106 (doi:10.1073/pnas.0909115106) [DOI] [PMC free article] [PubMed] [Google Scholar]
- 30.Flegg J. A., McElwain D. L. S., Byrne H. M., Turner I. W. 2009. A three species model to simulate application of hyperbaric oxygen therapy to chronic wounds. PLoS Comput. Biol. 5, e1000451. 10.1371/journal.pcbi.1000451 (doi:10.1371/journal.pcbi.1000451) [DOI] [PMC free article] [PubMed] [Google Scholar]
- 31.Machado M. J. C., Watson M. G., Devlin A. H., Chaplain M. A. J., McDougall S. R., Mitchell C. A. 2010. Dynamics of angiogenesis during wound healing: a coupled in vivo and in silico study. Microcirculation 18, 183–197 10.1111/j.1549-8719.2010.00076.x (doi:10.1111/j.1549-8719.2010.00076.x) [DOI] [PubMed] [Google Scholar]
- 32.Maggelakis S. A., Savakis A. E. 1996. A mathematical model of growth factor induced capillary growth in the retina. Math. Comput. Model. 24, 33–41 10.1016/0895-7177(96)00124-0 (doi:10.1016/0895-7177(96)00124-0) [DOI] [Google Scholar]
- 33.Maggelakis S. A., Savakis A. E. 1999. A mathematical model of retinal neovascularization. Math. Comput. Model. 29, 91–97 10.1016/S0895-7177(99)00022-9 (doi:10.1016/S0895-7177(99)00022-9) [DOI] [Google Scholar]
- 34.Liu D., Wood N. B., Witt N., Hughes A. D., Thom S. A., Xu X. Y. 2009. Computational analysis of oxygen transport in the retinal arterial network. Curr. Eye Res. 34, 945–956 10.3109/02713680903230079 (doi:10.3109/02713680903230079) [DOI] [PubMed] [Google Scholar]
- 35.Ganesan P., He S., Xu H. 2010. Analysis of retinal circulation using an image-based network model of retinal vasculature. Microvasc. Res. 80, 99–109 10.1016/j.mvr.2010.02.005 (doi:10.1016/j.mvr.2010.02.005) [DOI] [PubMed] [Google Scholar]
- 36.Aubert M., Chaplain M. A. J., McDougall S. R., Devlin A., Mitchell C. A. 2011. A continuous mathematical model of the developing murine retinal vasculature. Bull. Math. Biol. 73, 2430–2451 10.1007/s11538-011-9631-y (doi:10.1007/s11538-011-9631-y) [DOI] [PubMed] [Google Scholar]
- 37.Pries A. R., Ley K., Claassen M., Gaehtgens P. 1989. Red cell distribution at microvascular bifurcations. Microvasc. Res. 38, 81–101 10.1016/0026-2862(89)90018-6 (doi:10.1016/0026-2862(89)90018-6) [DOI] [PubMed] [Google Scholar]
- 38.Pries A. R., Secomb T. W., Gessner T., Sperandio M. B., Gross J. F., Gaehtgens P. 1994. Resistance to blood flow in microvessels in vivo. Circ. Res. 75, 904–915 [DOI] [PubMed] [Google Scholar]
- 39.Pries A. R., Reglin B., Secomb T. W. 2001. Structural adaptation of microvascular networks: functional roles of adaptive responses. Am. J. Physiol. Heart Circ. Physiol. 281, 1015–1025 [DOI] [PubMed] [Google Scholar]
- 40.Pries A. R., Hopfner M., le Noble F., Dewhirst M. W., Secomb T. W. 2010. The shunt problem: control of functional shunting in normal and tumour vasculature. Nat. Rev. Cancer 10, 587–593 10.1038/nrc2895 (doi:10.1038/nrc2895) [DOI] [PMC free article] [PubMed] [Google Scholar]
- 41.Ash J. D., Overbeek P. A. 2000. Lens-specific VEGF-A expression induces angioblast migration and proliferation and stimulates angiogenic remodeling. Dev. Biol. 223, 383–398 10.1006/dbio.2000.9755 (doi:10.1006/dbio.2000.9755) [DOI] [PubMed] [Google Scholar]
- 42.Rutland C. S., Mitchell C. A., Nasir M., Konerding M. A., Drexler H. C. 2007. Microphthalmia, persistent hyperplastic hyaloid vasculature and lens anomalies following overexpression of VEGF-A188 from the alphaA-crystallin promoter. Mol. Vis. 13, 47–56 [PMC free article] [PubMed] [Google Scholar]
- 43.Ferrara N., Houck K., Jakeman L., Leung D. W. 1992. Molecular and biological properties of the vascular endothelial growth factor family of proteins. Endocr. Rev. 13, 18–32 10.1210/er.13.1.18 (doi:10.1210/er.13.1.18) [DOI] [PubMed] [Google Scholar]
- 44.Keyt B. A., Berleau L. T., Nguyen H. V., Chen H., Heinsohn H., Vandlen R., Ferrara N. 1996. The carboxyl-terminal domain (111–165) of vascular endothelial growth factor is critical for its mitogenic potency. J. Biol. Chem. 271, 7788–7795 10.1074/jbc.271.13.7788 (doi:10.1074/jbc.271.13.7788) [DOI] [PubMed] [Google Scholar]
- 45.Park J. E., Keller G. A., Ferrara N. 1993. The vascular endothelial growth factor (VEGF) isoforms: differential deposition into the subepithelial extracellular matrix and bioactivity of extracellular matrix-bound VEGF. Mol. Biol. Cell. 4, 1317–1326 [DOI] [PMC free article] [PubMed] [Google Scholar]
- 46.Shima D. T., Kuroki M., Deutsch U., Ng Y. S., Adamis A. P., D'Amore P. A. 1996. The mouse gene for vascular endothelial growth factor. Genomic structure, definition of the transcriptional unit, and characterization of transcriptional and post-transcriptional regulatory sequences. J. Biol. Chem. 271, 3877–3883 10.1074/jbc.271.7.3877 (doi:10.1074/jbc.271.7.3877) [DOI] [PubMed] [Google Scholar]


