

Abstract
Glucose transport plays an important role in maintaining low sugar concentration in airway surface liquid (ASL), which is critical for mucociliary clearance and bacterial colonization. Experimental evidence indicates that glucose/hexose uptake in lung/airway cells occurs by means of two structurally distinct glucose transporter pathways: the Na+-dependent glucose transporters (SGLT family) and the facilitative glucose transporters (GLUT family). In this study, we examined the expression of the major glucose transporters of the intestine, GLUT2, GLUT5, SGLT1 and T1R3 taste receptor subunit, in the trachea of rats using immunohistochemistry and immunoelectron microscopy, and compared them using double-labeled confocal microscopy. We found that GLUT2, GLUT5, SGLT1 and T1R3 are selectively expressed in different cell types. T1R3 and GLUT2 are predominantly expressed in subsets of solitary chemoreceptor cells (SCCs) and ciliated cells, GLUT5 is present in subsets of SCCs and in secretory cells, and SGLT1 is exclusively expressed in a unique cell type, SCCs. Furthermore, we demonstrated that T1R3 is colocalized with SGLT1 in SCCs and with GLUT2 transporter in ciliated cells. In conclusion, these findings reveal that different cell types are associated with the uptake of glucose in ASL and that, due to their T1R3 expression, SCCs and ciliated cells are most likely to participate in the chemosensory process in ASL.
Keywords: glucose transporter, immunohistochemistry, trachea, T1R3, ultrastructure
Introduction
The rat tracheal epithelium is generally considered to consist of histologically distinct types of cells, which are differently arranged along its length (Alexander et al. 1975; Jeffery & Reid, 1975; Marin et al. 1979). It is well known that the predominant type of ciliated cell coexists with non-ciliated cells, diversified as mucus-producing cells, serous secretory cells, and basal cells. Recently, the availability of important markers of chemoreceptive mechanisms has made it possible to identify a group of non-ciliated epithelial cells sharing the immunohistochemical characteristics of the taste receptor cells (TRCs) of the tongue (Merigo et al. 2005). They represent a specialized epithelial cell type, which is recognized as having a chemoreceptor function because it expresses molecules of the chemoreceptive taste signaling cascade, arranged in several phenotypically distinct subsets, such as α-gustducin, phospholipase C beta 2 (PLCβ2), inositol 1,4,5-trisphosphate receptor (IP3R3), and transient receptor potential ion channel M5 (TRPM5) (Merigo et al. 2005; Tizzano et al. 2006; Kaske et al. 2007). These cells cannot be defined by a single morphology and for this reason they are described in the literature by various names, such as brush cells, neuroendocrine cells or solitary chemosensory cells (SCCs; Sbarbati & Osculati, 2003, 2005). Uniform criteria for their description have not been applied, so the term SCCs seems most appropriate to collectively describe these types of cells, because they have in common their existence as solitary elements or clusters of a few cells.
The luminal surface of the tracheal epithelium is bathed by airway surface liquid (ASL), which consists in a serous layer adjacent to the epithelium membrane, the periciliary layer (PCL), and an overlying mucus layer. The PCL represents the perireceptor milieu in which the cilia beat and the apical processes of chemosensory cells end, while the mucus layer is a component of the mucociliary system, which participates with the cilia and ASL in the maintenance of mucociliary clearance (Matsui et al. 1998). Substances contained in ASL enter the airways through inhalation (inhaled pollutants, microorganism products, viruses) or are locally released or diffused through transepithelial and transcellular flux; the latter is regulated by transporters and ion channels located in the apical as well as the basolateral membrane of cells lining the tracheal lumen. Ion transport assures an adequate ASL volume through water supply, which is important for mucus hydration and ciliary beating (Widdicombe, 2002).
The presence of glucose and other hexoses in the ASL of several species, including humans, has been known for a long time, and the most widely accredited source is plasma or lung interstitium. The proposed model by which hexoses enter the liquid in the alveolar/airway lumen is passive paracellular diffusion, by which they move down their concentration gradient from blood to the ASL, across the opening of tight junctions (Kalsi et al. 2008a). The paracellular pathway is maintained by ASL glucose concentrations lower than those in blood, which is the result of a balance between paracellular entry from the plasma/lung interstitium and uptake, against the transepithelial glucose gradient, by epithelial cells (Barker et al. 1989; Kalsi et al. 2008a).Experimental evidence using non-metabolizable analogues of glucose and specific inhibitors indicates that glucose/hexose uptake in lung/airway cells occurs by means of two structurally distinct glucose transporter pathways: the Na+-dependent glucose transporters (SGLT family) and the facilitative glucose transporters (GLUT family). SGLT1 isoform has been indicated as the glucose/galactose transporter, localized in the brush border membrane of airway epithelial cells, which actively removes glucose from the ASL (Barker et al. 1989; Saumon et al. 1990, 1996; de Prost & Saumon, 2007). In the classic model of glucose absorption, SGLT1 is a cotransporter of glucose and Na+ that uses the electrochemical gradient of Na+ generated by Na+-K+ ATPase pumps in the basolateral membrane to transport molecules of glucose against their gradient. SGLT1 also plays an important role in maintaining ASL volume and preserving mucociliary clearance in airways, since Na/glucose cotransport is accompanied by water entry to dissipate an osmotic gradient generated by the transport (de Prost & Saumon, 2007). Alveolar glucose uptake mediated by SGLT1 has been reported in the lung of sheep fetus (Barker et al. 1989), bovine (Oelberg et al. 1994), rat (Basset et al. 1987; Saumon & Dreyfuss, 1991; Saumon & Martet, 1996) and has also been confirmed in the trachea of sheep (Charon et al. 1994), horse and rat (Joris & Quinton, 1989).
The facilitative GLUTs comprise transporter isoforms having a tissue- and species-specific distribution and the ability to transport other hexoses besides glucose, with the single exception of GLUT5, which transports only fructose (Mueckler, 1994; Thorens & Mueckler, 2010). Among the GLUT family, GLUT1 and GLUT2 mRNA were seen in the bronchial epithelium in humans and rats (Devaskar & deMello, 1996; Wood et al. 2004). More recently, GLUT2 mRNA and protein expression have been observed in non-polarized and polarized H441 human airway epithelial cells and human bronchial mucosa (Kalsi et al. 2008b).
The studies cited above aimed mainly to detect the presence of glucose transporters, above all in the conducting airways of the bronchi and bronchioles of the lung, while few studies have been conducted in the trachea. Cells involved in glucose transport in the trachea have not been fully characterized, although many interesting functions of transcellular monosaccharide transport are being discovered in organs involved in the control of glucose homeostasis, such as the gustatory and digestive systems (Shirazi-Beechey et al. 2011). Considering that different cell types constitute the tracheal epithelium, clarification of the specific cellular and subcellular localization of glucose transporters may be important for improved evaluations of the regulation of glucose homeostasis in ASL.
Therefore, the aim of the present study was to characterize the cell types which express glucose transporters in the trachea, by means of immunohistochemistry at light and electron microscopy. We chose GLUT2, GLUT5, and SGLT1 glucose transporters because they represent the main transporter types functionally expressed in the intestinal epithelium. In a second step, in order to evaluate whether glucose transporters were localized in cells playing a role in mucociliary clearance or in glucose-sensing, we compared glucose transporter immunolabeling with that of acetylated α-tubulin, a specific marker of the cilia axoneme, and T1R3, an integral membrane protein marker of sugar- and umami-chemoreceptive cells, by double-labeling confocal laser microscopy.
Materials and methods
Tissue preparation
The study was conducted on 10 male Wistar rats weighing 150–200 g and kept at the departmental animal facility. The rats were allowed free access to food and water and handled in accordance with the guidelines for animal experimentation established by Italian law. The animals were anesthetized with ether and perfused with 4% paraformaldehyde in 0.1 m phosphate buffer (PB), pH 7.4. The excised tissues were further fixed by immersion in the same fixative for 2 h at 4 °C. After rinsing in 0.1 m PB, the tissues were put into 30% sucrose overnight and cut (40 μm thickness) on a freezing microtome (Reichert-Jung, Vienna, Austria). Sections from five animals were processed for immunoperoxidase and sections from five animals for single and double immunofluorescence labeling. Two or three sections per animal were used for each immunohistochemical experiment.
Primary antibodies
For this study we used the following primary antibodies: anti-GLUT2 (also known as -SLC2A2; LifeSpan Biosciences Inc., Seattle, WA, USA, cat #LS-C15390/25520); anti-GLUT5 (also known as -SLC2A5; Lifespan Biosciences, cat #LS-C15414/7781); anti-SGLT1 (also known as -SLC5A1; Abcam, Cambridge, UK, cat #ab14686); anti-α-gustducin (Santa Cruz Biotechnology Inc., Heidelberg, Germany, cat #sc-395); anti-T1R3 (Abcam, cat #ab74732), anti-acetylated α-tubulin (Abcam, cat #ab24610).
Immunohistochemistry
Peroxidase-immunohistochemistry and immunofluorescence were performed as described in Merigo et al. (2011). Control sections were prepared by preabsorbing the glucose transporter antibodies with the corresponding peptide (5 μg 1 mL–1 of antibody; GLUT2 control peptide, Chemicon International Inc., Temecula, CA, USA; GLUT5 control peptide, Chemicon International Inc.; SGLT1 control peptide, Abcam) or by omitting the primary antibody.
For double immunofluorescent staining, free-floating sections were incubated overnight in a mixture of mouse anti-α-tubulin antibody (1 : 2000) with rabbit anti-GLUT2, anti-GLUT5, anti-SGLT1, anti-α-gustducin, or anti-T1R3 antibody, washed, and incubated in a mixture of secondary antibodies (TRITC goat anti-mouse and FITC goat anti-rabbit) for 1 h. Control sections were prepared as described above.
When the glucose transporter immunolabeling was compared with that of T1R3, the double-label assay was carried out sequentially using a method that relied on the use of secondary monovalent Fab fragments (Lewis Carl et al. 1993; Negoescu et al. 1994), because all primary antibodies are raised in the same species. The double staining was performed as described in Merigo et al. (2011). For nuclear staining, some sections were counterstained with 4′,6-diamidino-2-phenyindole (DAPI, 1 : 1000; Invitrogen).
Control sections were prepared using one of the following methods: (i) adding the corresponding peptide (5 μg 1 mL–1 of antibody) to glucose transporter antibodies; (ii) replacing the second primary antibody with normal rabbit serum; (iii) exchanging the fluorophores of the secondary antibodies; (iv) omitting the primary antibody; or (v) changing the sequence of secondary antibody application.
Images were acquired by using a Zeiss LSM 510 confocal microscope equipped with argon (488 nm) and helium/neon (543 nm) excitation beams. Sequential acquisition, i.e. one color at a time, was utilized on double-label tissues to avoid side-band excitation of the inappropriate fluorophore. All images for publication were composed using adobe photoshop software (version 6.0; Adobe Systems, Mountain View, CA, USA), adjusting only brightness and contrast.
Immunoelectron microscopy
For ultrastructural examination, free-floating sections, previously immunostained using the ABC technique, were postfixed in 1% OsO4, dehydrated and embedded in a mixture of Epon and Araldite (Electron Microscopic Sciences, Fort Washington, PA, USA). Ultrathin sections were observed unstained on a Morgagni 268D electron microscope (FEI Company Philips, Milan, Italy).
Results
Localization of GLUT2, GLUT5, SGLT1, and T1R3 in tracheal epithelium
The specificity of the glucose transporter antibodies used in the current study was tested in our previous work utilizing sections of intestine as positive controls (Merigo et al. 2011).
GLUT2 labeling
Here, the specificity of the GLUT2 antibody was tested on rat lung sections which confirmed strong staining of bronchiolar epithelial cells (Fig. 1A,B), as previously detected by Kalsi et al. (2008b).
Fig. 1.
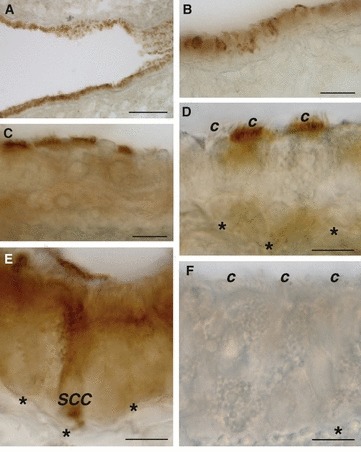
Immunoperoxidase localization of GLUT2 in rat airway showing immunoreactivity in bronchiolar (A,B), tracheal ciliated (C,D), and solitary chemosensory cells (E). No labeling was observed when the anti-GLUT2 antibody was preabsorbed with its specific peptide (F). *Basement membrane; c, cilia; SCC, solitary chemosensory cell. Scale bar: 30 μm (A), 10 μm (B–F).
In tracheal sections, intense staining for GLUT2 was observed in ciliated cells in which the localization of this isoform was restricted to the apical cell pole lining the lumen of the airway (Fig. 1C,D). Some ciliated cells appeared to be GLUT2-negative (Fig. 1D). In addition, GLUT2 immunostaining was observed in non-ciliated cells that differed considerably, in their shape and immunostaining, from the immunoreactive (IR) cells described above. They appeared as solitary cells with the body resting on the basement membrane and an apical process reaching the lumen (Fig. 1E). Immunostaining was distributed throughout the entire cytoplasm, with a more intense staining at the apical pole. Due to their morphology, these cells were considered to be SCCs. Immunoreactivity was not observed when anti-GLUT2 antibody was preincubated with an excess control peptide or the primary antibody was omitted (Fig. 1F).
Immunoelectron microscopy confirmed a strong immunoreactivity in the apical pole surface of ciliated cells (Fig. 2A). Cilia did not show staining for GLUT2 (Fig. 2B). At electron microscopy analysis, IR-SCCs had a round or oval euchromatic nucleus located in the basal part of the cell and an apical process with a few thin microvilli protruding into the lumen. The labeling pattern was homogeneously cytoplasmic, from the body to the apex of the cells, with immunostaining also colocalized on the microvilli (Fig. 2C,D).
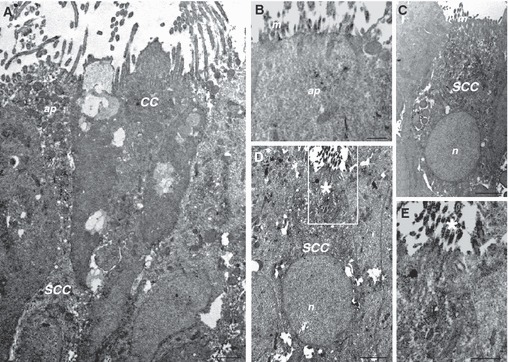
Fig. 2.
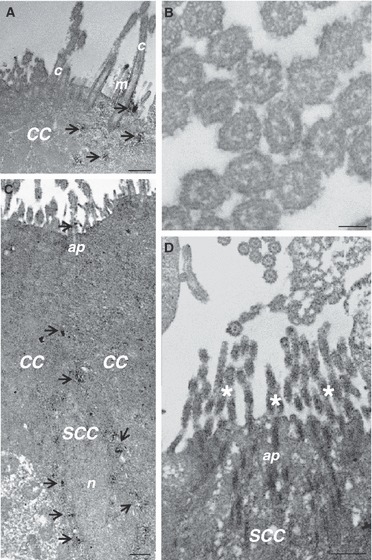
Immunoelectron microscopy for GLUT2 in ciliated (CC) and solitary chemosensory cells (SCC) of the trachea. In CC, GLUT2 immunoreactivity is concentrated on the apical surface (arrow, A); cilia do not show immunostaining (B). In SCC, GLUT2 immunoreactivity is distributed throughout the entire cytoplasm (arrow; C) and in the brush-like set of microvilli on the apical surface (D). ap, apical pole; c, cilia; m, microvilli; n, nucleus; * Brush-like set of microvilli. Scale bar: 500 nm (A,C,D), 100 nm (B).
GLUT5 labeling
GLUT5-IR cells were non-ciliated, tall and columnar with a slightly convex or flat apical luminal surface (Fig. 3A–E). Immunostaining was concentrated in the supranuclear cytoplasmic region, which contained many granules, apparently of different sizes. At the ultrastructural level, the GLUT5-IR cells proved to be secretory elements characterized by abundant cytoplasm and endoplasmic reticulum, with several granules in the apical part of the cells (Fig. 3G). Immunostaining was concentrated around or inside the granules (Fig. 3G), or sparsely distributed in the apical pole (Fig. 3H).
Fig. 3.
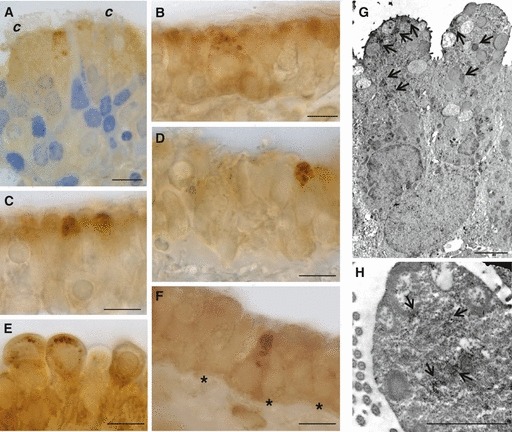
Immunoperoxidase staining showing GLUT5 immunoreactivity at light (A–F) and electron microscopy (G, H) in rat trachea. Immunoreactivity is present in secretory (A–E), and solitary chemosensory cells (F). Nuclei are stained with toluidine blue (A). At ultrastructural level, secretory cells show GLUT5 labeling around or inside the granules (arrow, G), or sparsely distributed in the apical surface (arrow, H). *Basement membrane; c, cilia. Scale bar, 10 μm (A–F), 2000 nm (G, H).
GLUT5 labeling was also found in pear-shaped cells with the typical characteristics of SCCs (Fig. 3F). These IR cells were not evaluated at ultrastructural level. By immunofluorescence, some cells with little cytoplasm and resting on the basement membrane revealed GLUT5 immunostaining. These cells were identified as basal cells.
No staining was observed in these cells when anti-GLUT5 antibody was preincubated with an excess control peptide or the primary antibody was omitted.
SGLT1 labeling
We observed that SGLT1 was highly expressed in flask- or pear-shaped non-ciliated epithelial cells, sparsely distributed in the tracheal epithelium as solitary cells or in small clusters of two or three elements (Fig. 4A–F). Their body was basally located and showed an apical process reaching the free surface. Immunoreactivity was expressed throughout the entire cytoplasm, which appeared finely granulated in some cells (Fig. 4C–F). Immunoreactivity was not observed when anti-SGLT1 antibody was preincubated with an excess control peptide or the primary antibody was omitted.
Fig. 4.
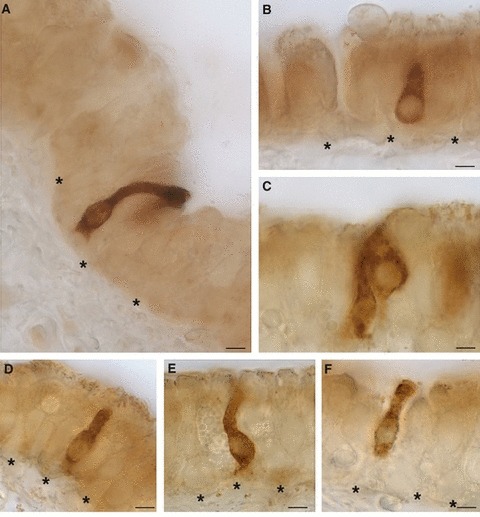
Immunoperoxidase staining showing SGLT1 immunoreactivity in solitary chemosensory cells of the trachea. The labeling is cytoplasmic from the body to the apex of the cells. *Basement membrane. Scale bar: 5 μm.
At ultrastructural level, all SGLT1-IR cells were identified as SCCs. They were characterized by a round or oval euchromatic nucleus, a perinuclear and supranuclear cytoplasmatic region filled with poorly developed cell organelles and small clear vesicles, spherical in shape (Fig. 5A). Immunoreactivity was intensely concentrated in the apical microvilli, and also homogeneously distributed in the cytoplasm (Fig. 5B,C). Some SGLT1-IR cells were characterized by the brush-like set of microvilli in their apical processes, with bundles of filaments extending deep into the cytoplasm without ending in the terminal web (Fig. 5D,E).
Fig. 5.
Immunoelectron microscopy showing expression of SGLT1 in solitary chemosensory cells of rat trachea. SGLT1 immunoreactive cells are pear- or flash-shaped cells with an apical process (A) with thin microvilli protruding into the lumen (B). Some cells are characterized by the brush-like set of microvilli in their apical process (D,E). Immunoreactivity is expressed throughout the entire cytoplasm (A,C,D), and in the apical microvilli (B,E). The boxed area in (D) is shown at higher magnification in (E). CC, ciliated cell; SCC, solitary chemosensory cell; ap, apical pole; m, microvilli; n, nucleus; *Brush-like set of microvilli. Scale bar: 2000 nm (A, C, D), 500 nm (B, E).
T1R3 labeling
Using immunohistochemistry and single-labeling immunofluorescence, T1R3 immunoreactivity was detected in some spots along the cilia and in the apical surface of ciliated cells (Fig. 6A–C). T1R3 immunostaning was also detected on the basolateral membrane of what appeared to be ciliated cells (Fig. 6C). In addition, some T1R3-IR cells with features of SCCs showed diffuse staining in the cytoplasm (Fig. 6D).
Fig. 6.
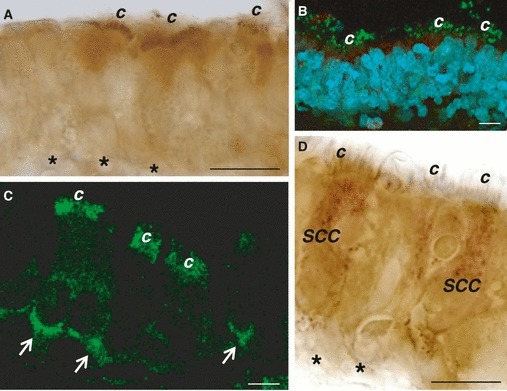
Immunoperoxidase (A,D) and immunofluorescent (green; B,C) staining showing T1R3 immunoreactivity in ciliated (A–C) and solitary chemosensory cells (D) of rat trachea. Nuclei are stained with DAPI (B). Ciliated cells show immunolabeling in the apical surface beneath the cilia (A), in some spots along the cilia (B,C), and on the basolateral membrane (arrow; C). Solitary chemosensory cells show diffuse immunolabeling in the cytoplasm. *Basement membrane; c, cilia; SCC, solitary chemosensory cell. Scale bar: 15 μm.
Coexpression of glucose transporters and T1R3 with α-tubulin
To identify the specific cell type that expressed glucose transporters and T1R3, we compared the glucose transporter expression with that of α-tubulin, a marker of the cilia axoneme. Experiments using laser scanning confocal microscopy demonstrated that all GLUT2-IR cells were also positive for α-tubulin, but not all α-tubulin-IR cells were GLUT2-IR (Fig. 7A–C). However, the immunostaining inside the positive cells was never colocalized, that for α-tubulin being found in the axoneme of the cilia and that for GLUT2 being located at the base of the cilia, in the apical membrane (Fig. 7D–F). No specific double-labeling was seen when the anti-GLUT2 antibody was preincubated with the corresponding antigen peptide (Fig. 7G–I).
Fig. 7.
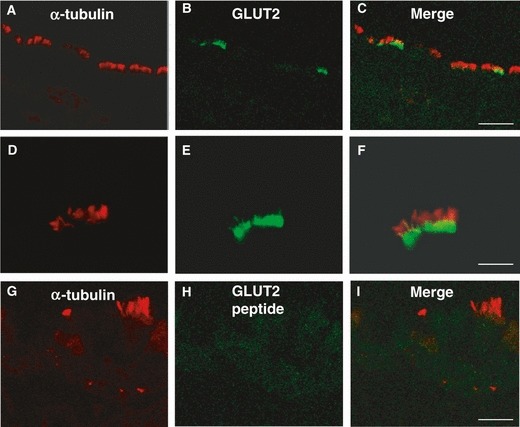
Double-immunofluorescent confocal microscopy showing expression of α-tubulin (red) with GLUT2 (green) in tracheal cells (A–F). The merge is represented in panels (C,F,I). Immunostaining for α-tubulin and GLUT2 in immunoreactive cells is never colocalized (D–F). Absence of labeling is observed when anti-GLUT2 antibody was preincubated with the control peptide (G–I). Scale bar: 30 μm (C), 20 μm (I), 10 μm (F).
When we compared α-tubulin and GLUT5 antibodies, we observed that all α-tubulin-IR cells lacked GLUT5 expression, confirming that GLUT5 was present exclusively in non-ciliated cells. Intense immunostaining for GLUT5 was found in the apical membrane of secretory cells (Fig. 8A–C), and in some basal cells (Fig. 8D–F).
Fig. 8.
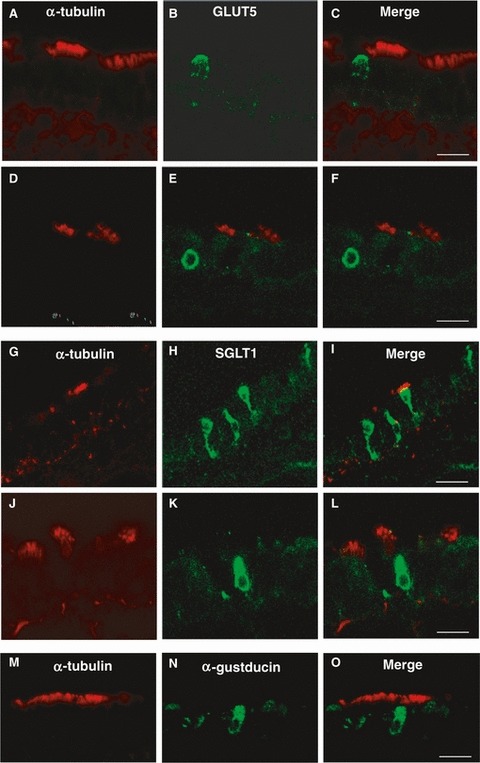
Double-immunofluorescent confocal microscopy showing expression of α-tubulin (red) with GLUT5 (green; A–F), or SGLT1 (green; G–L), or α-gustducin (green; M–O) in tracheal cells. The merge is represented in panels (C, F, I, L, O). GLUT5 immunoreactivity is observed in α-tubulin-negative cells identified as secretory cells (A–C) and in basal cells (D–F). SGLT1 and α-gustducin immunoreactivities are observed in α-tubulin-negative cells identified as solitary chemosensory cells (G–L and M–O, respectively). Scale bar: 30 μm (I), 20 μm (C,F,L,O).
In double fluorescent-labeled sections with α-tubulin and SGLT1, immunoreactivity for SGLT1 was observed in SCCs (Fig. 8G–L). The SGLT1 labeling pattern was homogeneously cytoplasmic and never colocalized with α-tubulin. Since SGLT1expression was detected exclusively in SCCs, we also compared as positive control the α-tubulin staining with that of α-gustducin, a well known marker of chemoreceptor cells. We observed that α-gustducin-IR cells showed location and appearance similar to SGLT1-IR cells, and consistently lacked α-tubulin expression (Fig. 8M–O).
The comparison of α-tubulin with T1R3 antibodies revealed that α-tubulin-IR cells were also T1R3-IR, with a labeling pattern that confirmed the ciliary localization of both the antibodies (Fig. 9A–F). In addition, T1R3 labeling was also located in the apical cytoplasm beneath the cilia, and on the basolateral membrane of ciliated cells (Fig. 9D–F). However, not all α-tubulin-IR cells were T1R3-IR and some T1R3-IR lacked α-tubulin immunoreactivity, supporting that T1R3 is not exclusively expressed by ciliated cells. No double-labeling was detected by omitting the α-tubulin antibody (Fig. 9G–I).
Fig. 9.
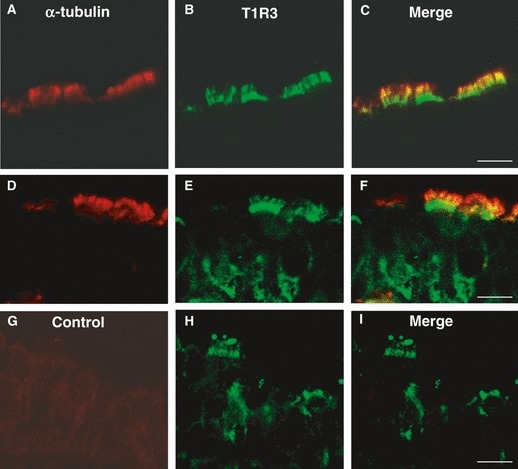
Double-immunofluorescent confocal microscopy showing expression of α-tubulin (red) with T1R3 (green) in tracheal cells. The merge is represented in panels (C,F,I). α-Tubulin and T1R3 are colocalized in some spots on the cilia (A–F). Labeling for T1R3 is also observed in the apical cytoplasm beneath the cilia, and on the basolateral membrane of ciliated cells (D–F). Double-labeling is not observed when anti-α-tubulin antibody was omitted (G–I). Scale bar: 20 μm (C), 10 μm (F,I).
Coexpression of glucose transporters with T1R3
To determine whether glucose transporter- and T1R3-IR cells included overlapping subsets, further double-labeling experiments were performed. Exposure to antibodies against GLUT2 and T1R3 revealed that all GLUT2-IR cells were also labeled for T1R3 in the apical surface of ciliated cells, but not all T1R3-IR cells were GLUT2-positive (Fig. 10A–F). The cilia were only T1R3-positive (Fig. 10D–F).
Fig. 10.
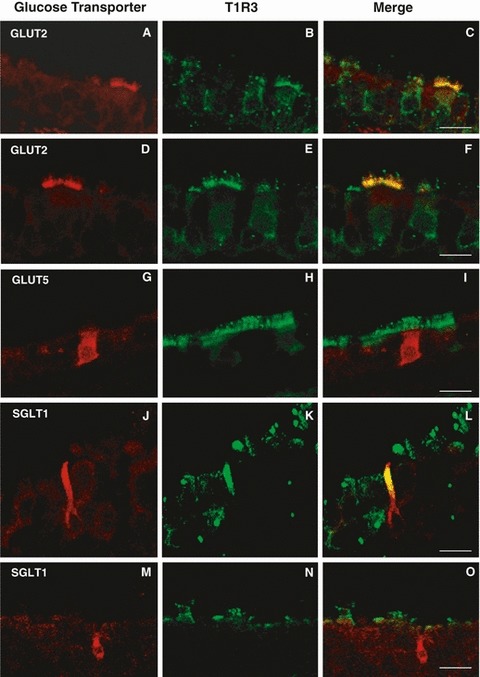
Double-immunofluorescent confocal microscopy showing expression of GLUT2 (red, A–F), or GLUT5 (red, G–I), or SGLT1 (red, J–O) with T1R3 (green) in tracheal cells. The merge is represented in panels (C,F,I,L,O). T1R3 and GLUT2 are colocalized beneath the apical membrane of ciliated cells (A–F). Labeling for GLUT5 is observed in solitary chemosensory cells which lack T1R3 expression (G–I). Labeling for SGLT1 is present in solitary chemosensory cells which are T1R3-positive (J–L) or T1R3-negative (M–O). Scale bar: 50 μm (O), 30 μm (C), 20 μm (F,I,L).
We also compared GLUT5 and T1R3 antibodies and observed that GLUT5 labeling was never colocalized with T1R3. In addition, we found that SCCs-IR for GLUT5 lacked T1R3 expression (Fig. 10G–I).
Subsequent double-labeling experiments with SGLT1 and T1R3 showed that some SCCs-IR for SGLT1 had overlapping sites of expression with T1R3 in the apical process (Fig. 10J–L), whereas others were only SGLT1-positive (Fig. 10M–O).
Discussion
The present study found that GLUT2, GLUT5, SGLT1 glucose transporters, and T1R3 are expressed in rat tracheal epithelium, in which they did not show a unique site of expression. In addition, the study provides the first evidence of T1R3 expression in ciliated cells. GLUT2 and T1R3 are predominantly expressed in subsets of SCCs and ciliated cells, GLUT5 in subsets of SCCs and in non-ciliated secretory and basal cells, and SGLT1 in SCCs.
Localization of glucose transporters and T1R3 in different cell types
SCCs
Using light and electron microscopy, we showed the expression of GLUT2, GLUT5, and SGLT1 in SCCs of the trachea, and confirmed that of T1R3, which had previously been demonstrated (Tizzano et al. 2011). T1R3 is a member of the T1R family which, along with the bitter taste receptor (T2R) family, are the receptors which perceive taste qualities in TRCs (Chandrashekar et al. 2006). T1R and T2R belong to the group of G protein-coupled receptors (GPCRs) which act through α-gustducin and PLCβ2 pathway to increase intracellular Ca2+ concentration (Nakagawa et al. 2009). α-Gustducin is a GTP-binding α subunit of a heterotrimeric G protein complex, and PLCβ2 is an essential enzyme for taste transduction that is activated by βγ subunits of G complex. GLUT2, GLUT5, and SGLT1 are the major glucose transporters of the intestinal epithelium (Drozdowski & Thomson, 2006), in which GLUT2 is normally located at the basolateral membrane, and GLUT5 and SGLT1 at the brush border membrane of enterocytes (Shirazi-Beechey et al. 2011). Recently, these transporters have also been reported in TRCs of the tongue in rodents, in which they were found to be selectively expressed in a subset of T1R3- or α-gustducin-IR cells (Merigo et al. 2011; Yee et al. 2011). The expression pattern of glucose transporters observed in SCCs was consistent with that detected in the TRCs of the tongue using the same antibodies and technique (Merigo et al. 2011).
Therefore, one possible explanation of the cytoplasmic pattern of the glucose transporters observed in SCCs is that it may reflect a cell-specific distribution, probably due to the glucose transporter pathway used by SCCs compared with other tracheal cells. Their intracellular location suggests that the glucose transporters may be the target for signals located in the cytoplasm.
Similar conclusions have been reached to explain the diffuse cytoplasmic immunostaning of signaling molecules such as T1R3 or α-gustducin, which are considered to be cell-surface proteins, in chemosensory cells of the intestine (Hofer et al. 1999; Mace et al. 2007).
It is well known that SCCs are equipped with taste-signaling molecules that resemble those operating in TRCs, including α-gustducin and T1R3 (Merigo et al. 2005; Tizzano et al. 2011), and that have been shown to be molecules of the chemosensory mechanism that modulate intestinal glucose transporter and sugar uptake in response to increases in luminal monosaccharides (Margolskee et al. 2007; Kellett et al. 2008; Stearns et al. 2010).
Along with these observations, our findings further support the idea that tracheal SCCs have many of the key molecules implicated in sugar uptake in intestinal cells. Clearly, future investigations could clarify whether the intestinal paradigm for glucose uptake may also be applied to tracheal SCCs.
It is noteworthy that SGLT1 is the only glucose transporter in the present study which appears to be exclusively expressed in a single cell type, that is, in SCCs. Using immunofluorescence data, a subset of SGLT1-IR cells was further characterized by the site of expression overlapping with that of T1R3 in the apical process. The immunostaining and the ultrastructural appearance of SGLT1-IR cells were reminiscent of the labeling pattern that we observed in a previous study for α-gustducin-IR cells in the trachea (Merigo et al. 2005), which are widely acknowledged to represent a subset of SCCs. In addition, the restricted expression observed here makes it plausible that SGLT1 may be a more general marker of chemoreceptive cells. In support of this, SGLT1 was observed to act as a glucose sensor in the intestine, able to mediate glucose-induced hormone secretion by itself, without depending on the T1R2/T1R3 sweet receptor, and to trigger the upregulation of GLUT2 (Moriya et al. 2009; Gorboulev et al. 2012).
Ciliated cells
Ciliated cells constitute the majority of cells lining the rat trachea and are involved in mucociliary clearance, removing mucus and inhaled particles from the lung (Wanner et al. 1996; Knowles & Boucher, 2002). Many ciliated cells have the apical surface enriched with microvilli, whose presence is associated with absorptive and transport functions.
By double immunofluorescence experiments, we showed that ciliated cells were T1R3- and GLUT2-IR. However, T1R3 and GLUT2 were selectively expressed, because not all ciliated cells were stained for these markers, suggesting that ciliated cells are a heterogeneous population with phenotypically different subsets. In addition, all GLUT2-IR cells coexpressed T1R3 but some T1R3-IR cells lacked GLUT2 expression, supporting the notion that GLUT2-IR cells are a subpopulation of T1R3-IR cells which in their turn are a subpopulation of ciliated cells.
T1R3 was expressed at different strategic locations: on the cilia, below the cilia in the apical cell pole, and on the basolateral membrane.
The T1R3 expression on the cilia is suggestive of chemosensory function because T1R3 is a subunit of sweet (T1R2/T1R3) and umami (T1R1/T1R3) receptors (Dyer et al. 2005), as well as of the homodimer (T1R3/T1R3) receptor which binds a high concentration of natural sugars (Zhao et al. 2003).
Thus, our finding raises the question whether these receptors are present on the airway cilia, which would make them capable of perceiving environmental signals, an ability which was long considered to be exclusive to primary cilia. The idea that motile cilia possess sensory proteins is corroborated by various studies, also conducted in airway epithelium (Bloodgood, 2010). It has been shown that the viscosity of the fluid bathing the airway modulated the ciliary beat frequency in relation to cytosolic Ca2+ levels, supporting the role of Ca2+ signaling in the sensory function (Johnson et al. 1991; Salathe, 2006). Recently, Shah et al. (2009) were able to demonstrate that bitter compounds increased ciliary beat frequency, acting with signaling mechanisms that parallel those used by TRCs of the tongue. In the same study, the expression of taste-signaling components such as T2R, α-gustducin, and TRPM5 was detected on the cilia, and expression of PLCβ2 in the apical pole of human airway epithelial cells. Considering that TRPM5, α-gustducin, and PLCβ2 are downstream signaling components common to the sweet, umami, and bitter transduction pathways which occur with GPCRs activation (Zhang et al. 2003; Margolskee et al. 2007), it seems likely that T2Rs and T1R3 are not the only protein sensors present on the cilia. Future investigations will verify this assumption which, if confirmed, will further extend the list of ASL compounds that can be perceived.
Beneath the apical membrane of ciliated cells we observed the coexpression of T1R3 and GLUT2, which had a more restricted distribution, being found only in the apical cell pole. This is the same site in which PLCβ2 was previously detected (Shah et al. 2009). T1R3 and GLUT2 co-presence is suggestive of the existence of GPCRs-mediated mechanism, as in intestinal cells and TRCs of the tongue, where the regulation of GLUT2 expression and activity has been shown to be effected by T1R2/T1R3 receptors and α-gustducin (Margolskee et al. 2007; Kellett et al. 2008; Stearns et al. 2010; Yee et al. 2011). Moreover, Mace et al. (2009) highlighted that multiple and integrated pathways mediated their effects on intestinal GLUT2 transport through a PLCβ2-dependent pathway, activated by signaling mechanisms arising from either sweet or umami receptors. On the basis of these observations, the subapical localization of T1R3 might be related to glucose transport regulation.
Finally, we found T1R3 immunostaining in the basal portion of ciliated cells, a finding which is in agreement with those in other non-gustatory tissues. T1R3 was recently observed on the basolateral membrane of pancreatic beta cells (Nakagawa et al. 2009), hypothalamic (Ren et al. 2009), and gastric cells (Hass et al. 2010), which were consequently taken to be strategic sites for monitoring glucose changes in the extracellular fluid. This interpretation applied to our results might imply that the ciliated cells respond not only to ASL stimuli, but also to those arising from the bloodstream.
Taken together, our data extend the phenotypical characterization of ciliated cells, which appear to be well equipped to operate via G-protein coupled taste receptors and their downstream signaling molecules, through mechanisms analogous to those known to occur in TRCs and in epithelia involved in the monitoring/uptake of the luminal content and in glucose sensing (i.e. intestinal epithelium and pancreatic β cells, respectively). The functional significance of T1R3 expression in more than one site on the ciliated cells requires further study.
Non-ciliated cells
In this research we observed intense immunostaining for GLUT5 in the apical membrane of non-ciliated epithelial cells (identified as secretory cells by their morphological characteristics) and in some basal cells. Although the paucity of data on GLUT5 presence in airway epithelium makes it impossible to draw any conclusions regarding the significance of GLUT5 expression in the trachea, the most likely hypothesis concerns control of fructose in ASL, since GLUT5 is its specific transporter. Recently, the simultaneous presence in subsets of secretory cells of chemosensory (i.e. α-gustducin and PLCβ2) and secretory (i.e. cystic fibrosis transmembrane regulator and Clara cell secretory protein) markers has been interpreted as an ability of these cells to respond to exogenous stimuli with secretory events, suggesting the possibility of ultra-short (intracellular) reflexes in the control of airway secretion (Merigo et al. 2007). Because GLUT5 expression is unique to this cell type, it could be useful to investigate its role in secretory function.
General conclusion
Although it is not yet clear what roles sugars have in the airway, the physiological function of glucose transporters is mainly associated with the maintenance of low sugar concentration in ASL (Mager & Sloan, 2003). This has been shown to preserve mucociliary clearance and to protect against bacterial colonization or infection in humans and rodents (Baker et al. 2006; Pezzulo et al. 2011). Elevated airway glucose concentration has been regarded as an expression of impaired glucose homeostasis, since experimental and clinical evidence shows that it correlates closely with blood hyperglycaemia (Wood et al. 2004; Clark et al. 2006), which increases paracellular diffusion of glucose from blood to ASL (Baker et al. 2006). A recent in vivo study highlighted an interesting regulatory effect of ASL glucose concentration on mucosal uptake, showing that increased absorption by the cells lining the tracheal lumen was caused by greater passive diffusion of glucose (Kalsi et al. 2008b), suggesting an ability of the mucosa to sense the glucose concentrations in ASL.
However, little is currently known about the mechanism involved in signal transmission from the ASL to the airway epithelium. Understanding of this mechanism would require knowledge of where and how sugar is sensed, and how changes in ASL glucose levels are communicated to the downstream signaling cascade. The presence of T1R3 and GLUT-transporters at the apical membrane of tracheal cells implies that the effective local glucose/hexose concentrations may be in the range of sugar receptor and transporter activity. The determination of such concentrations can be an important key to understanding the role of glucose transporters and receptors on glucose homeostasis in ASL. Close matching found between glucose transporter expression and luminal sugar content in the intestine contributed to the emergence of many aspects of the regulation and activity of glucose transporters (Kellett & Brot-Laroche, 2005; Dyer et al. 2007). Similarly, we believe that the current findings may contribute to clearer identification of some of the players which take part in sugar uptake in the trachea. The diagram in Fig. 11 summarizes the cellular distribution of glucose transporters and T1R3 that we observed. Because of their T1R3 expression, SCCs and ciliated cells are the candidates most likely to participate in the chemosensory process in ASL.
Fig. 11.
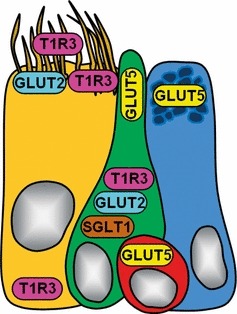
The diagram shows a simplified summary of glucose transporters (GLUT2, GLUT5, SGLT1) and T1R3 immunolocalization in different cell types of rat tracheal epithelium. Each cell type is indicated by a specific color: ciliated cell is represented in yellow, solitary chemosensory cell in green, basal cell in red, and secretory cell in light blue. Cell nuclei are colored in gray.
Many intriguing roles are now emerging for chemoreception, on the basis of evidence that taste transduction signaling pathways function in different cell types of various epithelia, including the airway (Sbarbati et al. 2010). Clearly, the final outcomes of these mechanisms are not only perception of taste qualities but also regulation of different functions such as secretion, absorption, and defense, depending on the cellular/environmental context in which these mechanisms occur (Kinnamon & Reynolds, 2009; Finger & Kinnamon, 2011; Kinnamon, 2012).
In conclusion, the cell-specific expression of T1R3 and glucose transporters (GLUT2, GLUT5, SGLT1) in the trachea resembles that observed in TRCs and intestinal cells, and probably reflects the different functional contribution of each cell type to the control of glucose homeostasis.
Acknowledgments
The authors thank Christine Harris for revising the manuscript.
References
- Alexander I, Ritchie BC, Maloney JE, et al. Epithelial surfaces of the trachea and principal bronchi in the rat. Thorax. 1975;30:171–177. doi: 10.1136/thx.30.2.171. [DOI] [PMC free article] [PubMed] [Google Scholar]
- Baker EH, Wood DM, Brennan AL, et al. Hyperglycaemia and pulmonary infection. Proc Nutr Soc. 2006;65:227–235. doi: 10.1079/pns2006499. [DOI] [PubMed] [Google Scholar]
- Barker PM, Boyd CA, Ramsden CA, et al. Pulmonary glucose transport in the fetal sheep. J Physiol. 1989;409:15–27. doi: 10.1113/jphysiol.1989.sp017482. [DOI] [PMC free article] [PubMed] [Google Scholar]
- Basset G, Crone C, Saumon G. Fluid absorption by rat lung in situ: pathways for sodium entry in the luminal membrane of alveolar epithelium. J Physiol. 1987;384:325–345. doi: 10.1113/jphysiol.1987.sp016457. [DOI] [PMC free article] [PubMed] [Google Scholar]
- Bloodgood RA. Sensory reception is an attribute of both primary cilia and motile cilia. J Cell Sci. 2010;123:529–536. doi: 10.1242/jcs.066308. [DOI] [PubMed] [Google Scholar]
- Chandrashekar J, Hoon MA, Ryba NJ, et al. The receptors and cells for mammalian taste. Nature. 2006;444:288–294. doi: 10.1038/nature05401. [DOI] [PubMed] [Google Scholar]
- Charon JP, McCornick J, Mehta A, et al. Characterization of sodium-dependent glucose transport in sheep tracheal epithelium. Am J Physiol. 1994;267:L390–L397. doi: 10.1152/ajplung.1994.267.4.L390. [DOI] [PubMed] [Google Scholar]
- Clark N, Wood DM, Fisher DA, et al. Effect of changes in blood glucose concentration on glucose concentration of lower airway secretions sampled by exhaled breath condensate. Thorax. 2006;60:ii87. [Google Scholar]
- Devaskar SU, deMello DE. Cell-specific localization of glucose transporter proteins in mammalian lung. J Clin Endocrinol Metab. 1996;81:4373–4378. doi: 10.1210/jcem.81.12.8954044. [DOI] [PubMed] [Google Scholar]
- Drozdowski LA, Thomson AB. Intestinal sugar absorption. World J Gastroenterol. 2006;12:1657–1670. doi: 10.3748/wjg.v12.i11.1657. [DOI] [PMC free article] [PubMed] [Google Scholar]
- Dyer J, Salmon KSH, Zibrik L, et al. Expression of sweet taste receptors of the T1R family in the intestinal tract and enteroendocrine cells. Biochem Soc Trans. 2005;33:302–305. doi: 10.1042/BST0330302. [DOI] [PubMed] [Google Scholar]
- Dyer J, Daly K, Salmon KS, et al. Intestinal glucose sensing and regulation of intestinal glucose absorption. Biochem Soc Trans. 2007;35:1191–1194. doi: 10.1042/BST0351191. [DOI] [PubMed] [Google Scholar]
- Finger TE, Kinnamon SC. Taste isn’t just for taste buds anymore. F1000 Biol Rep. 2011;3:20. doi: 10.3410/B3-20. [DOI] [PMC free article] [PubMed] [Google Scholar]
- Gorboulev V, Schurmann A, Vallon V, et al. Na+-d-glucose cotransporter SGLT1 is pivotal for intestinal glucose absorption and glucose-dependent incretin secretion. Diabetes. 2012;61:187–196. doi: 10.2337/db11-1029. [DOI] [PMC free article] [PubMed] [Google Scholar]
- Hass N, Schwarzenbacher K, Breer H. T1R3 is expressed in brush cells and ghrelin-producing cells of murine stomach. Cell Tissue Res. 2010;339:493–504. doi: 10.1007/s00441-009-0907-6. [DOI] [PubMed] [Google Scholar]
- Hofer D, Asan E, Drenckhahn D. Chemosensory perception in the gut. News Physiol Sci. 1999;14:18–23. doi: 10.1152/physiologyonline.1999.14.1.18. [DOI] [PubMed] [Google Scholar]
- Jeffery PK, Reid L. New observations of rat airway epithelium: a quantitative and electron microscopic study. J Anat. 1975;120:295–320. [PMC free article] [PubMed] [Google Scholar]
- Johnson N, Villalon M, Royce FH, et al. Autoregulation of beat frequency in respiratory ciliated cells. Demonstration by viscous loading. Am Rev Respir Dis. 1991;144:1091–1094. doi: 10.1164/ajrccm/144.5.1091. [DOI] [PubMed] [Google Scholar]
- Joris L, Quinton PM. Evidence for electrogenic Na-glucose cotransport in tracheal epithelium. Pflugers Arch. 1989;415:118–120. doi: 10.1007/BF00373149. [DOI] [PubMed] [Google Scholar]
- Kalsi KK, Baker EH, Fraser O, et al. Glucose homeostasis across human airway epithelial cell monolayers: role of diffusion, transport and metabolism. Pflugers Arch. 2008a;457:1061–1070. doi: 10.1007/s00424-008-0576-4. [DOI] [PubMed] [Google Scholar]
- Kalsi KK, Baker EH, Medina RA, et al. Apical and basolateral localisation of GLUT2 transporters in human lung epithelial cells. Pflugers Arch. 2008b;456:991–1003. doi: 10.1007/s00424-008-0459-8. [DOI] [PMC free article] [PubMed] [Google Scholar]
- Kaske S, Krasteva G, König P, et al. TRPM5, a taste-signaling transient receptor potential ion-channel, is a ubiquitous signaling component in chemosensory cells. BMC Neuroscience. 2007;8:49. doi: 10.1186/1471-2202-8-49. [DOI] [PMC free article] [PubMed] [Google Scholar]
- Kellett GL, Brot-Laroche E. Apical GLUT2: a major pathway of intestinal sugar absorption. Diabetes. 2005;54:3056–3062. doi: 10.2337/diabetes.54.10.3056. [DOI] [PubMed] [Google Scholar]
- Kellett GL, Brot-Laroche E, Mace OJ, et al. Sugar absorption in the intestine: the role of GLUT2. Annl Rev Nutr. 2008;28:35–54. doi: 10.1146/annurev.nutr.28.061807.155518. [DOI] [PubMed] [Google Scholar]
- Kinnamon SC. Taste receptor signalling – from tongues to lungs. Acta Physiol. 2012;204:158–168. doi: 10.1111/j.1748-1716.2011.02308.x. [DOI] [PMC free article] [PubMed] [Google Scholar]
- Kinnamon SC, Reynolds SD. Using taste to clear the air (ways) Science. 2009;325:1081–1082. doi: 10.1126/science.1179180. [DOI] [PubMed] [Google Scholar]
- Knowles MR, Boucher RC. Mucus clearance as a primary innate defense mechanism for mammalian airways. J Clin Invest. 2002;109:571–577. doi: 10.1172/JCI15217. [DOI] [PMC free article] [PubMed] [Google Scholar]
- Lewis Carl SA, Gillete-Ferguson I, Ferguson DG. An indirect immunofluorescence procedure for staining the same cryosection with two mouse monoclonal primary antibodies. J Histochem Cytochem. 1993;41:1273–1278. doi: 10.1177/41.8.7687266. [DOI] [PubMed] [Google Scholar]
- Mace OJ, Affleck J, Patel N, et al. Sweet taste receptors in rat small intestine stimulate glucose absorption through apical GLUT2. J Physiol. 2007;582:379–392. doi: 10.1113/jphysiol.2007.130906. [DOI] [PMC free article] [PubMed] [Google Scholar]
- Mace OJ, Lister N, Morgan E, et al. An energy supply network of nutrient absorption coordinated by calcium and T1R taste receptors in rat small intestine. J Physiol. 2009;587:195–210. doi: 10.1113/jphysiol.2008.159616. [DOI] [PMC free article] [PubMed] [Google Scholar]
- Mager S, Sloan J. Possible role of amino acids, peptides, and sugar transporter in protein removal and innate lung defense. Eur J Pharmacol. 2003;479:263–267. doi: 10.1016/j.ejphar.2003.08.075. [DOI] [PubMed] [Google Scholar]
- Margolskee RF, Dyer J, Kokrashvili Z, et al. T1R3 and gustducin in gut sense sugar to regulate expression of Na+-glucose cotransporter 1. Proc Natl Acad Sci U S A. 2007;104:15075–15080. doi: 10.1073/pnas.0706678104. [DOI] [PMC free article] [PubMed] [Google Scholar]
- Marin ML, Lane BP, Gordon RE, et al. Ultrastructure of rat tracheal epithelium. Lung. 1979;156:223–236. doi: 10.1007/BF02714016. [DOI] [PubMed] [Google Scholar]
- Matsui H, Randell SH, Perretti SW, et al. Coordinated clearance of periciliary liquid and mucus from airway surfaces. J Clin Invest. 1998;102:1125–1131. doi: 10.1172/JCI2687. [DOI] [PMC free article] [PubMed] [Google Scholar]
- Merigo F, Benati D, Tizzano M, et al. α-Gustducin immunoreactivity in the airways. Cell Tissue Res. 2005;319:211–219. doi: 10.1007/s00441-004-1007-2. [DOI] [PubMed] [Google Scholar]
- Merigo F, Benati D, Di Chio M, et al. Secretory cells of the airway express molecules of the chemoreceptive cascade. Cell Tissue Res. 2007;327:231–247. doi: 10.1007/s00441-006-0280-7. [DOI] [PubMed] [Google Scholar]
- Merigo F, Benati D, Cristofoletti M, et al. Glucose transporters are expressed in taste receptor cells. J Anat. 2011;219:243–252. doi: 10.1111/j.1469-7580.2011.01385.x. [DOI] [PMC free article] [PubMed] [Google Scholar]
- Moriya R, Shirakura T, Ito J, et al. Activation of sodium-glucose cotransporter 1 ameliorates hyperglycemia by mediating incretin secretion in mice. Am J Physiol Endocrinol Metab. 2009;297:E1358–E1365. doi: 10.1152/ajpendo.00412.2009. [DOI] [PubMed] [Google Scholar]
- Mueckler M. Facilitative glucose transporters. Eur J Biochem. 1994;219:713–725. doi: 10.1111/j.1432-1033.1994.tb18550.x. [DOI] [PubMed] [Google Scholar]
- Nakagawa Y, Nakagawa M, Yamada S, et al. Sweet taste receptor expressed in pancreatic beta-cells activates the calcium and cyclic AMP signaling systems and stimulates insulin secretion. PLoS One. 2009;4:e5106. doi: 10.1371/journal.pone.0005106. [DOI] [PMC free article] [PubMed] [Google Scholar]
- Negoescu A, Labat-Moleur F, Lorimier P, et al. F(ab) secondary antibodies : a general method for double immunolabeling with primary antisera from the same species. Efficiency control by chemiluminescence. J HistochemCytochem. 1994;42:433–437. doi: 10.1177/42.3.7508473. [DOI] [PubMed] [Google Scholar]
- Oelberg DG, Xu F, Shabarek F. Sodium-coupled transport of glucose by plasma membranes of type II pneumocytes. Biochim Biophys Acta. 1994;1194:92–98. doi: 10.1016/0005-2736(94)90206-2. [DOI] [PubMed] [Google Scholar]
- Pezzulo AA, Gutierrez J, Duschner KS, et al. Glucose depletion in the airway surface liquid is essential for sterility of the airways. PLoS One. 2011;6:e16166. doi: 10.1371/journal.pone.0016166. [DOI] [PMC free article] [PubMed] [Google Scholar]
- de Prost N, Saumon G. Glucose transport in the lung and its role in liquid movement. Respir Physiol Neurobiol. 2007;159:331–337. doi: 10.1016/j.resp.2007.02.014. [DOI] [PubMed] [Google Scholar]
- Ren X, Zhou L, Terwilliger R, et al. Sweet taste signaling functions as a hypothalamic glucose sensor. Front Integr Neurosci. 2009;3:12. doi: 10.3389/neuro.07.012.2009. [DOI] [PMC free article] [PubMed] [Google Scholar]
- Salathe M. Regulation of mammalian ciliary beating. Ann Rev Physiol. 2006;69:401–422. doi: 10.1146/annurev.physiol.69.040705.141253. [DOI] [PubMed] [Google Scholar]
- Saumon G, Dreyfuss D. Luminal glucose enhances transepithelial Na+ and fluid transports in rat lungs. Pflugers Arch. 1991;417:571–576. doi: 10.1007/BF00372953. [DOI] [PubMed] [Google Scholar]
- Saumon G, Martet G. Effect of changes in paracellular permeability on airspace liquid clearance: role of glucose transport. Am J Physiol. 1996;270:L191–L198. doi: 10.1152/ajplung.1996.270.2.L191. [DOI] [PubMed] [Google Scholar]
- Saumon G, Seignè E, Clerici C. Evidence for a sodium-dependent sugar transport in rat tracheal epithelium. Biochim Biophys Acta. 1990;1023:313–318. doi: 10.1016/0005-2736(90)90121-4. [DOI] [PubMed] [Google Scholar]
- Saumon G, Martet G, Loiseau P. Glucose transport and equilibrium across alveolar-airway barrier of rat. Am J Physiol. 1996;270:L183–L190. doi: 10.1152/ajplung.1996.270.2.L183. [DOI] [PubMed] [Google Scholar]
- Sbarbati A, Osculati F. Solitary chemosensory cells in mammals? Cell Tissues Organs. 2003;175:51–55. doi: 10.1159/000073437. [DOI] [PubMed] [Google Scholar]
- Sbarbati A, Osculati F. The taste cell-related diffuse chemosensory system. Prog Neurobiol. 2005;75:295–307. doi: 10.1016/j.pneurobio.2005.03.001. [DOI] [PubMed] [Google Scholar]
- Sbarbati A, Bramanti P, Benati D, et al. The diffuse chemosensory system: exploring the iceberg toward the definition of functional roles. Prog Neurobiol. 2010;91:77–89. doi: 10.1016/j.pneurobio.2010.01.010. [DOI] [PubMed] [Google Scholar]
- Shah AS, Ben-Shahar Y, Moninger TO, et al. Motile cilia of human airway epithelia are chemosensory. Science. 2009;325:1131–1132. doi: 10.1126/science.1173869. [DOI] [PMC free article] [PubMed] [Google Scholar]
- Shirazi-Beechey SP, Moran AW, Batchelor DJ, et al. Glucose sensing and signalling; regulation of intestinal glucose transport. Proc Nutr Soc. 2011;70:185–193. doi: 10.1017/S0029665111000103. [DOI] [PubMed] [Google Scholar]
- Stearns AT, Balakrishnan A, Rhoads DB, et al. Rapid upregulation of sodium-glucose transporter SGLT1 in response to intestinal sweet taste stimulation. Ann Surg. 2010;251:865–871. doi: 10.1097/SLA.0b013e3181d96e1f. [DOI] [PMC free article] [PubMed] [Google Scholar]
- Thorens B, Mueckler H. Glucose transporters in the 21st century. Am J Physiol Endocrinol Metab. 2010;298:E141–E145. doi: 10.1152/ajpendo.00712.2009. [DOI] [PMC free article] [PubMed] [Google Scholar]
- Tizzano M, Merigo F, Sbarbati A. Evidence of solitary chemosensory cells in a large mammal: the diffuse chemosensory system in Bos Taurus airway. J Anat. 2006;209:333–337. doi: 10.1111/j.1469-7580.2006.00617.x. [DOI] [PMC free article] [PubMed] [Google Scholar]
- Tizzano M, Cristofoletti M, Sbarbati A, et al. Expression of taste receptors in solitary chemosensory cells of rodent airway. BMC Pulmonary Med. 2011;11:3. doi: 10.1186/1471-2466-11-3. [DOI] [PMC free article] [PubMed] [Google Scholar]
- Wanner A, Salathe M, O’Riordan TG. Mucociliary clearance in the airways. Am J Respir Crit Care Med. 1996;154:1868–1902. doi: 10.1164/ajrccm.154.6.8970383. [DOI] [PubMed] [Google Scholar]
- Widdicombe JH. Regulation of the depth and composition of airway surface liquid. J Anat. 2002;201:313–318. doi: 10.1046/j.1469-7580.2002.00098.x. [DOI] [PMC free article] [PubMed] [Google Scholar]
- Wood DM, Brennan AL, Philips BJ, et al. Effect of hyperglycaemia on glucose concentration of human nasal secretions. Clin Sci. 2004;106:527–533. doi: 10.1042/CS20030333. [DOI] [PubMed] [Google Scholar]
- Yee KK, Sukumaran SK, Kotha R, et al. Glucose transporters and ATP-gated K+ (KATP) metabolic sensors are present in type 1 taste receptor 3 (T1r3)-expressing taste cells. PNAS. 2011;29:5431–5436. doi: 10.1073/pnas.1100495108. [DOI] [PMC free article] [PubMed] [Google Scholar]
- Zhang Y, Hoon MA, Chandrashekar J, et al. Coding of sweet, bitter, and umami tastes: different receptor cells sharing similar signaling pathways. Cell. 2003;112:293–301. doi: 10.1016/s0092-8674(03)00071-0. [DOI] [PubMed] [Google Scholar]
- Zhao GQ, Zhang Y, Hoon MA, et al. The receptors for mammalian sweet and umami taste. Cell. 2003;115:255–266. doi: 10.1016/s0092-8674(03)00844-4. [DOI] [PubMed] [Google Scholar]