

Here we establish the utility of a recently described perturbative method to study complex regulatory circuits in vivo. By combining rapid modulation of single TFs under physiological conditions with genome-wide expression analysis, we elucidate several novel regulatory features within the pathways of sulfur assimilation and beyond.
Abstract
In yeast, the pathways of sulfur assimilation are combinatorially controlled by five transcriptional regulators (three DNA-binding proteins [Met31p, Met32p, and Cbf1p], an activator [Met4p], and a cofactor [Met28p]) and a ubiquitin ligase subunit (Met30p). This regulatory system exerts combinatorial control not only over sulfur assimilation and methionine biosynthesis, but also on many other physiological functions in the cell. Recently we characterized a gene induction system that, upon the addition of an inducer, results in near-immediate transcription of a gene of interest under physiological conditions. We used this to perturb levels of single transcription factors during steady-state growth in chemostats, which facilitated distinction of direct from indirect effects of individual factors dynamically through quantification of the subsequent changes in genome-wide patterns of gene expression. We were able to show directly that Cbf1p acts sometimes as a repressor and sometimes as an activator. We also found circumstances in which Met31p/Met32p function as repressors, as well as those in which they function as activators. We elucidated and numerically modeled feedback relationships among the regulators, notably feedforward regulation of Met32p (but not Met31p) by Met4p that generates dynamic differences in abundance that can account for the differences in function of these two proteins despite their identical binding sites.
INTRODUCTION
Transcription at individual genes is strongly influenced by transcription factors (TFs) that can facilitate either the recruitment or blocking of the RNA polymerase machinery. In eukaryotes, the presence of multiple binding sites for different TFs results in combinatorial regulation in which multiple inputs coordinate to produce a particular output. Accessing the presence and significance of these combinatorially regulated networks presents us with a fundamental challenge. Recent studies have quantified in vitro affinities (Zhu et al., 2009) and elucidated detailed in vivo maps of transcription factor binding within intergenic regions in yeast (Harbison et al., 2004; MacIsaac et al., 2006). Network maps of in vivo binding provide a static snapshot of local regulatory architecture, and there is only a 3% overlap between genes with promoter TF occupancy and genes that change expression levels in response to that TF knockout (Hu et al., 2007); thus nearly all of the previously observed differential expression is due to secondary (i.e., indirect) genetic interactions.
Experimentally, we believe that the best way to infer the structure and dynamics of intracellular networks is to perturb one element followed by a comprehensive assessment of other network elements. The ideal growth setting for such experiments is in a chemostat, where cells can be grown to steady state at a specified growth rate before a perturbation. This is in contrast to large-scale deletion studies, which are usually done under conditions of batch growth. Some years ago we had success with this approach, using a change in carbon source to provide the perturbation from steady state (Ronen and Botstein, 2006), allowing us to model a few elements of the very complex network that controls carbon assimilation in yeast, despite the large number of genes whose expression was altered. Recently we introduced improved methodologies that allow us to rapidly perturb the levels of individual genes and proteins in vivo under physiological conditions (McIsaac et al., 2011b), including steady-state growth in a chemostat. This makes it possible to quantify the input/output relationships between single TFs and their genome-wide targets under physiologically diverse conditions more directly than is possible by nutrient switching. We expect that in vivo kinetic studies using this design—coupled with appropriate bioinformatic analyses—will greatly improve our ability to identify the presence of both direct and indirect effects of single TFs.
As a first application of these ideas, we chose to focus on the five transcription factors that coordinate the expression of the combinatorially regulated genes in yeast (Saccharomyces cerevisiae) that control the pathway of sulfur assimilation that leads to the biosynthesis of methionine (referred to as the Met pathway). In an accompanying paper (Petti et al., 2012) we present a detailed functional genomic study of this complex regulatory network, highlighting the extensive influence of the Met regulators on metabolism and physiology beyond methionine and S-adenosyl methionine (SAM). Our goal here is to see whether our new experimental design could add significantly to our understanding of this complex combinatorial regulatory system.
The DNA-binding proteins Met31p, Met32p, and Cbf1p, along with the cofactor Met28p, target the strong transcriptional activator Met4p to the promoters of the sulfur metabolic genes (Kuras et al., 1996; Blaiseau et al., 1997). The paralogous DNA-binding proteins Met31p and Met32p contain zinc finger domains that recognize the sequence AAACTGTGG (Blaiseau et al., 1997). Cbf1p is a basic helix-loop-helix (bHLH)–containing protein that forms a homodimer to bind to the E-box consensus sequence CACGTG (Dowell et al., 1992). The sulfur metabolic genes contain either one or both types of cis regulatory elements in their promoters (Lee et al., 2010). In addition to the combinatorial regulation of the sulfur metabolic genes at the DNA sequence level, Met4p itself can be ubiquitinated by the ubiquitin ligase SCFMet30 (which contains the product of the MET30 gene) and is either degraded or maintained in an inactive state (Kaiser et al., 2000; Rouillon et al., 2000). Met4p regulates the degradation of its own DNA-binding cofactors Met31p, Met32p, and Cbf1p by targeting them to SCFMet30 (Ouni et al., 2010).
In a recent study, Lee et al. (2010) defined the Met4p core regulon, which consists of 45 genes that are induced under conditions of Met4p hyperactivation or sulfur limitation. Expression from all core regulon genes is eliminated in met31∆met32∆ or met4∆ strains, whereas met28∆ and cbf1∆ eliminate expression only from a subset of genes. Siggers et al. (2011) showed that the promoters of genes whose induction by Met4p is Cbf1p-dependent are enriched for a Cbf1p-binding E-box motif (CACGTG) flanked by a 2–base pair spacer and nucleotide sequence RYAAT. The RYAAT motif enhances Met4p-Met28p-Cbf1p binding to DNA in vitro and enhances transcription in vivo. This study demonstrated that a small DNA moiety surrounding a core motif can play an integral role in recruiting a specific protein complex to a promoter.
While strains containing a deletion of CBF1, MET28, or MET4 require methionine to be supplemented to the medium for growth, it takes a deletion of both MET31 and MET32 to confer methionine auxotrophy (Blaiseau et al., 1997). Met31p and Met32p are commonly labeled mutually redundant because they are 46% identical in amino acid sequence; however, met32∆ rescues the lethality of met30∆, whereas met31∆ does not (Patton et al., 2000), suggesting that Met31p and Met32p have subfunctionalized. More detailed differences in gene expression are found in Petti et al. (2012), but the full extent of the differences in their function remains to be determined. The primary role of Met28p appears to be to strengthen the interaction between the DNA binders (Cbf1p, Met31p, and Met32p) and Met4p to form a stable DNA-binding complex (Kuras et al., 1996, 1997; Blaiseau and Thomas, 1998). Cbf1p, originally identified as a centrosome-binding protein, binds to ∼300 promoter regions (Teixeira et al., 2006) in the yeast genome and is required for chromosome maintenance in addition to regulation of the sulfur metabolic genes. Loss of Cbf1p results in a 10-fold increase in chromosome loss (Cai and Davis, 1990). Yeast two-hybrid screens indicate that Aft1p (a TF that regulates iron-related genes with Aft2p) and Cbf1p interact at the protein level (Measday et al., 2005). Deletion of both genes results in a synthetically sick phenotype, illustrating that incoherence in the regulation of sulfur and iron metabolic processes results in a strong fitness defect, even under nutrient-replete conditions (Measday et al., 2005).
We developed a strategy to study the regulatory consequences of a specific type of genetic perturbation in the regulation of the Met pathway: the induction of a single TF. This strategy allows us to estimate the strength of regulation, determine whether the regulation is positive or negative, and provides temporal information, all of which can reveal potentially novel regulatory networks (Figure 1). We constructed individual strains that can rapidly induce CBF1, MET31, MET32, MET28, or MET4 by replacing the native promoter with a derivative of the GAL1 promoter, preventing expression because the strains also lack the gene required for induction of the GAL1 promoter by galactose. These strains constitutively produce the chimeric transcriptional activator Gal4dbd.ER.VP16 (GEV), which localizes to the nucleus in the presence of the hormone β-estradiol and binds to UASGAL sequences in the GAL1 promoter to activate transcription. GEV affects the expression levels (greater than twofold) of 129 genes during a 90-min experiment (Supplemental Figure S1). The PGAL1-driven allele can be rapidly induced in a near switch-like manner, showing high levels of transcript within 5 min after addition of β-estradiol to the growth medium (McIsaac et al., 2011b). Using chemostats, we can limit growth by a single nutrient and investigate the action of TFs under precise and reproducible environmental conditions.
FIGURE 1:
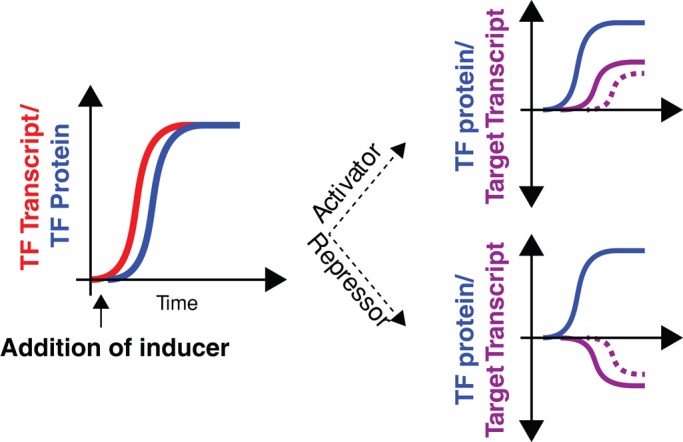
Schematic of TF induction experiments. Before the addition of the inducer β-estradiol to the culture medium, PGAL1-TF alleles are not expressed. Following inducer addition, TF transcript is rapidly made within 5 min (red). Following translation, the TF (blue) can act as either an activator or a repressor in a direct (solid line, purple) or indirect (dashed line, purple) manner.
Computational methods based on singular value decomposition (SVD) were used to remove the variance in the expression data not due to the factors themselves (Alter et al., 2000) and subsequently identify the remaining major sources of variation in the data. We show that by hierarchical clustering of the data, we are able to identify distinct clusters of genes that respond in both overlapping and distinct ways in response to induction of the TFs. Different gene clusters correlate with different variants of the Met31p/Met32p and Cbf1p binding motifs. To our surprise, there is a set of genes that are induced specifically by Cbf1p and not by Met4p, and many of these genes are direct Cbf1p targets. We identify extensive subfunctionalization of Met31p and Met32p: 92 genes display differential (and often divergent) responses to induction of Met31p or Met32p. We use modeling and numerical simulations to explain the temporal response of a subset of genes in the data set.
RESULTS
To study the response of single TFs, we constructed β-estradiol–inducible alleles of CBF1, MET31, MET32, MET28, or MET4, each in a met6Δ background. For reasons described in detail before (Petti et al., 2011), we deleted the MET6 gene (encoding methionine synthetase) to provide a clean biochemical methionine requirement. Each of these strains was grown to steady state under methionine limitation. Cells were harvested at t = 0, 2.5, 5, 15, 30, 45, 60, and 90 min after TF induction by β-estradiol, and the genome-wide transcriptional response was followed using gene expression microarrays (see Materials and Methods). For initial analysis, expression data from these experiments were analyzed using unsupervised hierarchical clustering with the Pearson correlation distance as a measure of similarity between genes (Eisen et al., 1998). With this metric, genes with similar expression “shapes” are clustered together. This is significant because gene expression changes occur in response to rapid induction of the TFs chosen for study. Thus the time dependences of the responses characteristic of a particular type of regulation between a TF and those genes can be readily distinguished by clustering. In this way, we identified nine highly coherent gene expression clusters in our data for initial study (Figure 2).
FIGURE 2:

Gene expression analysis. Data from CBF1, MET31, MET32, MET28, MET4, and GEV-only (control) induction experiments (triangles above the heatmap represent time in the individual experiments). Lowly expressed genes were first removed from the data set, leaving 756 genes for analysis. We removed expression due to the GEV gene expression system by performing an SVD of the control (strain DBY12142) time course and projecting out the variation in the direction of the eigenarrays (i.e., the left eigenvectors of the SVD decomposition). After the control signal was removed, the data were hierarchically clustered. Particular expression clusters are numbered to the right and marked with colored stripes. The cluster marked with an asterisk contains mating genes: the strain used for Met31p induction is MATa, whereas all other strains are MATα. Promoters (−1 to −800 base pairs from the ATG) of genes in the nine clusters were obtained from the RSAT database (Thomas-Chollier et al., 2008). The presence and variation of Met31p/Met32p and Cbf1p core motifs within these promoters were determined using the MEME algorithm.
Variation in TF-binding motifs is reflected in patterns of gene expression after induction
We found that six of the nine gene expression clusters are enriched for variants of the core binding motifs of Met31p/Met32p, Cbf1p, or both (Figure 2), as defined previously (Harbison et al., 2004; Zhu et al., 2009; Lee et al., 2010). Clusters 6–9 contain the genes responsible for sulfur/methionine metabolic processes and are enriched for E-box and Met31p/Met32p core motifs. In cluster 9, the Met31p/Met32p core motif is not enriched for the cytosine in its last position observed previously, and these genes are activated in response to Cbf1p, Met28p, or Met4p induction. Promoters of these genes are also enriched for the RYAATNTCACGTG motif, similar to that reported in Siggers et al. (2011). Clusters 7 and 8, which are strongly induced in response to induction of Met32p or Met4p, are enriched for the Met31p/Met32p core motif but not that of Cbf1p. Conversely, genes in clusters 3 and 5, which are repressed or activated in response to induction of Cbf1p, respectively, contain enrichment for the Cbf1p E-Box motif (albeit with minor surrounding variation) but not the Met31p/Met32p core motif. Thus variations either in the sequence surrounding the core motifs or within the core motifs themselves appear to correlate with variations in gene expression.
Global structure of transcriptional patterns
The global structure of the transcriptional patterns was analyzed by SVD (Alter et al., 2000; Figure 3A). The fraction of the total variance in gene expression explained by the jth eigengene (i.e., the jth right eigenvector of the SVD decomposition) equals 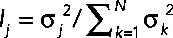 , where σj denotes the jth singular value and N is the total number of eigengenes (in this case, N = 40). We find that the first three eigengenes account for 77% of the variance, and that each of these captures an important and distinct feature of the Met pathway regulatory network. Eigengene 1 shows that Met4p induction has the largest transcriptional impact on the cells (Figure 3) and accounts for 45% of the variance (Figure 3B). Eigengene 2 shows that when Cbf1p, Met28p, or Met4p is induced, a roughly similar response is observed; it accounts for 21% of the variance (Figure 3B). Eigengene 3 shows an anticorrelated response when Met31p and Met32p are induced and accounts for 11% of the variance (Figure 3B). It is worth pointing out that these observations distinguish the activities of the Met pathway regulators and provide support to (and sometimes extend) results we found when individual regulators were deleted (Petti et al., 2012).
FIGURE 3:

Singular value decomposition (SVD) of mean-centered gene expression data. (A) Forty eigengenes. (B) Information content of eigengenes. (C) The eigenexpression of the three most significant eigengenes.
Some genes are activated and others are repressed by Cbf1p
Whereas cluster 9 contains sulfur metabolic genes whose expression rises when Cbf1p, Met28p, or Met4p is induced, cluster 5 is specifically induced by Cbf1p and does not contain any annotated sulfur metabolic genes (Figure 4, A and B). This cluster is enriched for the Gene Ontology (GO) component mitochondrial respiratory chain (three genes, p = 7.55e-05). Furthermore, 7 of the 21 genes have known or putative roles in the mitochondria or respiration according to the Saccharomyces Genome Database (Cherry et al., 2012). These genes include YDR115W (encoding a putative mitochondrial ribosomal protein, required for respiration), QCR10 (encoding a subunit of ubiquinol–cytochrome c oxidoreductase complex), YBL095W (encoding a protein of unknown function detected in purified mitochondria), HMF1 (encoding a functional complement of Mmf1p when targeted to the mitochondria), COX4 (encoding subunit IV of cytochrome c oxidase), and SDH1 (encoding succinate dehydrogenase). In addition, the most strongly induced gene in this cluster is YMR31 (encoding a mitochondrial ribosomal protein).
FIGURE 4:

Cbf1p is an activator and a repressor. Heatmaps of gene expression clusters 5 (A), 9 (B), and 3 (C). Below each heatmap is the mean expression trace for the cluster. The presence of the Met31p/Met32p core motif (black dot) or Cbf1p core motif (gray dot) in a particular gene's promoter is denoted to the right.
Cbf1p can repress, as well as activate, transcription. Cluster 3 (Figures 2, 4C, and 5B) is a clear case of simple repression. Its genes are most strongly enriched for roles in cellular iron ion homeostasis (13 genes, p = 1.08e-13). Cbf1p induction results in repression of every gene annotated for siderophore (high-affinity iron chelating factors) transporter activity (SIT1, ARN1, ARN2, and ENB1), but this repression is indirect, in the sense that promoters for these genes contain no known binding sites for Cbf1p. In contrast, three of the four genes (VTC1, VTC3, VTC4) encoding the vacuolar transport chaperone complex, which has an essential role in microautophagy (Uttenweiler et al., 2007), are directly repressed by Cbf1p. Each of these three genes contains an E-box sequence in its promoter and is a direct Cbf1p target based on chromatin immunoprecipitation (ChIP)-chip analysis (p < 0.005; MacIsaac et al., 2006).
FIGURE 5:
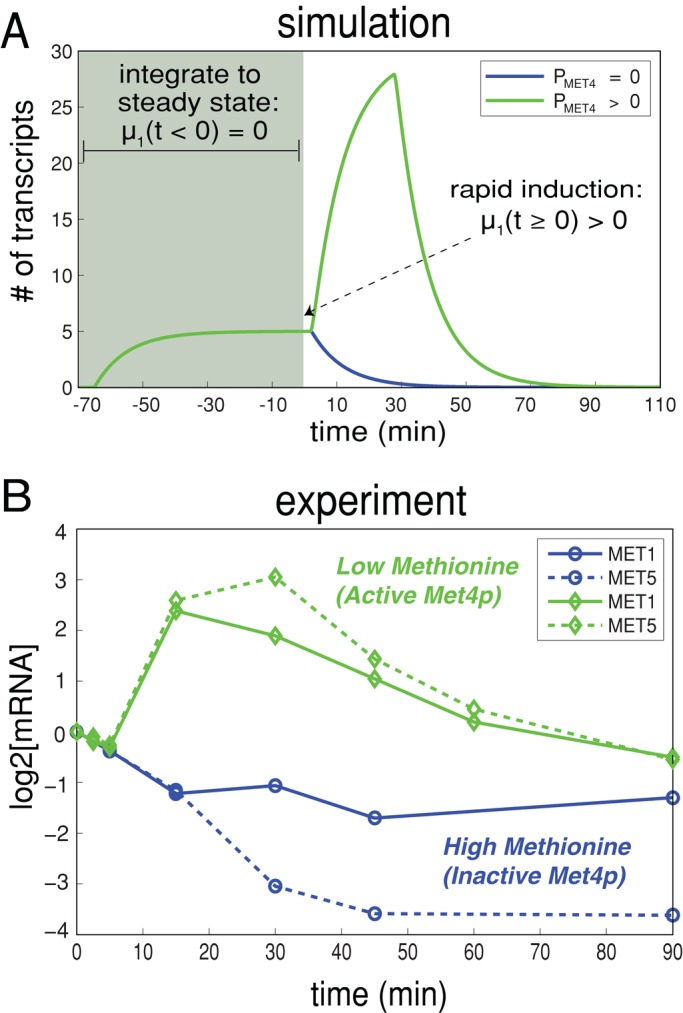
Simulations of parabolic transcriptional responses. (A) Simulations of cofactor induction where there are either no activating proteins (PMET4 = 0) or a limiting number of activating proteins (PMET4 > 0). The plot shows the response of target gene transcript (MTARGET), whose dynamics are described by Eq. 5, in response to induction of the cofactor. In the absence of activators, the cofactor (PCBF1) is by default a direct transcriptional repressor (blue line). In the presence of a limiting number of activators, gene expression is first stimulated before being repressed (green). (B) The experimentally determined transcriptional response of MET1 and MET5 in response to Cbf1p induction under methionine limitation (excess phosphate) or phosphate limitation (excess methionine).
An important feature of the expression pattern of the genes whose expression is induced by Cbf1p in cluster 5 (induced only by Cbf1p, possibly with help of a heretofore undescribed cofactor) and cluster 9 (induced by induction of Cbf1p, Met4p, or Met28p) is the overall shape of the expression response over time. Genes in cluster 5 (Figure 4A) follow a typical sigmoidal trajectory to saturation in response to Cbf1p (plotted below the heatmap), as expected from Michaelis–Menten kinetics if only Cbf1p concentration is relevant.
In contrast, the genes in cluster 9 (Figure 4B) follow a highly parabolic trajectory in response to Cbf1p (and a weaker one in response to Met28p). Many of these genes contain motifs for both Cbf1p and Met31p/Met32p (Figure 4B). Cbf1p-Met28p-Met4p is a transcriptional activation complex that is targeted to DNA (Kuras et al., 1996, 1997). Thus, when Cbf1p or Met28p is induced in cells, a functional complex can be made, and gene activation is detected. However, in our experimental design over time just one of these members of the complex is made in excess by the β-estradiol induction system (McIsaac et al., 2011b). A simple explanation for the parabolic shape could therefore be that intact complexes activate gene expression, but free Cbf1p causes repression.
Modeling the shape of gene expression response
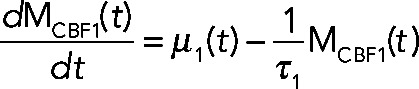
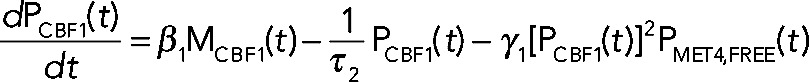
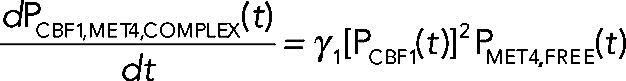
Numerical modeling studies of gene regulatory circuits can aid in the elucidation of plausible mechanisms underlying complex experimental data. Modeling with differential equations has become a relatively standard tool in biological investigations and has been widely applied to recent studies of the cell cycle (Tsai et al., 2008; McIsaac et al., 2011a), circadian clocks (Rust et al., 2007), the phage λ life cycle (Zhu et al., 2004), stem cell differentiation (Narula et al., 2010), and embryonic pattern formation (Berezhkovskii et al., 2011), to name a few. To address quantitatively how Cbf1p induction could result in parabolic transcriptional trajectories of a particular gene, we use a system of differential equations to model the transcriptional response of such a gene. Qualitatively, the model relies on fast activation and slow repression to achieve such a response. The components of the model include the transcriptional response of a cofactor (MCBF1(t)), its conversion into protein (PCBF1(t)), and the formation of a trans-activation complex protein (PCBF1,MET4,COMPLEX(t)) between Cbf1p dimers and free activators protein (PMET4,FREE(t)). When Cbf1p protein is overexpressed, we assume fast dimerization and subsequent conversion to a trans-activation complex with Met4p that stimulates the production of target transcripts. Over a longer time scale, there is an excess of cofactor protein (which we assume to be, by itself, a transcriptional repressor). The result is a parabolic transcriptional response (Figure 5A, green line). The model (shown in the following) predicts that in the absence of Met4p, Cbf1p should repress the same set of genes (Figure 5A, blue line). We defined an effective parameter in the model,  , that accounts for the dimerization of cofactors and slow dissociation of the trans-activation complex:
|
|
 (2) (2)
|
 (3) (3)
|
 (4) (4)
|
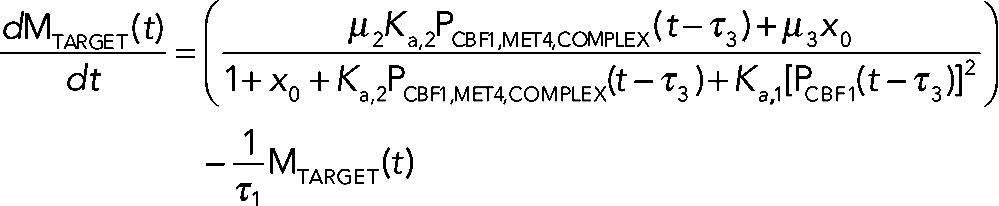 (5) (5)
|
To test whether Cbf1p can act directly as a repressor of the methionine genes, we performed an induction experiment under high-methionine conditions (200 mg/l), where Met4p activity is greatly reduced or absent (Rouillon et al., 2000). Under these conditions, we saw no parabolic trajectories in response to Cbf1p: rather, Cbf1p becomes a repressor of many of the methionine biosynthetic genes (Supplemental Figure S2), including MET1 and MET5, as shown in Figure 5B. On the basis of ChIP-chip experiments, MET1 and MET5 are both direct Cbf1p targets (p < 0.005; MacIsaac et al., 2006). Although Cbf1p becomes a transcriptional repressor of methionine biosynthetic genes under rich methionine conditions, its input/output relationship with regard to genes in clusters 3 and 5 does not switch direction, indicative of Met4p-independent Cbf1p activity (Supplemental Figure S3).
A feedforward loop in the regulation of genes controlled by Met4p and Met32p
We identified a group of genes activated in response to either Met32p or Met4p induction (clusters 7 and 8, Figure 6, A and B). For this group, Met32p induction results in a faster response of target genes than induction of Met4p, as is clear in both the heatmaps and the mean expression trace of the clusters. In response to Met32p, the mean traces show a definitive increase by 15 min, whereas in response to Met4p, the mean traces do not increase until 30–45 min after induction (Figure 6, A and B).
FIGURE 6:

Met4p and Met32p exhibit feedforward regulation. (A, B) Heatmaps of gene expression clusters 7 (A) and 8 (B). (C) Expression levels before TF induction relative to control (DBY12142) mRNA levels. (D) Expression of genes in clusters 7 and 8 in response to Met4p induction: MET4 (black line); MET32 (blue line); cluster 7 genes (green); cluster 8 genes (pink). (E) Network motif of genes in clusters 7 and 8.
The explanation for this observation is a feedforward loop. One of the genes in these clusters is MET32 itself (cluster 8, Figure 6B). In the absence of β-estradiol (t = 0), the absence of Met4p or Met32p results in nonexpression of many genes in these clusters (Figure 6C). It is clear from the heatmap in Figure 6B that MET32 is induced before the other genes in the cluster by Met4p. It is also clear that if one plots (on the same scale) the amount of mRNA for MET4 after induction by β-estradiol on the same time scale together with the genes of clusters 7 and 8, the order of expression is MET4 (5 min), MET32 (15 min), and, only later, the remaining genes in the clusters (≥30 min; Figure 6D). The scenario that these observations suggests is that active Met4p induces Met32p, and only then is there enough functional complex to induce the remaining genes; since gene activation requires both Met32p and Met4p, the network motif resembles a coherent feedforward loop with AND-gate control (Figure 6E; Shen-Orr et al., 2002). Obviously, this scenario requires the assumption that under methionine limitation, there is already present a sufficient concentration of Met4p to form functional complexes when Met32p is induced. Modeling of this scenario along the lines described here confirms that it is quantitatively compatible with the data (see Supplement and Supplemental Figure S4).
Given that Met31p and Met32p bind essentially the same (but possibly not entirely identical) binding motif in the DNA, they have largely been considered indistinguishable in practice, although we find strong evidence for differences in the biological consequences of deletions of MET31 and MET32 (Petti et al., 2012). It is therefore of great interest that there appears to be no feedforward loop for expression of Met31p, in contrast to what we just showed for Met32p. The difference in biological consequences between these factors may be due much more to the major differences in abundance under various conditions than in subtle differences in binding motif or binding strength. In most circumstances in which attribution of expression has been “Met31p/Met32p,” the reality must be that the predominant factor is Met32p, by virtue of its greater abundance due to the feedforward loop. This issue is taken up in more depth in the Discussion.
Among the genes regulated by this feedforward mechanism, a majority in both cluster 7 (16 of 24) and cluster 8 (8 of 10) contain at least one copy of the Met31p/Met32p core motif in their promoters (Figure 6, A and B). On the other hand, only 6 of 24 and 2 of 10 genes contain the Cbf1p core motif, respectively (Figure 6, A and B). However, genes in both clusters respond to Cbf1p induction: transcription of genes in cluster 7 is repressed, whereas in cluster 8 gene expression is stimulated. Thus the majority of transcriptional effects in response to Cbf1p are either indirect or mediated through a noncanonical motif.
Single deletions of either MET32 or MET4 (but not MET31, MET28, or CBF1) ablate induction of YCT1 when cells are grown in media containing low amounts of sulfur/methionine (Kaur and Bachhawat, 2007). The DNA motif and transcriptional information provided here extends the number of genes that are part of a regulon whose activation requires both Met32p and Met4p in a methionine-limited environment. Between the two clusters, 14 genes are induced at least twofold in response to both Met32p and Met4p, each of which contains at least one copy of the TGTGGC core motif in its promoter: OPT1, YCT1, BDS1, AGP3, GRX8, YOL162W, YOL163W, JLP1, PDC6, YLL058W, MET32, CRF1, YIL166C, and SUL1. It was previously shown that Met4p is activated in response to cell exposure to cadmium, and genes in the sulfur assimilation pathway are induced before PDC6 and AGP3 (this temporal delay in expression is also seen when cells are starved for sulfur; Cormier et al., 2010). These kinetic responses can now be understood as a direct consequence of feedforward regulation between Met4p and Met32p.
It is worth noting that induction of Met28p or Cbf1p produces strongly correlated transcriptional responses for genes in these clusters (r = 0.93 at t = 90 min). In stark contrast, the responses to Met31p or Met32p are anti-correlated (r = –0.57 at t = 90 min). These gene clusters provide clear examples of differential transcriptional responses to Met31p and Met32p.
Finally, cluster 7 is enriched for transmembrane transport processes (p = 8e-04; genes YOL162W, YCT1, PHO89, YOL163W, OPT1, AGP3, FCY21, and VBA2) and oxidoreductase activity (p = 0.007; genes AAD16, GND1, BDH1, and AAD6). Cluster 8 is enriched for sulfur compound metabolic processes (p = 0.009; genes MET32, YLL058W, and JLP1) and vitamin binding (p = 3e-04; genes ALT2, YLL058W, and PDC6). A complete list of GO enrichments is contained in Supplemental Data Set S1.
Distinct transcriptional responses to induction of Met31p and Met32p
Hierarchical clustering has the disadvantage that a gene can only belong to a single cluster. To study the differential function of the Met31p and Met32p transcription factors in a more general way, we used multiple regression. With this approach we can explicitly model the dynamic responses of all genes and look for differential responses between experiments (see Materials and Methods). Using this method, we identified 92 genes that showed statistically significant divergent responses to induction of Met31p and Met32p (Supplemental Data Set S1). Seventy-six of these genes were not detected by deleting and starving met31∆met6∆ or met32∆met6∆ strains for methionine (Petti et al., 2012). Of the 35 genes that were identified as differentially responsive to starvation in met31∆met6∆ and met32∆met6∆, 16 are differentially regulated in the induction experiments. These are enriched for amino acid transmembrane transport activity (p < 0.0003) and sulfur compound metabolic processes (p < 0.0005). The remaining 19 genes were not enriched for any GO processes, functions, or components. In fact, most expression differences in these 19 genes were modest in response to starvation. Exceptions were two genes of unknown function (YOL153C and YLR179C), SAM3, and CRF1, which were all induced in response to methionine starvation but displayed different kinetics of induction in met31∆met6∆ and met32∆met6∆ backgrounds. Of interest, the genes YLR179C (encodes a protein of unknown function) and SAM1 (encodes S-adenosyl methionine synthetase, an isozyme of SAM2) are divergently transcribed and separated by a 548-nucleotide region. Both genes are strongly induced in response to Met4p induction: YLR179C is induced 5.6-fold and SAM1 is induced 7.2-fold. This is reminiscent of genes like GAL1 and GAL10, which are divergently transcribed by the transcriptional activator Gal4p.
Transcription factor activity analysis
As an independent and more quantitative test of the divergent biological functions of the Met pathway regulators, we used the gene expression data to infer transcription factor activities (TFAs) using the REDUCE Suite software. Similar to the gene expression data, the inferred TFAs can be clustered and visualized as a heatmap (Supplemental Figure S5). In the Cbf1p induction experiment, we observe parabolic trajectories for Pho4p, Cbf1p, and Tye7p, which reach their maxima at 15 min. This was to be expected because each of these TFs binds to a nearly identical DNA E-box sequence. We do not see a response of these TFs in response to Met31p or Met32p induction but do observe a strong response to Met28p or Met4p induction. The TFA analysis highlights that the regulation of the iron genes by Cbf1p is likely indirect: the TFAs of Aft1p and Aft2p become strongly negative by 45–90 min (Supplemental Figure S5). We also observe that Met31p has a slightly repressive effect on Aft1p and Aft2p activity, whereas Met32p does not (Supplemental Figure S5).
DISCUSSION
Our experimental design was to perturb steady-state growth by inducing a single TF in the expectation that we could use the dynamic genome-wide gene expression response to dissect and model the input/output characteristics of a small set of related TFs. We chose the methionine TFs because they were already well characterized biochemically, making them a good model system for deconvolving combinatorial gene control in S. cerevisiae. Combinatorial gene regulation is both ubiquitous and central to gene regulation in eukaryotes. A recent information-theoretic study (Wunderlich and Mirny, 2009) calculated that the average TF motif in yeast contains 13.8 bits of information and that in multicellular eukaryotes contains12.1 bits; however, it takes 24 to ∼30 bits to specify a unique binding site, respectively. To coordinate complex transcriptional programs, eukaryotes need to modify the number, location, and identity of the DNA-binding sites in promoters to achieve a desired regulatory logic. Thus methods that allow us to quantitatively dissect this combinatorial control are of central importance in understanding gene regulation in eukaryotes.
We believe the results reported here illustrate the advantages of the perturbation of steady state by gratuitous induction of single genes encoding transcription factors. By following the changes in patterns of gene expression genome wide and paying close attention to the dynamics of that expression, we were able to tease out essential features of the combinatorial control system that explain much of the known biology.
We obtained three major results of biological significance.
Result 1. Met pathway DNA-binding proteins can act as repressors as well as activators
We directly observed that Cbf1p can function as both a repressor and an activator, confirming and extending evidence obtained by starving deletion mutants of the Met TFs (Petti et al., 2012). For example, we observed that repression is the primary way in which the Met pathway regulators control iron homeostasis. We also found that when Cbf1p acts as an activator of the Met genes (in concert with Met4p and Met28p) the activation is seen early after Cbf1p induction and is followed by repression, likely caused by excess Cbf1p binding. This indicates that the default result of Cbf1p binding is repression, and that activation requires Met4p and Met28p. We were able to produce a simple numerical model entirely consistent with these ideas.
We observed activation by Cbf1p of quite a few genes that contain the Cbf1p motif in their promoters (but not that of Met31p/Met32p). These genes contain a nearly identical version of the Cbf1p binding motif found in the Cbf1p-repressed genes (cluster 3), so this is unlikely to be sufficient to account for the differential transcriptional response (the difference in information content between the two motifs is only 0.6 bits). Repression of genes in cluster 3 is consistent with the default repressive mode of Cbf1p. Because the E-box motifs in cluster 3 and 5 promoters are not flanked by RYAAT (which, based on data from Siggers et al., 2011, is required to target the Cbf1p-Met4p-Met28p trans-activation complex to target sequences), we suggest that further biochemical investigation will lead to the discovery of a Met4p-like coactivator that switches Cbf1p-binding events from the default (repression) to activation and would account for differential response to essentially identical binding motifs. Given the sigmoidal kinetic trajectories of cluster 5 transcripts, we would expect this coactivator to be nonlimiting.
Result 2. There are feedback relationships among the Met pathway regulators
Second, we found significant feedback among the individual TFs. The presence and direction of detectable transcriptional regulation is summarized as both a heatmap (Figure 7A) and a wiring diagram (Figure 7B). The data were obtained simply by induction of regulators one at a time and are a subset of the data in Figure 2. Consistent with previous studies, we find that Met4p activates expression of MET30, which inhibits Met4p through the SCFMET30 ubiquitin ligase complex. Met4p also activates expression of its own cofactors, MET28 and MET32 (Figures 6B and 7A), indicating that maintaining the stoichiometry of these proteins is of particular importance. Indeed, based on our modeling, maintaining proper stoichiometry would prevent the strong parabolic transcriptional responses that we observed for cluster 9 genes in response to Cbf1p. This complex transcriptional network is further complicated by the presence of negative posttranslational feedback (Figure 7B, purple lines). Our assessment of posttranslational feedback is based on a recent biochemical study (Ouni et al., 2010) that provides evidence that the Met4p-bound cofactors Cbf1p, Met31p, and Met32p (but not Met28p) are targeted for degradation by SCFMET30.
FIGURE 7:
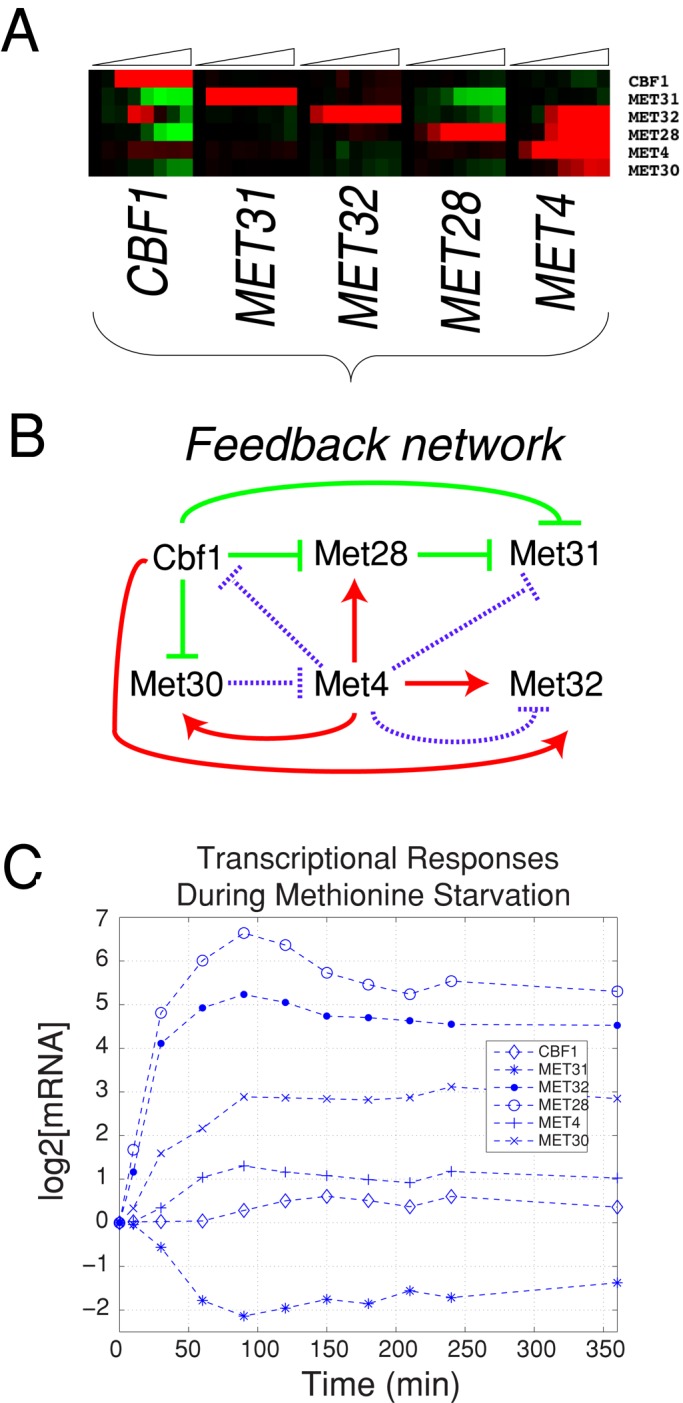
Interaction network of Met pathway regulators. (A) Heatmap of the transcriptional responses of CBF1, MET31, MET32, MET28, MET4, and MET30 from induction data in Figure 2. (B) Wiring diagram of interactions among factors. Stimulation of transcription is shown in red, and repression is shown in green. Purple indicates posttranslational feedback between either SCFMet30 and Met4p or Met4p-mediated recruitment of cofactor proteins to SCFMet30 as discussed in the text and in Ouni et al. (2010). (C) Transcriptional responses of Met TFs in met6∆ cells starved for methionine as described in Petti et al. (2012).
Two important features of this wiring diagram can be observed in met6∆ cells starved for methionine (Figure 7C). First, MET28 and MET32 transcripts are both strongly induced (>32-fold) in response to methionine starvation (Figure 7C), consistent with Met4p-mediated induction. Second, during starvation for methionine, CBF1 transcripts remain relatively unchanged, whereas MET28 is strongly upregulated and MET31 is repressed (Figure 7C). Similarly, MET28 overexpression results in repression of MET31 (Figure 7B).
Result 3. Positive feedback may account for the differential actions of Met31p and Met32p
The discovery of the feedforward loop controlling expression of MET32 and the lack of such a loop for MET31 is particularly notable. This difference accounts for how deletions of these two factors that bind essentially the same binding site, and both of which must be deleted to produce methionine auxotrophy, can nevertheless have significantly different phenotypes. Specifically, the difference in feedback control explains quite simply how the lethality of a deletion of MET30 can be rescued by a deletion of MET32 but not deletion of MET31 (Patton et al., 2000): in the presence of active Met4p there will be much more Met32p than Met31p. If we assume that the lethality of MET30 deletion is due to its failure to limit the activity of the Met4p–Met32p complex by ubiquitination, then loss of the Met32p, produced in large amounts because of the feedback loop, will alleviate the problem, whereas the deletion of the relatively minor species Met31p will not.
Our results suggest apparently opposite behavior of a few target genes, namely induction by Met32p and no induction or weak repression by Met31p, when these regulators are overexpressed separately (Figure 6). We speculate that the basis for this might be that some promoters require more activity or active complex than can be achieved without the feedforward loop. The limited supply of Met31p, according to this hypothesis, would be engaged in binding to other promoters, whereas in the case of Met32p, positive feedback can produce arbitrarily large amounts. In the absence of Met30p, these amounts could account for lethality.
Megacluster of induction and starvation data
The design paradigms of rapid TF induction versus gene disruption/starvation followed by gene expression profiling provide overlapping but distinct insight into the global regulation of gene expression by the Met regulators. Induction data (from Figure 2) and expression data from starvation experiments for the same genes (Petti et al., 2012) were clustered together to form a “megacluster” (Figure 8). Several clusters of particular biological interest that emerge from this analysis are shown to the right of the megacluster.
FIGURE 8:

Combined cluster of genome-wide expression data from induction and starvation experiments. Induction data from Figure 2 and expression data from deletions (Petti et al., 2012) for the same genes were combined and then hierarchically clustered (left). All strains are met6∆. Several clusters displaying functional enrichment are shown to the right along with the gene names. The most enriched processes in the different clusters based on GO are (A) Iron Ion Homeostasis (p = 7.36e-22), (B) Polyphosphate Metabolic Process (p = 2.38e-08), (C) Carboxylic Acid Metabolic Process (p = 2.3e-04), (D) Sulfur Compound Metabolic Process (p = 2.12e-10), (E) Sulfur Amino Acid Metabolic Process (p = 7.37e-11), (F) Sulfate Assimilation (p = 8.65e-10), and (G) None.
To our knowledge, there are very few demonstrated genetic connections between methionine and iron regulation, despite the central importance of iron–sulfur clusters in electron transport and cellular respiration. Under methionine starvation, the iron genes are only mildly induced in the control strain (Figure 8, cluster A). Some deletions (met4∆ or met31∆met32∆) result in strong activation of many iron genes under methionine starvation (Figure 8, cluster A). Similarly, induction of Cbf1p or Met4p results in repression of genes in this cluster. These results establish a repressive role for the Met pathway transcription factors in iron gene regulation and a requirement for these factors in the maintenance of methionine/iron homeostasis.
More broadly, we find that Cbf1p has a largely repressive role on many of the phosphate genes when induced (Figure 8, cluster B), and Met4p induction represses genes in a variety of metabolic processes, including histidine and arginine biosynthesis (Figure 8, cluster C). Sulfur and methionine genes cluster together (Figure 8, clusters D–F). Genes in cluster F show a positively correlated response to Cbf1p, Met28p, and Met4p. Similarly, these genes show either reduced or ablated induction in various cbf1∆ strains starved for methionine. Finally, as we already noted, Cbf1p acts as an activator in a Met4p-independent manner (Figure 8, cluster G). Expression of genes in this cluster is relatively unaffected by the variety of genotypes considered that contain a wild-type CBF1 allele.
Mapping motif and expression data onto sulfur metabolism and beyond
The goal of this study and its companion (Petti et al., 2012) was to understand combinatorial regulation by the Met pathway regulators. Our data make clear that the reach of these regulators goes well beyond sulfur and methionine metabolism. To visualize the global effect of the Met transcription factors on yeast metabolic genes in response to induction or deletion/starvation, we summarize both motif and transcriptional information on a skeletal network of yeast metabolism (Figure 9).
FIGURE 9:

Systems-level regulation of metabolic genes by Met TFs. The schematic represents an overview of yeast metabolism. Genes are first colored according to their promoter type. A promoter can contain a Cbf1p motif (blue), a Met31p/Met32p motif (green), joint (red), or neither (no color). Motifs were mapped to promoters using the MAST algorithm. Second, genes that have expression changes in response to several different perturbations are marked with colored boxes. Significant responses to Met4p or Cbf1p induction are marked in red and orange, respectively, and significant differences between met31∆met32∆/control or cbf1∆/control experiments are marked in purple and cyan, respectively. Finally, significant differences in expression in response to induction of Met31p and Met32p are marked in brown. Significance was determined using linear regression and template matching as described in Materials and Methods. Genes repressed by Met4p are marked with an asterisk. While MET6 is a joint target, it is deleted in all strains (marked by a dagger). In addition, SUL1 and PDC6 are marked with a dagger because MAST did not detect a Cbf1p-binding site in the promoter of either gene. However, it was previously shown that the promoters of these genes each contain a noncanonical Cbf1p-binding site (Cormier et al., 2010).
It is worth recalling at the outset that the ensemble of data from our studies of Met pathway regulator deletions (Petti et al., 2012) and one-by-one inductions described here are highly consistent with each other, as shown in Figure 8. However, there is nothing like a one-to-one correspondence between the aggregated data from biochemical assessments of DNA protein interaction (e.g., ChIP-Chip) for the Met regulators and the biological effects we documented with our two methods in vivo (Supplemental Figure S6; Teixeira et al., 2006). Many more sites are detected biochemically than we see regulation for. This is frequently the case for such studies (Lieb et al., 2001). Although it could mean that not enough biological conditions have been tested, it more likely means that many of the sites detected biochemically are not actually used for regulation (Gao et al., 2004).
The first level of analysis is to examine the pathways that involve both the CBF1 and MET31/MET32 arms of the combinatorial system: these are generally the ones that contain “joint” binding sites for the products of both Cbf1p and Met31p/Met32p. Joint sites are found mainly in the Met pathway itself. Notable in these pathways is the lack of a Cbf1p site in the promoter of SAM1 and its presence in that of the paralogous gene SAM2. It would seem that reliable induction of SAM1 is less important physiologically than the reliable and strong induction of SAM2. SAM1 is the minor species in abundance, a property central to the slow-growth phenotype of MET4-deletion mutants (Hickman et al., 2011). The inference that the joint targets in the Met pathway reflect the need for reliable and strong induction is supported by the summary of the induction and deletion data (colored boxes in Figure 9), which show that these genes with joint targets in their promoters are regulated similarly.
There are also joint targets within metabolism that are outside the Met pathway. Some of these (BNA3, SER33, GSH1, and PDC6) are expressed similarly to the Met pathway joint targets. We interpret this to mean that the physiological importance of these genes is similar to that of the basic biosynthetic pathway. This makes good sense for BNA3, which lies in the pathway leading to the biosynthesis of NAD, the central small molecular actor in oxidation/reduction reactions, and for GSH1, believed to be the primary protein buffer in redox homeostasis. The rationale for the inclusion of SER33 in this group of genes is less obvious. We suggest the possibility that this gene may be regulating flow of carbon into phospholipids, a major consumer of methyl groups from SAM. We previously showed that the choline pathway is combinatorially regulated by Met4p and Opi1p (Hickman et al., 2011). Finally, PDC6 encodes one of three isoforms encoding pyruvate decarboxylase (the other two are PDC1 and PDC5) and is the one that contains the least number of sulfur atoms (Boer et al., 2003). PDC1, PDC5, and PDC6 contain 17, 18, and 6 sulfur-containing amino acids, respectively.
There are many metabolic genes that appear not to be joint targets. It is worth noting that the ribonucleotide reductase–encoding genes (RNR2, RNR3, RNR4) do not show the strong time dependences of the Met pathway genes, but RNR2 and RNR4 show increased expression when CBF1 is deleted (Petti et al., 2012). The connection may be redox homeostasis and DNA replication, as the encoded enzymes are major consumers of reducing power.
To conclude, the metabolic effects of the Met pathway regulators can be explained by combinatorial regulation by proteins that feed back on themselves in a rationalizable way. Our results explain well the metabolic consequences of this regulation, although the details of the connection with the cell division cycle and chromosome separation (in which these regulators are also implicated) remain to be explored.
MATERIALS AND METHODS
Strain construction
Parents of induction strains are DBY12020 (MATa) or DBY12021 (MATα; Table 1). To make KanMX4-PGAL1-ORF alleles, KanMX4-PGAL1 linear fragments were PCR amplified from DBY11408 genomic DNA and transformed into the parent strains (Supplemental Figure S7). Promoter insertions were confirmed by PCR and Sanger sequencing (GeneWiz). MET6 was deleted with HphMX4 (from plasmid pAG32; European Saccharomyces cerevisiae Archive for Functional Analysis, Institute for Molecular Biosciences, Johann Wolfgang Goethe-University Frankfurt, Frankfurt, Germany) and confirmed by PCR. Transformations were performed with a standard lithium acetate method. Selection drugs used were G418 (200 μg/ml; Cellgro, Manassas, VA) and hygromycin B (2900 U/ml; Calbiochem, La Jolla, CA).
TABLE 1:
Strains used in this study.
| Strain | Genotype | Source |
|---|---|---|
| DBY11408 | MATα, his3∆1, leu2∆0, lys2∆0, ura3∆0, gal10∆::KanMX4, hap1– | Open Biosystems (Thermo Biosystems, Huntsville, AL) |
| DBY12020 | MATa, (GAL10pr+gal1)∆::loxP, leu2∆0::ACT1pr-GEV-NatMX, gal4∆::LEU2, HAP1+ | McIsaac et al. (2011b) |
| DBY12021 | MATα, (GAL10pr+gal1)∆::loxP, leu2∆0::ACT1pr-GEV-NatMX, gal4∆::LEU2, HAP1+ | McIsaac et al. (2011b) |
| DBY12040 | MATα, (GAL10pr+gal1)∆::loxP, leu2∆0::ACT1pr-GEV-NatMX, gal4∆::LEU2, KanMX4-GAL1pr-CBF1, HAP1+ | McIsaac et al. (2011b) |
| DBY12091 | MATα, (GAL10pr+gal1)∆::loxP, leu2∆0::ACT1pr-GEV-NatMX, gal4∆::LEU2, KanMX4-GAL1pr-CBF1, met6∆::HphMX4, HAP1+ | This study |
| DBY12092 | MATa, (GAL10pr+gal1)∆::loxP, leu2∆0::ACT1pr-GEV-NatMX, gal4∆::LEU2, KanMX4-GAL1pr-MET31, met6∆::HphMX4, HAP1+ | This study |
| DBY12093 | MATα, (GAL10pr+gal1)∆::loxP, leu2∆0::ACT1pr-GEV-NatMX, gal4∆::LEU2, KanMX4-GAL1pr-MET32, met6∆::HphMX4, HAP1+ | This study |
| DBY12094 | MATα, (GAL10pr+gal1)∆::loxP, leu2∆0::ACT1pr-GEV-NatMX, gal4∆::LEU2, KanMX4-GAL1pr-MET28, met6∆::HphMX4, HAP1+ | This study |
| DBY12099 | MATα, (GAL10pr+gal1)∆::loxP, leu2∆0::ACT1pr-GEV-NatMX, gal4∆::LEU2, KanMX4-GAL1pr-MET4, met6∆::HphMX4, HAP1+ | McIsaac et al. (2011b) |
| DBY12142 | MATα, (GAL10pr+gal1)∆::loxP, leu2∆0::ACT1pr-GEV-NatMX, gal4∆::LEU2, met6∆::HphMX4, HAP1+ | This study |
All strains are S288C. HAP1+ indicates a repaired HAP1 allele (Hickman and Winston, 2007), and hap1− indicates the partial loss-of-function S288C allele (Gaisne et al., 1999; Hickman and Winston, 2007).
Induction experiments
Yeast was cultured in 500-ml chemostats (Sixfors, Infors AG, Bottmingen, Switzerland) under methionine limitation (7.5 mg/l methionine; Supplemental Figure S8) unless otherwise noted. Cultures were grown at 30°C, stirred at 400 rpm, aerated with filtered humidified air, and maintained at a volume of 300 ml. Growth rates were maintained at 0.16 h−1. From 18 to 24 h of batch growth was initiated from a 1:60 dilution of cells grown overnight in the same medium before turning on the pump. Cells were grown to steady state (as determined by optical density), and then 1 μM β-estradiol (Tocris Biosciences, Ellisville, MO) was added to the cultures.
RNA extraction, labeling, and hybridization
RNA extraction, labeling, and hybridization were performed as described, with slight modifications (Brauer et al., 2008). Samples from chemostat cultures (5 ml) were vacuum filtered onto 0.45-μm nylon membranes (HNWP02500; Millipore, Billerica, MA), placed in 2-ml locking-lid tubes (Fisherbrand, 02-681-291; ThermoFisher Scientific, Waltham, MA), and then flash-frozen in liquid nitrogen. Samples were stored at −80ºC until RNA extraction, which was performed with a standard acid-phenol procedure. Crude RNA was cleaned with RNeasy mini columns (Qiagen, Valencia, CA) before mRNA amplification and labeling with the Agilent Quick-Amp Labeling Kit (Part No. 5190-0424; Agilent Technologies, Santa Clara, CA). Amplification and labeling were performed per manufacturer's instructions but with half the volume of each reagent and 0.6 μl of Cy3 or Cy5 dye. Reference RNA was extracted from a lab wild-type strain (DBY12001) grown to steady state in phosphate-limited (20 mg/l) growth medium at D = 0.18 h−1. Agilent Yeast Oligo V2 microarrays (8 × 15k) were hybridized for 17 h at 65ºC on a rotisserie at 20 rpm. Hybridized microarrays were washed and scanned, and raw data were extracted with Agilent Feature Extractor Software, version 9.5.
Microarray analysis
The methionine-limited overexpression data set consists of 40 microarrays and five separate time courses. In each time course, the data were time-zero transformed. For each of five TFs (and one GEV-only control, DBY12142) we hybridized mRNA before (t = 0 min) and after (t = 2.5, 5, 15, 30, 45, 60, and 90 min) addition of 1 μM β-estradiol. Missing values were imputed using KNN imputation (with k = 10 nearest neighbors and Euclidean distance metric) as described in Troyanskaya et al. (2001). Genes that did not change by a factor of 1.8-fold (∼2 SDs above the mean of the data set) in any of the six imputed time courses were then removed. With the remaining 756 imputed genes, we used the following algorithm to remove expression changes due to GEV itself.
Applied SVD to DBY12142 data to obtain the left eigenvectors (i.e., eigenarrays), denoted
 (j = 1, 2,…, 7, 8).
Projected the TF overexpression data sets yi (i = 1, 2,…, 39, 40) onto the orthonormal basis spanned by uj to obtain
 .
.Obtained
 .
.
The data set consisting of  (d1, d2,…, d39, d40) was used for all analysis in this article unless otherwise noted. These data were hierarchically clustered using the Pearson distance metric as a measure of similarity between genes. Data analyses were performed using custom software in Matlab (MathWorks, Natick, MA) and R (R Development Core Team, 2009). Clustering and visualization of the data were performed with Cluster 3.0 (de Hoon et al., 2004), Multiple Experiment Viewer (Saeed et al., 2006), and Java TreeView (Saldanha, 2004).
Time dependence of gene expression responses
To do a pairwise comparison of the Met31p and Met32p induction time courses, we used a regression-based approach, similar to that found in Petti et al. (2011). First, we filtered out genes that do not have significant temporal dependence. We fitted the expression profile of each gene to a reduced model (i.e., does not take into account the strain genotype):
We require that the p value of the F statistic of the model is <0.05 in at least one of the time courses. The y-intercept was fixed at 0 because the data are time-zero normalized. Next, we identified genes that have significant temporal differences between the Met31 and Met32 experiments using multiple regression. The dummy variable DG is used to distinguish the genotype of the strain (DG = 0 for PGAL1-MET31 and DG = 1 for PGAL1-MET32). We then performed multiple linear regression with
and computed the p value of the F statistic between the full and reduced models. A gene is considered divergent between the two strains if the Benjamini–Yekutieli false discovery rate (FDR)–corrected p value is <0.1 (80 genes). Twelve distinct genes that were not significant based on the linear model but were highly significant (FDR-corrected p < 0.001) based on a two-tailed Student's t test between the 15- and 90-min time points of the two experiments were also retained. Genes responsive to Cbf1p or Met4p induction were identified using the same reduced model as described. Responsive genes were those with an FDR-corrected p <0.05 and a minimum fold change of 1.5. Because many genes that are highly responsive to Cbf1p did not fit well to this model, we constructed a parabolic-shaped gene expression response and used template matching (Pavlidis and Noble, 2001) with r > 0.7 to identify additional genes with Cbf1p dependence.
Data accession
Microarray data can be obtained from http://sulfur.princeton.edu.
Numerical simulations
Delay differential equations were integrated forward in time using the forward Euler method with a time step dt = 5e-04 in Matlab.
Gene Ontology terms
Generic Gene Ontology Term Finder (Boyle et al., 2004) was used to find significant biological processes, functions, and components within gene expression clusters. Bonferroni-corrected p values (calculated from the hypergeometric distribution) measure the significance of GO enrichments.
Searching for enriched regulatory motifs in promoters
Gene promoter sequences (−1 to −800 base pairs of a gene's first ATG) were obtained from the Regulatory Sequence Analysis Tools (RSAT) database (Thomas-Chollier et al., 2008). The MEME algorithm (Bailey and Elkan, 1994) was used to perform an unbiased search for enriched regulatory motifs within gene expression clusters.
Quantification of transcription factor activities
Transcription factor activities were quantified as in Lee and Bussemaker (2010), using the Transfactivity tool from the REDUCE Suite, version 2.0 (http://bussemaker.bio.columbia.edu/software/REDUCE), with position-specific affinity matrices from MacIsaac et al. (2006).
Supplementary Material
Acknowledgments
Research was supported by Grants GM046406 (to D.B.) and GM071508 from the National Institute of General Medical Sciences Center for Quantitative Biology. R.S.M. acknowledges support from a National Science Foundation Graduate Research Fellowship. H.J.B. acknowledges support from National Institutes of Health Grant HG003008 and a John Simon Guggenheim Foundation Fellowship. We thank the entire Botstein lab, Josh Bloom, Patrick Bradley, and Ned Wingreen for helpful discussions and Patrick Gibney and Xin Wang for critically reviewing the manuscript. We also thank the anonymous reviewers for their constructive remarks.
Abbreviations used:
- GEV
Gal4dbd.ER.VP16 transcriptional activator
- GO
Gene Ontology
- RSAT
Regulatory Sequence Analysis Tools
- TF
transcription factor
Footnotes
This article was published online ahead of print in MBoC in Press (http://www.molbiolcell.org/cgi/doi/10.1091/mbc.E12-03-0232) on June 13, 2012.
REFERENCES
- Alter O, Brown PO, Botstein D. Singular value decomposition for genome-wide expression data processing and modeling. Proc Natl Acad Sci USA. 2000;97:10101–10106. doi: 10.1073/pnas.97.18.10101. [DOI] [PMC free article] [PubMed] [Google Scholar]
- Bailey TL, Elkan C. Fitting a mixture model by expectation maximization to discover motifs in biopolymers. Proc Int Conf Intell Syst Mol Biol. 1994;2:28–36. [PubMed] [Google Scholar]
- Berezhkovskii AM, Sample C, Shvartsman SY. Formation of morphogen gradients: local accumulation time. Phys Rev E Stat Nonlin Soft Matter Phys. 2011;83:051906. doi: 10.1103/PhysRevE.83.051906. [DOI] [PMC free article] [PubMed] [Google Scholar]
- Blaiseau PL, Isnard AD, SurdinKerjan Y, Thomas D. Met31p and Met32p, two related zinc finger proteins, are involved in transcriptional regulation of yeast sulfur amino acid metabolism. Mol Cell Biol. 1997;17:3640–3648. doi: 10.1128/mcb.17.7.3640. [DOI] [PMC free article] [PubMed] [Google Scholar]
- Blaiseau PL, Thomas D. Multiple transcriptional activation complexes tether the yeast activator Met4 to DNA. EMBO J. 1998;17:6327–6336. doi: 10.1093/emboj/17.21.6327. [DOI] [PMC free article] [PubMed] [Google Scholar]
- Boer VM, de Winde JH, Pronk JT, Piper MD. The genome-wide transcriptional responses of Saccharomyces cerevisiae grown on glucose in aerobic chemostat cultures limited for carbon, nitrogen, phosphorus, or sulfur. J Biol Chem. 2003;278:3265–3274. doi: 10.1074/jbc.M209759200. [DOI] [PubMed] [Google Scholar]
- Boyle EI, Weng SA, Gollub J, Jin H, Botstein D, Cherry JM, Sherlock G. GO::TermFinder—open source software for accessing Gene Ontology information and finding significantly enriched Gene Ontology terms associated with a list of genes. Bioinformatics. 2004;20:3710–3715. doi: 10.1093/bioinformatics/bth456. [DOI] [PMC free article] [PubMed] [Google Scholar]
- Brauer MJ, Huttenhower C, Airoldi EM, Rosenstein R, Matese JC, Gresham D, Boer VM, Troyanskaya OG, Botstein D. Coordination of growth rate, cell cycle, stress response, and metabolic activity in yeast. Mol Biol Cell. 2008;19:352–367. doi: 10.1091/mbc.E07-08-0779. [DOI] [PMC free article] [PubMed] [Google Scholar]
- Cai M, Davis RW. Yeast centromere binding protein CBF1, of the helix-loop-helix protein family, is required for chromosome stability and methionine prototrophy. Cell. 1990;61:437–446. doi: 10.1016/0092-8674(90)90525-j. [DOI] [PubMed] [Google Scholar]
- Cherry JM, et al. Saccharomyces Genome Database: the genomics resource of budding yeast. Nucleic Acids Res. 40:D700–D705. doi: 10.1093/nar/gkr1029. [DOI] [PMC free article] [PubMed] [Google Scholar]
- Cormier L, Barbey R, Kuras L. Transcriptional plasticity through differential assembly of a multiprotein activation complex. Nucleic Acids Res. 2010;38:4998–5014. doi: 10.1093/nar/gkq257. [DOI] [PMC free article] [PubMed] [Google Scholar]
- de Hoon MJ, Imoto S, Nolan J, Miyano S. Open source clustering software. Bioinformatics. 2004;20:1453–1454. doi: 10.1093/bioinformatics/bth078. [DOI] [PubMed] [Google Scholar]
- Dowell SJ, Tsang JS, Mellor J. The centromere and promoter factor 1 of yeast contains a dimerisation domain located carboxy-terminal to the bHLH domain. Nucleic Acids Res. 1992;20:4229–4236. doi: 10.1093/nar/20.16.4229. [DOI] [PMC free article] [PubMed] [Google Scholar]
- Eisen MB, Spellman PT, Brown PO, Botstein D. Cluster analysis and display of genome-wide expression patterns. Proc Natl Acad Sci USA. 1998;95:14863–14868. doi: 10.1073/pnas.95.25.14863. [DOI] [PMC free article] [PubMed] [Google Scholar]
- Gaisne M, Becam AM, Verdiere J, Herbert CJ. A “natural” mutation in Saccharomyces cerevisiae strains derived from S288c affects the complex regulatory gene HAP1 (CYP1) Curr Genet. 1999;36:195–200. doi: 10.1007/s002940050490. [DOI] [PubMed] [Google Scholar]
- Gao F, Foat BC, Bussemaker HJ. Defining transcriptional networks through integrative modeling of mRNA expression and transcription factor binding data. BMC Bioinformatics. 2004;5:31. doi: 10.1186/1471-2105-5-31. [DOI] [PMC free article] [PubMed] [Google Scholar]
- Harbison CT, et al. Transcriptional regulatory code of a eukaryotic genome. Nature. 2004;431:99–104. doi: 10.1038/nature02800. [DOI] [PMC free article] [PubMed] [Google Scholar]
- Hickman MJ, Petti AA, Ho-Shing O, Silverman SJ, McIsaac RS, Lee TA, Botstein D. Coordinated regulation of sulfur and phospholipid metabolism reflects the importance of methylation in the growth of yeast. Mol Biol Cell. 2011;22:4192–4204. doi: 10.1091/mbc.E11-05-0467. [DOI] [PMC free article] [PubMed] [Google Scholar]
- Hickman MJ, Winston F. Heme levels switch the function of hap1 of Saccharomyces cerevisiae between transcriptional activator and transcriptional repressor. Mol Cell Biol. 2007;27:7414–7424. doi: 10.1128/MCB.00887-07. [DOI] [PMC free article] [PubMed] [Google Scholar]
- Hu Z, Killion PJ, Iyer VR. Genetic reconstruction of a functional transcriptional regulatory network. Nat Genet. 2007;39:683–687. doi: 10.1038/ng2012. [DOI] [PubMed] [Google Scholar]
- Kaiser P, Flick K, Wittenberg C, Reed SI. Regulation of transcription by ubiquitination without proteolysis: Cdc34/SCF(Met30)-mediated inactivation of the transcription factor Met4. Cell. 2000;102:303–314. doi: 10.1016/s0092-8674(00)00036-2. [DOI] [PubMed] [Google Scholar]
- Kaur J, Bachhawat AK. Yct1p, a novel, high-affinity, cysteine-specific transporter from the yeast Saccharomyces cerevisiae. Genetics. 2007;176:877–890. doi: 10.1534/genetics.107.070342. [DOI] [PMC free article] [PubMed] [Google Scholar]
- Kuras L, Barbey R, Thomas D. Assembly of a bZIP-bHLH transcription activation complex: formation of the yeast Cbf1-Met4-Met28 complex is regulated through Met28 stimulation of Cbf1 DNA binding. EMBO J. 1997;16:2441–2451. doi: 10.1093/emboj/16.9.2441. [DOI] [PMC free article] [PubMed] [Google Scholar]
- Kuras L, Cherest H, SurdinKerjan Y, Thomas D. A heteromeric complex containing the centromere binding factor 1 and two basic leucine zipper factors, Met4 and Met28, mediates the transcription activation of yeast sulfur metabolism. EMBO J. 1996;15:2519–2529. [PMC free article] [PubMed] [Google Scholar]
- Lee E, Bussemaker HJ. Identifying the genetic determinants of transcription factor activity. Mol Syst Biol. 2010;6:412. doi: 10.1038/msb.2010.64. [DOI] [PMC free article] [PubMed] [Google Scholar]
- Lee TA, Jorgensen P, Bognar AL, Peyraud C, Thomas D, Tyers M. Dissection of combinatorial control by the Met4 transcriptional complex. Mol Biol Cell. 2010;21:456–469. doi: 10.1091/mbc.E09-05-0420. [DOI] [PMC free article] [PubMed] [Google Scholar]
- Lieb JD, Liu X, Botstein D, Brown PO. Promoter-specific binding of Rap1 revealed by genome-wide maps of protein–DNA association. Nat Genet. 2001;28:327–334. doi: 10.1038/ng569. [DOI] [PubMed] [Google Scholar]
- MacIsaac KD, Wang T, Gordon DB, Gifford DK, Stormo GD, Fraenkel E. An improved map of conserved regulatory sites for Saccharomyces cerevisiae. BMC Bioinformatics. 2006;7:113. doi: 10.1186/1471-2105-7-113. [DOI] [PMC free article] [PubMed] [Google Scholar]
- McIsaac RS, Huang KC, Sengupta A, Wingreen NS. Does the potential for chaos constrain the embryonic cell-cycle oscillator. PLoS Comput Biol. 2011a;7:e1002109. doi: 10.1371/journal.pcbi.1002109. [DOI] [PMC free article] [PubMed] [Google Scholar]
- McIsaac RS, Silverman SJ, McClean MN, Gibney PA, Macinskas J, Hickman MJ, Petti AA, Botstein D. Fast-acting and nearly gratuitous induction of gene expression and protein depletion in Saccharomyces cerevisiae. Mol Biol Cell. 2011b;22:4447–4459. doi: 10.1091/mbc.E11-05-0466. [DOI] [PMC free article] [PubMed] [Google Scholar]
- Measday V, et al. Systematic yeast synthetic lethal and synthetic dosage lethal screens identify genes required for chromosome segregation. Proc Natl Acad Sci USA. 2005;102:13956–13961. doi: 10.1073/pnas.0503504102. [DOI] [PMC free article] [PubMed] [Google Scholar]
- Narula J, Smith AM, Gottgens B, Igoshin OA. Modeling reveals bistability and low-pass filtering in the network module determining blood stem cell fate. PLoS Comput Biol. 2010;6:e1000771. doi: 10.1371/journal.pcbi.1000771. [DOI] [PMC free article] [PubMed] [Google Scholar]
- Ouni I, Flick K, Kaiser P. A transcriptional activator is part of an SCF ubiquitin ligase to control degradation of its cofactors. Mol Cell. 2010;40:954–964. doi: 10.1016/j.molcel.2010.11.018. [DOI] [PMC free article] [PubMed] [Google Scholar]
- Patton EE, Peyraud C, Rouillon A, Surdin-Kerjan Y, Tyers M, Thomas D. SCF(Met30)-mediated control of the transcriptional activator Met4 is required for the G(1)-S transition. EMBO J. 2000;19:1613–1624. doi: 10.1093/emboj/19.7.1613. [DOI] [PMC free article] [PubMed] [Google Scholar]
- Pavlidis P, Noble WS. Analysis of strain and regional variation in gene expression in mouse brain. Genome Biol. 2001;2 doi: 10.1186/gb-2001-2-10-research0042. RESEARCH0042. [DOI] [PMC free article] [PubMed] [Google Scholar]
- Petti AA, Crutchfield CA, Rabinowitz JD, Botstein D. Survival of starving yeast is correlated with oxidative stress response and nonrespiratory mitochondrial function. Proc Natl Acad Sci USA. 2011;108:E1089–E1098. doi: 10.1073/pnas.1101494108. [DOI] [PMC free article] [PubMed] [Google Scholar]
- Petti AA, McIsaac RS, Ho-Shing O, Bussemaker HJ, Botstein D. Combinatorial control of diverse metabolic and physiological functions by transcriptional regulators of the yeast sulfur assimilation pathway. Mol Biol Cell. 2012;23:3008–3024. doi: 10.1091/mbc.E12-03-0233. [DOI] [PMC free article] [PubMed] [Google Scholar]
- R Development Core Team 2009. R: A Language and Environment for Statistical Computing, Vienna: R Foundation for Statistical Computing. Available at: http://www.r-project.org (accessed 1 October 2011)
- Ronen M, Botstein D. Transcriptional response of steady-state yeast cultures to transient perturbations in carbon source. Proc Natl Acad Sci USA. 2006;103:389–394. doi: 10.1073/pnas.0509978103. [DOI] [PMC free article] [PubMed] [Google Scholar]
- Rouillon A, Barbey R, Patton EE, Tyers M, Thomas D. Feedback-regulated degradation of the transcriptional activator Met4 is triggered by the SCFMet30 complex. EMBO J. 2000;19:282–294. doi: 10.1093/emboj/19.2.282. [DOI] [PMC free article] [PubMed] [Google Scholar]
- Rust MJ, Markson JS, Lane WS, Fisher DS, O'shea EK. Ordered phosphorylation governs oscillation of a three-protein circadian clock. Science. 2007;318:809–812. doi: 10.1126/science.1148596. [DOI] [PMC free article] [PubMed] [Google Scholar]
- Saeed AI, Bhagabati NK, Braisted JC, Liang W, Sharov V, Howe EA, Li J, Thiagarajan M, White JA, Quackenbush J. TM4 microarray software suite. Methods Enzymol. 2006;411:134–193. doi: 10.1016/S0076-6879(06)11009-5. [DOI] [PubMed] [Google Scholar]
- Saldanha AJ. Java Treeview—extensible visualization of microarray data. Bioinformatics. 2004;20:3246–3248. doi: 10.1093/bioinformatics/bth349. [DOI] [PubMed] [Google Scholar]
- Shen-Orr SS, Milo R, Mangan S, Alon U. Network motifs in the transcriptional regulation network of Escherichia coli. Nat Genet. 2002;31:64–68. doi: 10.1038/ng881. [DOI] [PubMed] [Google Scholar]
- Siggers T, Duyzend M, Reddy J, Kahn S, Bulyk M. Non-DNA-binding cofactors enhance DNA-binding specificity of a transcriptional regulatory complex. Mol Syst Biol. 2011:1–14. doi: 10.1038/msb.2011.89. [DOI] [PMC free article] [PubMed] [Google Scholar]
- Teixeira MC, Monteiro P, Jain P, Tenreiro S, Fernandes AR, Mira NP, Alenquer M, Freitas AT, Oliveira AL, Sa-Correia I. The YEASTRACT database: a tool for the analysis of transcription regulatory associations in Saccharomyces cerevisiae. Nucleic Acids Res. 2006;34:D446–D451. doi: 10.1093/nar/gkj013. [DOI] [PMC free article] [PubMed] [Google Scholar]
- Thomas-Chollier M, Sand O, Turatsinze JV, Janky R, Defrance M, Vervisch E, Brohee S, van Helden J. RSAT: regulatory sequence analysis tools. Nucleic Acids Res. 2008;36:W119–W127. doi: 10.1093/nar/gkn304. [DOI] [PMC free article] [PubMed] [Google Scholar]
- Troyanskaya O, Cantor M, Sherlock G, Brown P, Hastie T, Tibshirani R, Botstein D, Altman RB. Missing value estimation methods for DNA microarrays. Bioinformatics. 2001;17:520–525. doi: 10.1093/bioinformatics/17.6.520. [DOI] [PubMed] [Google Scholar]
- Tsai TY, Choi YS, Ma W, Pomerening JR, Tang C, Ferrell JE., Jr Robust, tunable biological oscillations from interlinked positive and negative feedback loops. Science. 2008;321:126–129. doi: 10.1126/science.1156951. [DOI] [PMC free article] [PubMed] [Google Scholar]
- Uttenweiler A, Schwarz H, Neumann H, Mayer A. The vacuolar transporter chaperone (VTC) complex is required for microautophagy. Mol Biol Cell. 2007;18:166–175. doi: 10.1091/mbc.E06-08-0664. [DOI] [PMC free article] [PubMed] [Google Scholar]
- Wunderlich Z, Mirny LA. Different gene regulation strategies revealed by analysis of binding motifs. Trends Genet. 2009;25:434–440. doi: 10.1016/j.tig.2009.08.003. [DOI] [PMC free article] [PubMed] [Google Scholar]
- Zhu C, et al. High-resolution DNA-binding specificity analysis of yeast transcription factors. Genome Res. 2009;19:556–566. doi: 10.1101/gr.090233.108. [DOI] [PMC free article] [PubMed] [Google Scholar]
- Zhu XM, Yin L, Hood L, Ao P. Robustness, stability and efficiency of phage lambda genetic switch: dynamical structure analysis. J Bioinform Comput Biol. 2004;2:785–817. doi: 10.1142/s0219720004000946. [DOI] [PubMed] [Google Scholar]
Associated Data
This section collects any data citations, data availability statements, or supplementary materials included in this article.