

Abstract
Inflammatory cytokine interleukin-1 (IL-1) performs multiple functions in the central nervous system. The type 1 IL-1 receptor (IL-1R1) and the IL-1 receptor accessory protein (IL-1RAcP) form a functional IL-1 receptor complex that is thought to mediate most, if not all, IL-1–induced effects. Several recent studies, however, suggest the existence of a heretofore-unidentified receptor for IL-1. In this study, we report that the IL-1R1 gene contains an internal promoter that drives the transcription of a shortened IL-1R1 mRNA. This mRNA is the template for a unique IL-1R protein that is identical to IL-1R1 at the C terminus, but with a shorter extracellular domain at the N terminus. We have termed this molecule IL-1R3. The mRNA and protein for IL-1R3 are expressed in normal and two strains of commercially available IL-1R1 knockout mice. Western blot analysis shows IL-1R3 is preferentially expressed in neural tissues. Furthermore, IL-1β binds specifically to IL-1R3 when it is complexed with the newly discovered alternative IL-1 receptor accessory protein, IL-1RAcPb. Stimulation of neurons expressing both IL-1R3 and IL-1RAcPb with IL-1β causes fast activation of the Akt kinase, which leads to an increase in voltage-gated potassium current. These results demonstrate that IL-1R3/IL-1RAcPb complex mediates a unique subset of IL-1 activity that accounts for many previously unexplained IL-1 effects in the central nervous system.
Keywords: signal transduction, NF-κB, p38
Proinflammatory cytokine interleukin-1 (IL-1) mediates numerous neuroimmunological and neurophysiological activities in the central nervous system (CNS) (1, 2). Typically, IL-1 induces cellular responses through a receptor complex consisting of IL-1 receptor (IL-1R) and IL-1R accessory protein (3). Binding of IL-1 to IL-1R recruits the IL-1R accessory protein. The juxtaposition of IL-1R and IL-1R accessory protein initiates a series of downstream signaling pathways leading to transcriptional changes or posttranslational modification of proteins. Two IL-1Rs have been identified so far: The type I IL-1R (IL-1R1) is generally accepted as the receptor through which IL-1 activates cellular signaling, whereas the type II IL-1R (IL-1R2) serves as a decoy receptor. There are also two different forms of IL-1R accessory proteins: The classical IL-1R accessory protein (IL-1RAcP) is expressed ubiquitously, whereas IL-1RAcPb, a novel isoform of IL-1RAcP due to alternative splicing of IL-1RAcP, is mainly expressed in CNS neurons (4, 5). The IL-1R1/IL-1RAcP receptor complex is thought to mediate most, if not all, IL-1–induced effects.
Several recent studies showed that some IL-1–induced effects—including its influence on brain tissue damage after cerebral ischemia, activation of JNK signaling pathway, and repression of IFN-γ mRNA expression—persist in IL-1R1 knockout (KO) animals (6, 7). Likewise, it was reported that IL-1ra, an antagonist of IL-1, fails to block some IL-1β–induced electrophysiological changes in neurons (8, 9). In addition, it is known that in neurons, IL-1 could use signaling pathways other than the classical NF-κB or p38 MAPK pathway, such as Src and Akt pathways (10, 11). These observations suggest that there is a yet-unidentified functional receptor for IL-1, at least in neuronal cells of the brain.
Several lines of evidence suggest that novel forms of IL-1R could be produced by the IL-1R1 gene itself. For example, three alternatively spliced IL-1R1 isoforms have been found in rat hepatocytes (12), although these isoforms do not explain neuron-specific activities of IL-1. Recently, we found two internal promoters for the human IL-1R1 gene, which could drive the production of a truncated IL-1R1 variant (13). We suspect this short IL-1R1 variant is a neuron-specific IL-1R. In this study, we show that the murine IL-1R1 (mIL-1R1) gene indeed contains an internal promoter that tissue-specifically drives the transcription of a shortened IL-1R1 mRNA. This mRNA is the template for the production of a unique IL-1R, IL-1R3, which is mostly expressed in neural tissues. Furthermore, IL-1R3 interacts with IL-1RAcPb, a neuron-specific IL-1RAcP isoform, to mediate IL-1β–induced increase of potassium current through fast activation of Akt kinases.
Results
Truncated Isoform of IL-1R Is Expressed in Neural Tissues.
To identify potential novel IL-1R isoforms, we used the strategy of combining CapFishing with nested PCR to determine the transcription start sites (TSSs) of mIL-1R1 from different tissues. The nested PCR forward primer for both the first and second round of PCR is the 5′ RACE primer, which recognizes the CapFishing adaptor. The six pairs of PCR reverse primers—targeting exons 1A, 1B, 1C, 3, 4, and 5/6, respectively—are listed in Table S1. For each pair of reverse primers, the second round (inner, green arrows) primer is immediately adjacent the first round (outer, purple arrows) primer (Fig. 1A). The gel results of CapFishing-nested PCR from mouse tissue RNA are shown in Fig. S1 (targeting the conventional TSSs) and Fig. 1B (targeting potential internal TSSs behind the conventional start codon). Various sizes of PCR products were observed from different tissues, indicating the existence of multiple TSSs. The nested PCR products were cloned into pCRII-TOPO vector and sequenced to determine the TSSs. The sequencing results were aligned by using two-sequence BLAST to the sequence of a mouse contig (National Center for Biotechnology Information GenBank accession no. NT_039170.7), which is located on mouse chromosome 1 and contains the full genomic sequence of mIL-1R1.
Fig. 1.

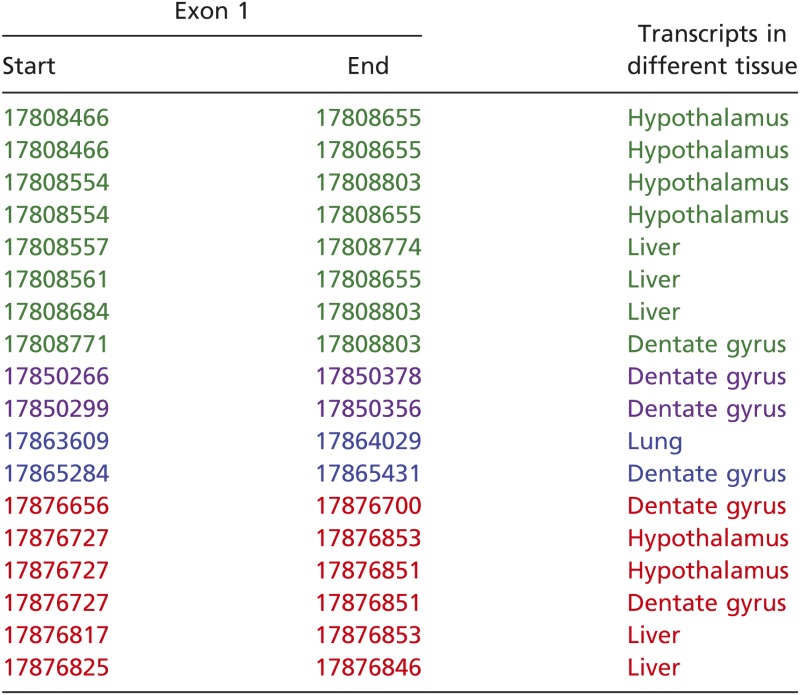
Identification of a unique TSS in IL-1R1 gene. (A) Diagrammatic illustration of the half-nested PCR used to increase the sensitivity of 5′ RACE. The forward RACE primers were included in the CapFishing kit. The reverse primers for two rounds of PCR targeting different exons are indicated by arrows (purple, outer primers for first round of PCR; green, inner primers for second round of PCR). (B) Electrophoresis results of the nested PCR results targeting TSS downstream of exon 2. RNAs used in CapFishing were extracted from the following tissues: dentate gyrus (Dg), hypothalamus (Hy), liver (Liv), and lung (Lun). (C) Annotation of TSSs found in the context of known mIL-1R1 genomic sequence. TSSs are presented in green, purple, blue, and red to match Table 1.
Four clusters of mIL-1R1 TSSs were found. They are represented in green, purple, blue, and red in Table 1 and Fig. 1C. Three of the clusters (TSS1, TSS2, and TSS3) are in agreement with our previous study (14), although >30 additional bases of the 5′ UTR regions in two of the three clusters were uncovered by the current method. Importantly, a unique fourth TSS cluster was identified. The foremost 5′ TSS of this cluster is at 17,876,656 and has been identified in dentate gyrus of hippocampus. The last TSS is at 17,876,825 and has been found in liver. This TSS cluster resides downstream of the canonical translation start codon (in exon 2), indicating the existence of a unique internal promoter. We have termed the promoter for this TSS P4. PCR amplification of cDNAs starting from this internal alternative exon 1 to the last exon of IL-1R1 uncovered an mRNA sequence that predicted a translated peptide. This predicted peptide is a truncated IL-1R1, missing the first 200 N terminus amino acids. We have termed this peptide IL-1R3.
Table 1.
Sequence analysis of mIL-1R TSS
 |
The sequences obtained from TSS study were aligned to the genomic DNA sequences of mIL-1R1. Four different clusters of TSSs are represented in green, purple, blue, and red.
To verify that mRNA driven by the P4 promoter encodes an expressed functional protein, IL-1R3 cDNA was cloned into pcDNA6.2 expression vector with either a GFP or a Flag tag at the C terminus. For comparison, we similarly constructed IL-1R1–GFP and IL-1R1–Flag. These constructs are shown in Fig. 2A. Fig. 2B shows that after transfection into Neuro-2a cells, the expression of IL-1R3–Flag, IL-1R3–GFP, IL-1R1–Flag, and IL-1R1–GFP can be detected by Western blot using an antibody (sc-689) against the C terminus of IL-1R1. The predicted size of IL-1R3–Flag, IL-1R3–GFP, IL-1R1–Flag, and IL-1R1–GFP are 45, 73, 68, and 96 kDa, respectively. These molecules are clearly identified by the corresponding bands in the Western blot. Immunofluorescence microscopy also shows the expression of IL-1R1–GFP and IL-1R3–GFP in transfected cells (Fig. 2C). It is important to note that Neuro-2a does not express IL-1R1 and IL-1R3 by itself, because neither IL-1R’s mRNA (14) nor protein was detected (Fig. 2B).
Fig. 2.

IL-1R3 is detected both in vitro and in vivo. (A) Diagrammatic illustration of IL-1R1/R3 cloning into pcDNA6.2 vector. IL-1R1/R3 was inserted after CMV promoter and followed by an in-frame GFP (emerald GFP; EmGFP) protein or a Flag tag. (B) Expression of IL-1R3-Flag (R3F), IL-1R3-GFP (R3G), IL-1R1-Flag (R1F), and IL-1R1-GFP (R1G) detected by Western blot. (C) Immunofluorescence microscopy images of Neuro-2a cells transfected with C terminus GFP-tagged IL-1R1/IL-1R3. (D) Diagrammatic illustration of IL-1R1 KO designs from current IL-1R1 KO lines. The entire IL-1R3 OFR can be detected by RT-PCR in both strains of IL-1R1 KO mice (arrows denote PCR primers). (E) IL-1R3 is detected in various regions of the brain in both IL-1R1 KO and normal animal by Western blot. In contrast, IL-1R1 can only be detected in normal animals. HI, hippocampus; HY, hypothalamus; Cb, cerebellum; Br, brain; Li, Liver.
Fig. 2D shows the design for two commercially available strains of IL-1R1 KO animals (15, 16). In both cases, the disruption of IL-1R1 gene occurred upstream of the ORF for IL-1R3, Therefore, if IL-1R3 exists in vivo, it could be retained in the IL-1R1 KO animals. We performed RT-PCR targeting the IL-1R3 ORF and subsequently sequenced the PCR product (arrows in Fig. 2D indicate the position for PCR primers). Results confirm that intact IL-1R3 ORF mRNA is expressed in both IL-1R1 KO animals. We then investigated whether IL-1R3 protein exists in vivo, especially in the brain. Fig. 2E shows the Western blot results from various tissues. HeLa cells transfected with IL-1R3–Flag were used as a positive control for IL-1R3 protein, and liver from normal mouse was used as a positive control for IL-1R1 protein. IL-1R3 protein was detected in various brain tissues of both normal and IL-1R1 KO mice. IL-1R3 protein was not detected in the liver. IL-1R1 protein was found in normal mice, but not in IL-1R1 KO mice. The presence of IL-1R3 protein in both normal and IL-1R1 KO neural tissues indicates that the internal promoter we discovered is functional in vivo.
IL-1β Binds IL-1R3 in the Presence of IL-1RAcPb.
Because IL-1R3 is a truncated version of IL-1R1, some of its structure features could be deduced from IL-1R1 structure. Domain structures of IL-1R3 and -1R1 based on amino acid sequence are shown in Fig. 3A. The predicted IL-1R3 structure and its potential interaction with IL-1/IL-1ra in comparison with IL-1R1 are shown in Fig. 3B. In the extracellular part, IL-1R1 has two sites (A and B) for IL-1 binding: IL-1β binds to both A and B sites, whereas IL-1ra only binds to site A (17). IL-1R3 does not have site A, but retains site B. Therefore, the retention of the last Ig-like domain in IL-1R3 could result in the retention of an IL-1β binding site on IL-1R3. We next tested whether IL-1β binds to IL-1R3.
Fig. 3.

IL-1β binds IL-1R3. (A) Diagrammatic illustration of the domains of IL-1R1 and -1R3. TM, transmembrane domain; TIR, tToll/IL-1R domain. Each open box represents a specific domain with numbers indicating the number of amino acids. (B) Diagrammatic illustration of predicted IL-1R3 structure and its potential interaction with IL-1/IL-1ra in comparison with IL-1R1. IL-1R3 is predicted to interact with IL-1 because IL-1R3 retains one (Ig-like domain 3) of the two IL-1 binding sites of IL-1R1. IL-1R3 is unlikely to bind IL-1ra because it does not have the IL-1ra binding site (between the first and the second Ig-like domains of IL-1R1). (C) Detection of cell-bound His-tagged IL-1β with anti-His antibody to IL-1R1–transfected (Upper) or IL-1R3–transfected (Lower) cells. IL-1β binds both receptors specifically [compared with vector (V) group] in a concentration-dependent manner. (Upper) Lanes 1, 2, and 3 correspond to results generated from 0.5, 5, and 50 nM His-IL-1β, respectively. (Lower) Lanes 1, 2, and 3 correspond to results generated from 0, 50, and 250 nM HisIL-1β, respectively.
His-tagged IL-1β was used to test binding of IL-1β to IL-1R1–transfected or IL-1R3–transfected Neuro-2a cells. Binding of His-IL–1β was detected by Western blot for His antigen bound to the cells. Fig. 3C shows that IL-1β binds to IL-R1–transfected and IL-1R3–transfected cells in a concentration-dependent manner. Equilibrium binding of IL-1β to IL-1R1 at 4 °C is detected after 1 h (Fig. 3C Upper) of incubation. Equilibrium binding of IL-1β to IL-1R3 was detected after overnight reaction (Fig. 3C Lower) in the presence of IL-1RAcPb. In contrast, cells cotransfected with IL-1R3 and IL-1RAcP did not bind IL-1β. The detected binding is specific for the expressed IL-1R1 or -1R3 because IL-1β binding to cells transfected with IL-1R1/3 is significantly higher than those transfected with an empty expression vector (V, Fig. 3C).
IL-1R3 Is Unable to Mediate Canonical IL-1 Signaling Responses.
One of the canonical IL-1 signaling responses is the activation of the NF-κB. NF-κB reporter assays were performed to determine whether IL-1R3 can mediate NF-κB signaling. As shown in Fig. 4A, IL-1β stimulated NF-κB activation in IL-1R1–transfected, but not IL-1R3–transfected, cells. Significant NF-κB activity was seen at 2.5 and 6.5 h after IL-1β. Thus, IL-1R3 does not mediate activation of the classical IL-1 signaling pathway, which is a relatively slow process. In addition, the fold increase of NF-κB activation mediated by IL-1β/IL-1R1 was similar in the presence of either empty vector (R1+V) or IL-1R3 (R1+R3), demonstrating that expression of IL-1R3 did not interfere with IL-1β/IL-1R1–mediated NF-κB activation.
Fig. 4.

Role of IL-1R3 in mediating IL-1β–induced signaling. (A) IL-1β induces NF-κB activation. Fold increase in luciferase activity over the baseline obtained from cells cotransfected with NF-κB reporter plasmid and empty vector (V) are presented. The means ± SE are presented from three separate experiments. *P < 0.05. (B) Detection of IL-1β–induced phosphorylation of Akt and p38 in cells transfected with IL-1R1/IL-1R3 in combination with IL-1RAcP/IL-1RAcPb. *, indicates increased phosphor-protein. (C) Detection of IL-1β–induced phosphorylation of Akt in cells transfected with IL-1R3 in combination with IL-1RAcP/IL-1RAcPb. Quantification of blots from three different experiments is shown below the blot. Densitometric values are expressed as pAkt/total Akt and then normalized to untreated cells (0 min). *P < 0.05. (D) Time course of IL-1β–induced Akt phosphorylation in cells cotransfected with IL-1R3 and IL-1RAcPb.
IL-1R3 Interacts with IL-1RAcPb to Mediate Alternative IL-1 Signaling Response.
Next, we performed kinase assays in Neuro-2a cells cotransfected with IL-1R3 and either control vector, IL-1RAcP, or IL-1RAcPb. For comparison, we cotransfected Neuro-2a cells with IL-1R1 in combination with the control vector, IL-1RAcP, or IL-1RAcPb. Twenty-four hours after transfection, cells were incubated in the absence or presence of IL-1β (10 ng/mL) for 5 min and harvested to analyze changes in the phosphorylation status of Akt and p38 MAPK by Western blot, using phosphor-specific antibodies developed against the activated form of Akt phosphorylated at Ser-473 and p38 phosphorylated at Thr-180/Tyr-182 (Fig. 4B). Consistent with previous reports, IL-1β treatment increased p38 phosphorylation in cells cotransfected with IL-1R1/IL-1RAcP and in cells transfected with IL-1R1. In contrast, IL-1β treatment did not increase p38 phosphorylation in cells cotransfected with IL-1R3/IL-1RAcP or IL-1R3/IL-1RAcPb. Interestingly, IL-1β treatment for 5 min increased Akt phosphorylation only in cells cotransfected with IL-1R3/IL-1RAcPb (Fig. 4B). To substantiate this result, cells were treated with IL-1β for 3 or 5 min to characterize Akt activation at short time intervals after the IL-1 stimulation. Fig. 4C shows that IL-1β induced significant Akt phosphorylation at both 3 and 5 min after the IL-1 stimulation, and the response was more dramatic at 3 min. We then performed a time course study on IL-1β–induced Akt phosphorylation on these cells up to 20 min after IL-1 stimulation. Results showed that maximal phosphorylation of Akt was detected at 2 min after IL-1β treatment, and no increased phosphorylation was detected after 10 min (Fig. 4D). Similar results were repeated in HEK293 cells cotransfected with different combinations of receptors and accessory proteins.
IL-1R3 Interacts with IL-1RAcPb to Mediate IL-1–Induced Potassium Current Increases.
IL-1β has been reported to induce changes in potassium currents in primary cultured neurons in an IL-1R1–independent manner (9). We investigated whether IL-1R3 could be the mediator for this IL-1β–induced response. Fig. 5A shows the actual traces of voltage-dependent outward potassium (Kv) currents in a cell cotransfected with IL-1R3/IL-1RAcPb. Application of IL-1β (10 ng/mL) increased Kv currents (red), and Kv currents returned to the baseline after IL-1β was washed out. Fig. 5B shows an example of this change in terms of amplitude over time. Stimulation of IL-1R3/IL-1RAcPb–transfected cells by IL-1β resulted in an increase of potassium current 2 min after IL-1β application in 5 of 19 (26.3%) cells. The response rate of these cells is consistent with the transfection efficiency (50% transfection efficiency for either IL-1R3 or IL-1RAcPb; 25% cotransfection efficiency). IL-1β did not induce changes in potassium current in any of the 13 tested cells cotransfected with IL-1R1/IL-1RAcP (Fig. 5C shows an example effect from a nonresponsive cell). Furthermore, pretreatment with Akt-specific inhibitor AKT-1 (5 μg/mL) completely abolished the potassium current increase induced by IL-1β in cells cotransfected with IL-1R3/IL-1RAcPb (0 of 15 cells tested showed any response).
Fig. 5.

IL-1β induces Kv current increases in cells cotransfected with IL-1R3/IL-1RAcPb. (A) Actual traces of Kv currents in an IL-1R3/IL-1RAcPb–transfected cell. (B) Representative Kv current amplitude increase after IL-1β stimulation in IL-1R3/IL-1RAcPb–cotransfected cells. (C) Representative null response after IL-1β stimulation in cells cotransfected with IL-1R1/IL-1RAcP.
Discussion
Many IL-1–mediated CNS effects can be paradoxical. For example, both neurotoxic and neuroprotective effects of IL-1 have been observed (18). Induction of IL-1 has been associated with the progression of Alzheimer’s disease, but overexpression of IL-1 in the brain can also reduce Alzheimer’s-related neuropathology (19). Likewise, IL-1 not only inhibits long-term potentiation (LTP) in hippocampal neurons, it is also required to maintain LTP (20). So far, only one functional receptor, IL-1R1, has been identified. It is difficult to explain the opposite effects of IL-1 based upon the assumption that all IL-1–induced effects are mediated through IL-1R1 signaling.
The existence of additional CNS IL-1Rs had been proposed for many years (21). Although many new IL-1 family member molecules and their corresponding receptors have been revealed by recent genetic analysis, no new IL-1Rs, besides IL-1R1 and -1R2 that were discovered nearly 20 y ago, have been found (22). IL-1R2 does not contain a functional intracellular domain and therefore can only serve as a decoy receptor. In this study, we searched for additional gene products within the IL-1R1 gene itself. We extended our previous study on IL-1R1 promoters by searching for TSSs downstream of the conventional start codon. The results show that the IL-1R1 gene produces a shortened IL-1R1 mRNA, driven by an internal promoter in the IL-1R1 gene, which leads to the production of IL-1R3. This internal promoter was missed in our first IL-1R1 promoter study (14) because we did not design the reverse primers for the 5′ RACE from sequences downstream of exon 2, assuming all IL-1R1 promoters are located upstream of the conventional start codon. Our second IL-1R1 promoter study searched for the TSSs in the human IL-1R1 gene without this assumption, and we were able to find internal promoters in the human IL-1R1 gene (13). The results of the present study confirm that the mIL-1R1 gene also contains a corresponding internal IL-1R1 promoter, which led to the discovery of the long-sought IL-1R3 hidden in the IL-1R1 gene.
IL-1R3 mRNA is mostly expressed in CNS tissues. Western blot results from various brain tissues—including hippocampus, hypothalamus, and cerebellum—confirmed that endogenous IL-1R3 is expressed in brain tissues. One difficulty in mapping IL-1R3 expression is that currently available antibodies that label IL-1R3 will also label IL-1R1. In addition, the mRNA for IL-1R3 is part of the IL-1R1 mRNA. Therefore, in situ hybridization of IL-1R3 will also label IL-1R1. Fortunately, IL-1R1 KO animals do not express IL-1R1, but express IL-1R3. Because all of the IL-1–induced responses that cannot be explained by IL-1R1 have been related to certain neuronal effects of IL-1, the restricted expression of IL-1R3 in neural tissues could provide a solution to the unexplained IL-1 effects.
Neuro-2a cells, a neuroblastoma-derived cell line, were used to investigate the function of IL-1R3. Neuro-2a cells do not express IL-1R1, -1R2, and -1R3, but they express IL-1RAcP constitutively. Therefore, exogenous IL-1R1 and -1R3 will be the only type of IL-1R expressed on these cells after transfection. In addition, the downstream classical signaling pathways that require IL-1RAcP can be investigated in this cell line. Results demonstrated that IL-1 stimulation of the NF-κB pathway requires IL-1R1 and IL-1R1AcP. However, expression of IL-1R3 was not sufficient to mediate IL-1–induced NF-κB activation and did not interfere with IL-1β/IL-1R1–mediated NF-κB activation. This finding is consistent with a recent report by Smith et al. (4) that showed IL-1 activates neuronal signaling in vivo without activating NF-κB.
IL-1RAcP is a required receptor partner in IL-1R1 signaling. Recently, IL-1RAcPb, a novel isoform of IL-1RAcP that is mainly expressed in CNS neurons, was identified. The function of IL-1R1AcPb remains unclear, although it may mediate IL-1–induced activation of Src kinase (4, 5). Because IL-1R3 is also mainly expressed in neural tissues, we suspected that the function of IL-1R3 could be revealed in the presence of IL-1RAcPb in neurons. One difficulty is that both transfected IL-1R3 and IL-1RAcPb express these proteins at very low levels, compared to those produced by transfected IL-1R1 and IL-1RAcP. To circumvent this difficulty, we tested IL-1R3 function in both Neuro-2a and HEK293 cells. HEK293 cells, human kidney cells, were chosen because they allow high efficiency of transfection and do not bind mIL-1β without transiently cotransfecting with mIL-1R and mIL-1RAcP (23). Results from both cell lines demonstrate that IL-1R3 cooperates with IL-1RAcPb, but not IL-1RAcP, to bind IL-1β and mediate IL-1β–induced neuronal activity.
Several previous studies suggested that IL-1 induces neuronal cellular signaling via nonclassical pathways, including phosphorylation of Akt and Src (10, 11). IL-1–induced activation of Src is MyD88-dependent, whereas IL-1–induced activation of Akt is MyD88-independent (11). It is also known that IL-1RAcPb is recruited to ligand-bound IL-1R1 in a similar fashion to IL-1RAcP. However, it cannot recruit adaptor molecule MyD88 and initiate downstream canonical signaling responses (4). Consistent with this conclusion, we found that IL-1R3 interacts with IL-1RAcPb, but not IL-1RAcP, to activate the MyD88-independent Akt. Interestingly, IL-1R3/IL-1RAcPb complex-mediated IL-1β–induced activation of Akt kinase is very fast, because phosphorylation of Akt was detected in minutes after IL-1β treatment. These features of IL-1R3–mediated signaling may explain previously reported findings that IL-1 can stimulate neuronal activation without activating the NF-κB pathway (24, 25) and that IL-1 is capable of inducing fast electrophysiological effects that cannot be explained by the slow classical IL-1R1–mediated signaling pathways.
IL-1 was found to induce voltage-dependent current changes in retinal ganglion cells. This effect is independent of IL-1R1 because it cannot be inhibited by IL-1ra (9). IL-1R3 could be the mediator for this effect because the binding site for IL-1ra is lacking in IL-1R3. Indeed, our results show that IL-1β can induce an increase of Kv current via the IL-1R3/IL-1RAcPb complex. Of note, this effect occurs 2–3 min after IL-1β application and disappears after 5 min. This effect is consistent with the duration of Akt kinase activation after IL-1β treatment. Furthermore, pretreatment with Akt-specific inhibitor AKT-1 completely abolished this effect. Together, these results clearly show that IL-1R3/IL-1RAcPb complex mediates IL-1–induced potassium current increase via Akt kinase activation. Therefore, IL-1β–induced Akt kinase phosphorylation could cause a change in the potassium channel protein that contributes to rapid effects on neuronal activity.
In summary, the present study identifies a unique IL-1R, IL-1R3. IL-1R3 is expressed mainly in neural tissues. Activation of IL-1R3 by IL-1β does not activate NF-κB and p38 MAPK, the classical IL-1 signaling pathways. IL-1R3 interacts with IL-1RAcPb to mediate IL-1–induced increase in Kv current via Akt kinase. These features of IL-1R3–mediated effects explain some of the previously unexplained IL-1 effects in neurons.
Material and Methods
Sample Collection and RNA Isolation.
Mouse tissues were collected immediately after decapitation and stored in TRIzol at −70 °C for RNA isolation. One milliliter of TRIzol reagent (Invitrogen) was added to 100 mg of tissue. Tissue mass was homogenized to generate cell suspension. Total RNA was extracted by following manufacturer’s instructions. Total RNA in RNase-free H2O was then digested with DNase I (Invitrogen) to remove residual genomic DNA.
First-Strand cDNA Synthesis Using the CapFishing Kit.
First-strand cDNA was generated by following manufacturer’s instructions of the CapFishing kit (Seegene). Briefly, 1 μg of total RNA was added to the 4 μL of 5 mM dNTP, 2 μL of 10 μM random hexamer, and diethylpyrocarbonate-treated H2O for a total volume of 10.5 μL. This mixture was incubated at 75 °C for 3 min and chilled on ice. Then, 4 μL of 5× reaction buffer (pH 7.2), 1 μL of 0.1 M DTT, 1 μL of CapFishing solution, 2 μL of BSA (1 mg/mL), 20 units of RNase inhibitor, and 200 units of SuperScript II reverse transcriptase (Invitrogen) was added to the mixture. The reaction was incubated at 42 °C for 1 h. Three microliters of preheated CapFishing adaptor (75 °C for 3 min) was added to the reaction, and the entire mixture was incubated on ice for 2 min, to assist the binding of the CapFishing adaptor to 5′ cap intact mRNA. Subsequently, 60 units of reverse transcriptase were added to the reaction and incubated at 42 °C for 30 min, and then the reverse transcriptase was inactivated at 70 °C for 15 min and 94 °C for 5 min. The entire procedure was performed in a PCR-iCycler (Bio-Rad). The first-strand cDNA product was diluted 10 times for further PCRs.
PCR for 5′ RACE and Sequencing.
Because mIL-1R1 is typically expressed at very low levels, half-nested PCR (shown in Fig. 1A) was used to increase the specificity and sensitivity of the 5′ RACE. The sequence of 5′ RACE primer (forward primer) is part of the CapFishing adaptor. It ensures that only the first-strand cDNAs, which were reverse-transcribed from 5′ cap intact mRNAs, can be amplified by this nested PCR. In the first round of PCR, 5′ RACE primer and outer target-specific primers (TSPs) in various exons were used. In the second round of PCR, 5′ RACE primer (again) and inner TSPs in various exons were used. In all, 25∼35 cycles of amplification were carried out under the following conditions for each cycle: denaturing at 94 °C for 30∼40 s, annealing at 58∼60 °C for 30∼40 s, and extension at 72 °C for 30 s to ∼2 min. The first-round PCR products were diluted and used as templates for the second round of PCR. The second-round PCR inner TSPs are immediately upstream of the outer TSPs. The PCR products were resolved in a 2100 bioanalyzer (Agilent). Sequences of all primers are listed in Table 1. The nested PCR products were cloned into pCRII-TOPO vector (Invitrogen) and then sequenced at the sequencing facility of Ohio State University to determine the TSSs.
Mouse Tissue Western Blot.
Tissues were collected and homogenized in lysis buffer (1% Nonidet P-40, 10% (vol/vol) glycerol, 20 mM Tris, pH 8.0, 137 mM NaCl, 1 mM MgCl2, 0.5 mM EDTA, and 10 mM sodium pyrophosphate) with protease inhibitor mixture (P8340; Sigma). Homogenized samples were incubated on ice for at least 15 min and spun at 13,000 × g for 10 min. Supernatants were collected. Lysate concentrations were measured with the bicinchoninic acid method (Pierce). For each gel, the same amount (60 μg) of lysate was loaded for each lane. SC-689 anti-C terminus–IL-1R1 antibody (1:1,000 dilution) (Santa Cruz) was used to detect IL-1R1 and IL-1R3. Western blot signal was detected by using the LI-COR infrared imaging system.
IL-1R3/R1and IL-1RAcP/IL-1RAcPb Expression Plasmids.
ORFs of IL-1R3 and IL-1R1 were cloned into pcDNA6.2 expression vector either as a C terminus EmGFP fusion protein or as a C terminus Flag-tagged protein. IL-1RAcP and IL-1RAcPb expression plasmids (pDC-mAcP and pDC-mAcPb) were provided by Dirk Smith of Amgen.
Binding Assay.
His-tagged recombinant IL-1β (United States Biological) was used to test the binding of IL-1 to IL-1R3. Twenty-four hours after transfection, cells were washed twice with binding medium (1% BSA, 20 mM Hepes in Dulbecco's Modified Eagle medium) and equilibrated in the binding medium at 4 °C for 1 h with gentle shaking. His–IL-1β (USB) was then added into the medium, and cells were incubated at 4 °C for the desired length of time. After binding, cell pellets were harvested, washed six times with cold PBS, and sonicated in 1× SDS loading buffer. Western blot for His-tag was performed with anti-His Tag monoclonal antibody (1:500 dilution) from Genscript.
Cell Culture, Transfection, NF-κB Reporter Assay, and Kinase Assay.
Neuro-2a and HEK293 cells were obtained from the American Type Culture Collection and maintained at 37 °C in modified Eagle’s medium containing 10% FBS and antibiotics. Cells were transfected by using Polyjet DNA transfection reagent (SignaGen Laboratories) according to the manufacturer’s instructions. Activation of NF-κB was detected by cotransfection of an NF-κB reporter construct and analysis of luciferase activity as described (14). Kinase activation was detected by Western blot using specific antibodies (1:1,000 dilution) developed against the activated form of Akt phosphorylated at Ser-473 (Cell Signaling Technology) and p38 phosphorylated at Thr-180/Tyr-182 (Cell Signaling Technology). Total Akt and p38 were measured as loading controls, using anti-Akt antibody (1:1,000 dilution) (Cell Signaling Technology) and anti-p38 antibody (1:1,000) (Cell Signaling Technology). Densitometric quantification of blots was performed by using the LI-COR infrared imaging system. No significant difference in loading controls was found in all of the samples in each Western blot.
Whole-Cell Patch Clamp.
Twenty-four hours after transfection, cells were harvested and prepared for patch clamping. Kv currents were measured by using the Nanion chip-based port-a-patch system (EPC-10; HEKA). The electrolyte solutions used had following compositions: extracellular solutions (osmolarity: 298 mOsmol): 140 mM NaCl, 4 mM KCl, 1 mM MgCl2, 2 mM CaCl2, 5 mM d-glucose monohydrate, 10 mM Hepes/NaOH, pH 7.4; intracellular solutions (osmolarity: 258 mOsmol): 50 mM KCl, 10 mM NaCl, 60 mM K-fluoride, 20 mM EGTA, 10 mM Hepes/KOH, pH 7.2. Kv currents were determined at a depolarizing potential of +50 mV from a holding potential of −80 mV. Mean current at the end of pulse were used for analysis. IL-1β dissolved in extracellular solutions was applied to cells after 25–35 stable sweeps.
Supplementary Material
Acknowledgments
This work was supported by National Institutes of Health Award GRT00016597 (to N.Q.).
Footnotes
The authors declare no conflict of interest.
*This Direct Submission article had a prearranged editor.
This article contains supporting information online at www.pnas.org/lookup/suppl/doi:10.1073/pnas.1205207109/-/DCSupplemental.
References
- 1.Quan N, Banks WA. Brain-immune communication pathways. Brain Behav Immun. 2007;21:727–735. doi: 10.1016/j.bbi.2007.05.005. [DOI] [PubMed] [Google Scholar]
- 2.Viviani B, Gardoni F, Marinovich M. Cytokines and neuronal ion channels in health and disease. Int Rev Neurobiol. 2007;82:247–263. doi: 10.1016/S0074-7742(07)82013-7. [DOI] [PubMed] [Google Scholar]
- 3.Wesche H, et al. The interleukin-1 receptor accessory protein (IL-1RAcP) is essential for IL-1-induced activation of interleukin-1 receptor-associated kinase (IRAK) and stress-activated protein kinases (SAP kinases) J Biol Chem. 1997;272:7727–7731. doi: 10.1074/jbc.272.12.7727. [DOI] [PubMed] [Google Scholar]
- 4.Smith DE, et al. A central nervous system-restricted isoform of the interleukin-1 receptor accessory protein modulates neuronal responses to interleukin-1. Immunity. 2009;30:817–831. doi: 10.1016/j.immuni.2009.03.020. [DOI] [PMC free article] [PubMed] [Google Scholar]
- 5.Huang Y, Smith DE, Ibáñez-Sandoval O, Sims JE, Friedman WJ. Neuron-specific effects of interleukin-1β are mediated by a novel isoform of the IL-1 receptor accessory protein. J Neurosci. 2011;31:18048–18059. doi: 10.1523/JNEUROSCI.4067-11.2011. [DOI] [PMC free article] [PubMed] [Google Scholar]
- 6.Loscher CE, Mills KH, Lynch MA. Interleukin-1 receptor antagonist exerts agonist activity in the hippocampus independent of the interleukin-1 type I receptor. J Neuroimmunol. 2003;137:117–124. doi: 10.1016/s0165-5728(03)00072-9. [DOI] [PubMed] [Google Scholar]
- 7.Touzani O, et al. Interleukin-1 influences ischemic brain damage in the mouse independently of the interleukin-1 type I receptor. J Neurosci. 2002;22:38–43. doi: 10.1523/JNEUROSCI.22-01-00038.2002. [DOI] [PMC free article] [PubMed] [Google Scholar]
- 8.Desson SE, Ferguson AV. Interleukin 1beta modulates rat subfornical organ neurons as a result of activation of a non-selective cationic conductance. J Physiol. 2003;550:113–122. doi: 10.1113/jphysiol.2003.041210. [DOI] [PMC free article] [PubMed] [Google Scholar]
- 9.Diem R, Hobom M, Grötsch P, Kramer B, Bähr M. Interleukin-1 beta protects neurons via the interleukin-1 (IL-1) receptor-mediated Akt pathway and by IL-1 receptor-independent decrease of transmembrane currents in vivo. Mol Cell Neurosci. 2003;22:487–500. doi: 10.1016/s1044-7431(02)00042-8. [DOI] [PubMed] [Google Scholar]
- 10.Sanchez-Alavez M, Tabarean IV, Behrens MM, Bartfai T. Ceramide mediates the rapid phase of febrile response to IL-1beta. Proc Natl Acad Sci USA. 2006;103:2904–2908. doi: 10.1073/pnas.0510960103. [DOI] [PMC free article] [PubMed] [Google Scholar]
- 11.Davis CN, et al. MyD88-dependent and -independent signaling by IL-1 in neurons probed by bifunctional Toll/IL-1 receptor domain/BB-loop mimetics. Proc Natl Acad Sci USA. 2006;103:2953–2958. doi: 10.1073/pnas.0510802103. [DOI] [PMC free article] [PubMed] [Google Scholar]
- 12.Yamada M, et al. Characterization of alternatively spliced isoforms of the type I interleukin-1 receptor on iNOS induction in rat hepatocytes. Nitric Oxide. 2007;17:98–105. doi: 10.1016/j.niox.2007.06.003. [DOI] [PubMed] [Google Scholar]
- 13.Li Q, Zhang H, Chen Q, Quan N. Existence of seven human IL-1R1 promoters. J Inflamm Res. 2010;2010:17–24. doi: 10.2147/JIR.S7095. [DOI] [PMC free article] [PubMed] [Google Scholar]
- 14.Chen Q, et al. Three promoters regulate tissue- and cell type-specific expression of murine interleukin-1 receptor type I. J Biol Chem. 2009;284:8703–8713. doi: 10.1074/jbc.M808261200. [DOI] [PMC free article] [PubMed] [Google Scholar]
- 15.Labow M, et al. Absence of IL-1 signaling and reduced inflammatory response in IL-1 type I receptor-deficient mice. J Immunol. 1997;159:2452–2461. [PubMed] [Google Scholar]
- 16.Glaccum MB, et al. Phenotypic and functional characterization of mice that lack the type I receptor for IL-1. J Immunol. 1997;159:3364–3371. [PubMed] [Google Scholar]
- 17.Evans RJ, et al. Mapping receptor binding sites in interleukin (IL)-1 receptor antagonist and IL-1 β by site-directed mutagenesis. Identification of a single site in IL-1ra and two sites in IL-1 β. J Biol Chem. 1995;270:11477–11483. doi: 10.1074/jbc.270.19.11477. [DOI] [PubMed] [Google Scholar]
- 18.Friedman WJ. Interactions of interleukin-1 with neurotrophic factors in the central nervous system: Beneficial or detrimental? Mol Neurobiol. 2005;32:133–144. doi: 10.1385/MN:32:2:133. [DOI] [PubMed] [Google Scholar]
- 19.Shaftel SS, Griffin WS, O’Banion MK. The role of interleukin-1 in neuroinflammation and Alzheimer disease: An evolving perspective. J Neuroinflammation. 2008;5:7. doi: 10.1186/1742-2094-5-7. [DOI] [PMC free article] [PubMed] [Google Scholar]
- 20.Schneider H, et al. A neuromodulatory role of interleukin-1beta in the hippocampus. Proc Natl Acad Sci USA. 1998;95:7778–7783. doi: 10.1073/pnas.95.13.7778. [DOI] [PMC free article] [PubMed] [Google Scholar]
- 21.Boutin H, Kimber I, Rothwell NJ, Pinteaux E. The expanding interleukin-1 family and its receptors: Do alternative IL-1 receptor/signaling pathways exist in the brain? Mol Neurobiol. 2003;27:239–248. doi: 10.1385/MN:27:3:239. [DOI] [PubMed] [Google Scholar]
- 22.O’Neill LA. The interleukin-1 receptor/Toll-like receptor superfamily: 10 years of progress. Immunol Rev. 2008;226:10–18. doi: 10.1111/j.1600-065X.2008.00701.x. [DOI] [PubMed] [Google Scholar]
- 23.Malinowsky D, Lundkvist J, Layé S, Bartfai T. Interleukin-1 receptor accessory protein interacts with the type II interleukin-1 receptor. FEBS Lett. 1998;429:299–302. doi: 10.1016/s0014-5793(98)00467-0. [DOI] [PubMed] [Google Scholar]
- 24.Srinivasan D, Yen J-H, Joseph DJ, Friedman W. Cell type-specific interleukin-1β signaling in the CNS. J Neurosci. 2004;24:6482–6488. doi: 10.1523/JNEUROSCI.5712-03.2004. [DOI] [PMC free article] [PubMed] [Google Scholar]
- 25.Proescholdt MG, et al. Intracerebroventricular but not intravenous interleukin-1beta induces widespread vascular-mediated leukocyte infiltration and immune signal mRNA expression followed by brain-wide glial activation. Neuroscience. 2002;112:731–749. doi: 10.1016/s0306-4522(02)00048-9. [DOI] [PubMed] [Google Scholar]
Associated Data
This section collects any data citations, data availability statements, or supplementary materials included in this article.