

Background: The corticotropin-releasing factor receptor type 2a is a GPCR possessing an N-terminal pseudo signal peptide with unknown function.
Results: The pseudo signal peptide prevents receptor oligomerization.
Conclusion: We have identified a monomeric GPCR and a novel functional domain playing a role in receptor oligomerization.
Significance: The pseudo signal peptide may be useful to study the functional significance of GPCR oligomerization in general.
Keywords: Fluorescence Correlation Spectroscopy, Fluorescence Resonance Energy Transfer (FRET), G Protein-coupled Receptor (GPCR), G Proteins, Transport, Corticotropin-releasing Factor Receptors, Receptor Dimerization, Receptor Oligomerization, Receptor Transport, Signal Peptide
Abstract
N-terminal signal peptides mediate the interaction of native proteins with the translocon complex of the endoplasmic reticulum membrane and are cleaved off during early protein biogenesis. The corticotropin-releasing factor receptor type 2a (CRF2(a)R) possesses an N-terminal pseudo signal peptide, which represents a so far unique domain within the large protein family of G protein-coupled receptors (GPCRs). In contrast to a conventional signal peptide, the pseudo signal peptide remains uncleaved and consequently forms a hydrophobic extension at the N terminus of the receptor. The functional consequence of the presence of the pseudo signal peptide is not understood. Here, we have analyzed the significance of this domain for receptor dimerization/oligomerization in detail. To this end, we took the CRF2(a)R and the homologous corticotropin-releasing factor receptor type 1 (CRF1R) possessing a conventional cleaved signal peptide and conducted signal peptide exchange experiments. Using single cell and single molecule imaging methods (fluorescence resonance energy transfer and fluorescence cross-correlation spectroscopy, respectively) as well as biochemical experiments, we obtained two novel findings; we could show that (i) the CRF2(a)R is expressed exclusively as a monomer, and (ii) the presence of the pseudo signal peptide prevents its oligomerization. Thus, we have identified a novel functional domain within the GPCR protein family, which plays a role in receptor oligomerization and which may be useful to study the functional significance of this process in general.
Introduction
Two subtypes of corticotropin-releasing factor (CRF)3 receptors are known, the CRF1R and CRF2R (1, 2). The CRF1R is expressed mainly in the anterior pituitary and plays a central role in the regulation of the hypothalamic-pituitary-adrenal stress axis in mammals (3). Three splice variants have been described for the CRF2R, namely the CRF2(a)R, CRF2(b)R, and CRF2(c)R. They are involved in the regulation of feeding behavior and stress recovery and may also be involved in modulating anxiety-related behavior (4, 5). Both CRF receptor subtypes couple to the Gs/adenylyl cyclase system and use cAMP as a second messenger. In the case of the CRF1R, a promiscuous coupling behavior has been described involving G proteins of the Gi, Go, and Gq families (e.g. see Refs. 6–8).
The CRF receptors belong to the small group of GPCRs (5–10%) possessing putative N-terminal signal peptides. An initial function of signal peptides is to target nascent chains to the translocon complex of the ER by binding the signal recognition particle. Moreover, the signal sequence is involved in opening of the Sec61 protein-conducting channel of the translocon complex in order to integrate the nascent chain into the bilayer. Signal peptides are usually cleaved off during early protein biogenesis. The majority (90–95%) of the GPCRs do not possess cleavable signal peptides. Here, one of the transmembrane helices of the mature receptors (usually transmembrane helix 1) mediates ER targeting/insertion as an uncleaved signal anchor sequence (9).
In the case of the CRF1R, it was demonstrated that the receptor has a conventional and cleaved signal peptide, which is necessary for efficient receptor biosynthesis (10). The CRF2(a)R instead possesses a pseudo signal peptide, which is unable to mediate ER targeting, remains uncleaved, and forms an additional hydrophobic domain at the N tail of the receptor, which is so far unique within the GPCR protein family (11–14). Conventional signal peptide functions are blocked by a single amino acid residue (Asn13), and mutation of this residue causes conversion to a cleaved signal peptide (11). The presence of the pseudo signal peptide leads to a relatively low receptor expression and surprisingly prevents coupling of the CRF2(a)R to the Gi protein by a yet unknown mechanism (12). The CRF2(a)R consequently only couples to Gs. The CRF1R, in contrast, couples both Gs and Gi leading to a bell-shaped biphasic concentration response curve when the receptor is stimulated by an agonist (12, 15).
A large line of evidence demonstrates that GPCRs are able to dimerize/oligomerize (homo- and hetero-oligomerization) and that this process has important consequences for receptor function (16–18). It is noteworthy that hetero-oligomerization of GPCRs may also affect the selectivity of the receptors for different G proteins. An influence on Gi coupling, for example, was observed upon coexpression of μ- and δ-opioid receptors (19, 20), CCR5 and CCR2 chemokine receptors (21), and MT1 and MT2 melatonin receptors (22). Homo-oligomerization was reported to influence coupling selectivity for Gs and Gq in the case of the thyrotropin receptor (23). Thus, one may speculate that the impairment of Gi coupling observed in the case of the CRF2(a)R could also be mediated by the pseudo signal peptide via an influence on receptor homo-oligomerization. Here we have analyzed the significance of the pseudo signal for receptor oligomerization in comparison with the conventional signal peptide of the homologous CRF1R. We used single cell and single molecule imaging methods as well as biochemical methods and show that the pseudo signal peptide of the CRF2(a)R indeed prevents receptor oligomerization and that the CRF2(a)R is consequently a monomeric GPCR.
EXPERIMENTAL PROCEDURES
Materials
The cDNAs encoding the rat CRF1R and CRF2(a)R were a gift from U. B. Kaupp (Forschungszentrum Caesar, Bonn, Germany). The construct AKAP18α.mCherry was kindly provided by E. Klussmann (Max-Delbrück-Centrum für Molekulare Medizin, Berlin, Germany). The vectors pECFP-N1, pEYFP-N1, pEGFP-N1, and pmCherry-N1 were obtained from Clontech (Mountain View, CA). The transfection reagents LipofectamineTM 2000 and PEI were purchased from Invitrogen and Polysciences Europe GmbH (Eppelheim, Germany), respectively. The plasma membrane marker CellMaskTM Deep Red was from Molecular Probes (Darmstadt, Germany). The alkaline phosphatase-conjugated anti-rabbit IgG and alkaline phosphatase-conjugated anti-mouse IgG were from Dianova (Hamburg, Germany). The monoclonal mouse anti-GFP and anti-FLAG M2 antibodies were obtained from BD Biosciences and from Sigma-Aldrich, respectively. The polyclonal rabbit anti-FLAG antibody was received from Cell Signaling Technology (Danvers, MA). Oligonucleotides were from Biotez (Berlin, Germany). The Roti-Load sample buffer was from Carl Roth (Karlsruhe, Germany). PNGase F was from New England Biolabs (Frankfurt a.M., Germany). All other reagents were from Sigma-Aldrich.
DNA Manipulations
Standard DNA manipulations were carried out according to Sambrook and Russell (24). The nucleotide sequences of the plasmid constructs were verified using the FS dye terminator kit from PerkinElmer Life Sciences. Site-directed mutagenesis was carried out with the QuikChange site-directed mutagenesis kit from Stratagene (Heidelberg, Germany).
Plasmid Constructs
The constructs used in this study are schematically shown in Fig. 1 (details of the cloning procedures available upon request). The full-length CRF2(a)R and CRF1R were C-terminally tagged with GFP, CFP, YFP, or mCherry-FLAG at positions Val411 (CRF2(a)R) and Thr413 (CRF1R), thereby deleting the stop codons. The resulting plasmids were pCRF2(a)R.GFP, pCRF2(a)R.CFP, pCRF2(a)R.YFP, pCRF2(a)R.mCherry, pCRF1R.GFP, pCRF1R.CFP, pCRF1R.YFP, and pCRF1R.mCherry. The corresponding pSP1-CRF2(a)R and pSP2-CRF1R derivatives encode the signal peptide swap mutants. For fluorescence cross-correlation spectroscopy (FCCS) and co-immunoprecipitation experiments, we used the mCherry-tagged A kinase anchor protein AKAP18α as a control (construct AKAP18α.mCherry). For co-immunoprecipitation experiments, the mCherry-tagged receptors were also fused C-terminally with an additional FLAG tag. For FRET experiments, YFP-tagged AKAP18α was used (construct AKAP18α.YFP).
FIGURE 1.

Schematic representation of the receptor constructs used in this study (see “Experimental Procedures” for details). A, sequence of the conventional cleaved signal peptide (SP1) of the CRF1R (left) and the pseudo signal peptide (SP2) of the CRF2(a)R (right). Residue Asn13 in the pseudo signal peptide of the CRF2(a)R preventing conventional signal peptide functions (11) is depicted in boldface type. B, plasmid constructs. The full-length wild type receptor constructs and the signal peptide swap mutants are indicated. The signal peptides (SP1 and SP2) and the transmembrane domains (Roman numerals) of the CRF1R constructs (gray) and the CRF2(a)R constructs (black) are indicated by boxes. The Arabic numerals above each construct indicate the number of receptor amino acid residues present (without signal peptide). The Arabic numerals below each construct indicate the number of amino acids forming the signal peptide. Constructs were C-terminally tagged with the fluorophores (Fluo) specified in the construct name. As a negative control for oligomerization experiments, the membrane-attached mCherry- or YFP-tagged AKAP18α protein was used as a control (not shown in B).
Cell Culture and Transfection
Human embryonic kidney cells (HEK 293 cells) were grown in Dulbecco's modified Eagle's medium (DMEM) containing 10% (v/v) fetal calf serum. Cells were cultured at 37 °C and 5% CO2. For microscopic analyses, DMEM without phenol red was used. Transfection of the cells with LipofectamineTM 2000 (microscopic analyses) or PEI (biochemical analyses) was carried out according to the supplier's recommendations 24 h after seeding of cells.
Co-Immunoprecipitation Experiments
HEK 293 cells (4 × 10⁶) were grown on 100-mm dishes and transiently co-transfected with plasmids using PEI according to the supplier's recommendations. Cells were cultivated for 24 h, washed twice with PBS (pH 7.4), and lysed for 1 h with 2 ml of lysis buffer (25 mm Tris-HCl, 10 mm CaCl2, 0.1% (v/v) Triton X-100, 0.5 mm PMSF, 0.5 mm benzamidine, 1.4 μg/ml aprotinin, and 3.2 μg/ml trypsin inhibitor, pH 8.0). Insoluble debris was removed by centrifugation (30 min, 5000 × g). The supernatant was supplemented with monoclonal mouse anti-FLAG M2 antibody coupled to protein A-Sepharose Cl-4B beads, and the sample was incubated overnight (protein A-Sepharose Cl-4B beads were prepared by equilibrating 3.5 mg/dish of the beads with PBS and subsequent overnight incubation with 2 μl of monoclonal mouse anti-FLAG M2 antibody). mCherry.FLAG-tagged receptors were precipitated (2 min, 700 × g), and the beads were washed once with 2 ml of lysis buffer and once with 2 ml of buffer C (25 mm Tris-HCl, 10 mm CaCl2, 0.5 mm PMSF, 0.5 mm benzamidine, 1.4 μg/ml aprotinin, 3.2 μg/ml trypsin inhibitor, pH 8.0). Afterward, beads were washed once with buffer D (25 mm Tris-HCl, 2 mm EDTA, 0.5 mm PMSF, 0.5 mm benzamidine, 1.4 μg/ml aprotinin, and 3.2 μg/ml trypsin inhibitor, pH 8.0). Precipitated receptors were split into two samples. The first sample was directly supplemented with Roti-Load sample buffer, incubated for 5 min at 95 °C, and used for SDS-PAGE immunoblot analysis (10% SDS, 48-cm2 gels). Co-precipitated receptors were detected using a monoclonal mouse anti-GFP antibody (1:4000) and alkaline phosphatase-conjugated anti-mouse IgG (1:1500). Proteins in the second sample were treated with PNGase F (New England Biolabs; 4.25 units/sample) for 1 h at 37 °C in the buffer provided by the manufacturer. Thereafter, the second sample was supplemented with loading buffer and used for SDS-PAGE immunoblotting. The precipitated mCherry.FLAG-tagged receptors were detected as a loading control using a polyclonal rabbit anti-FLAG antibody (1:2000) and alkaline phosphatase-conjugated anti-rabbit IgG (1:1000). PNGase F treatment was carried out to obtain single protein bands.
Confocal LSM; Localization and Quantification of the mCherry-tagged Receptor Constructs at the Plasma Membrane
Transiently transfected HEK 293 cells (1.5 × 10⁵) expressing the receptor constructs were grown on 30-mm glass coverslips (pretreated with 100 μg/ml poly-l-lysine) in 35-mm diameter dishes. After 24 h of incubation, coverslips were transferred into a self-made chamber (details available upon request).
For colocalization studies, the cells were incubated at 37 °C with the plasma membrane marker CellMaskTM Deep Red (1:2500 in PBS) for 5 min. The mCherry-tagged receptors were visualized using the laser-scanning microscope LSM710-ConfoCor3 (Carl Zeiss MicroImaging GmbH, Jena, Germany) system with a ×100/1.3 numerical aperture oil objective. The mCherry-tagged receptors were detected on one channel (diode-pumped solid state laser; λex = 561 nm, 565–640-nm band pass filter), CellMaskTM Deep Red fluorescence was recorded on a second channel (HeNe laser; λex = 633 nm, 650–740-nm band pass filter), and the overlay with the mCherry signals was computed. The spectral parts were split using an MBS 488/561 for channel one and an MBS 488/561/633 for channel two. Images were analyzed using the ZEN 2010 software (Carl Zeiss MicroImaging GmbH).
Quantification of the fluorescence intensity of the mCherry-tagged receptors in the plasma membrane was carried out using a LSM710-ConfoCor3 system (Carl Zeiss MicroImaging GmbH) and a C-Apochromat ×40/1.20 numerical aperture water objective lens (diode-pumped solid state laser; λex = 561 nm, 565–720-nm band pass filter). The spectral parts were split using an MBS 488/561. Microscope settings remained constant during all measurements. Images with frame sizes of 512 × 512 pixels were generated, and the fluorescence intensity of each single cell was quantified after defining a region of interest in homogeneous plasma membrane segments and background subtraction. At least 65 cells/construct were analyzed.
Confocal LSM; Fluorescence Resonance Energy Transfer (FRET) Imaging
Transiently transfected HEK 293 cells were grown as described above. Cells were visualized on an LSM510-META microscope (Carl Zeiss MicroImaging GmbH) using a ×40/1.3 numerical aperture oil objective. CFP fluorescence signals were recorded (IR laser, λex = 810 nm, two-photon technique, META detector, spectral range 436–650 nm) and split using an MBS KP 700. Channel pictures were taken prior to the recording of spectra in order to estimate expression of the CFP- and YFP-tagged constructs (CFP: IR laser, λex = 810 nm; two-photon technique, λem = 430–505 nm, Meta detector; YFP: argon laser, λex = 514 nm, λem = 560-nm long pass filter). FRET data analysis was performed using the LSM510-META software (Carl Zeiss MicroImaging GmbH). Fluorescence spectra of CFP-tagged receptors in the presence and absence of the YFP-tagged receptors were measured. Energy transfer efficiency (ET) was calculated using a spectral range of highest CFP (436–489 nm) and lowest YFP signals (<1%) according to the equation,
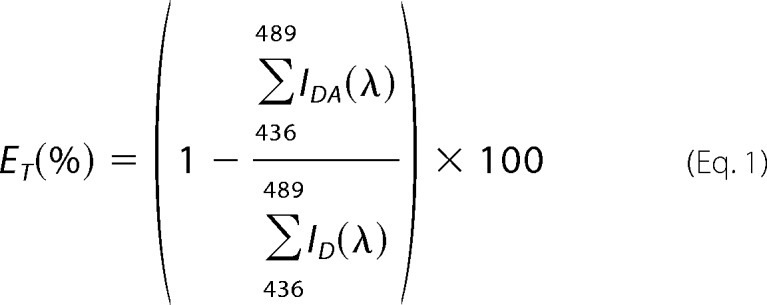 |
where IDA is the fluorescence intensity of CFP (D, donor) in presence of YFP (A, acceptor), and ID is the fluorescence intensity of CFP in the absence of YFP. To prevent cell damage as well as to avoid bleaching of CFP molecules, we did not perform photobleaching FRET but calculated the increase in CFP intensity under the assumption of YFP bleaching. Taking the different quantum yields of the fluorophores (CFP and YFP) into account, we derived the formula,
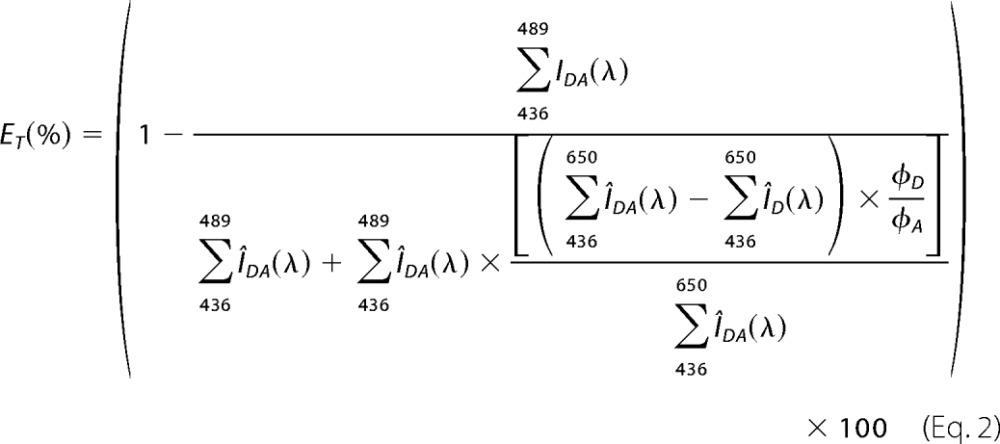 |
where ÎDA is the normalized fluorescence intensity of CFP in the presence of YFP, and ÎD is the normalized fluorescence intensity of CFP after bleaching of YFP. ΦD and ΦA are the fluorescence quantum yields of CFP and YFP, respectively (25), and Î describes the fluorescence spectra normalized to the maximal CFP fluorescence at 468 nm. As a control, photobleaching experiments using a CFP/YFP tandem construct were performed. Prior to the FRET experiments, settings were chosen precluding a cross-talk of YFP and CFP channels. Comparison of the ET values, derived from the measured and the calculated CFP spectra following YFP bleaching, led to values with no significant difference.
Confocal LSM; Fluorescence Lifetime Imaging Microscopy (FLIM)-FRET
Transiently transfected HEK 293 cells were grown and visualized as described above. However, an LSM510-META inverted microscope equipped with a time-resolved LSM upgrade setup (Becker & Hickl, Berlin, Germany) was used for the fluorescence lifetime measurements of CFP (×40/1.3 numerical aperture oil objective, IR laser, λex = 810 nm; two-photon technique, 450–490-nm band pass filter). An MBS KP 650 was used for separation of spectral parts. The measurement time was 80 s, and images with a frame size of 256 × 256 pixels were generated. Channel pictures were taken prior to the recording of the FLIM pictures in order to estimate expression of the CFP- and YFP-tagged constructs as described above. FLIM data were analyzed using the SPC Image software from Becker & Hickl (Berlin, Germany), taking the instrumental response function of the system into account. All data were fitted with a three-exponential fit, considering the average fluorescence lifetime τav, which was calculated according to the equation,
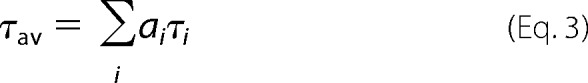 |
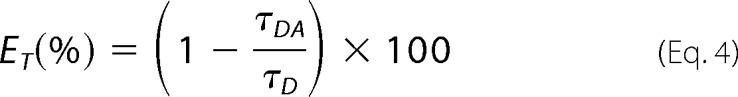
where ai is the amplitude for each detected lifetime component, τi. The χ2 value was used to evaluate the quality of the fits. From the average fluorescence lifetimes of CFP in the absence (τD) and presence (τDA) of the acceptor YFP, the energy transfer efficiency, ET, was determined using the equation,
 |
Confocal LSM; FCCS Measurements
Principles of FCCS and its use with LSM systems have been described previously (26–28). Transiently transfected HEK 293 cells expressing the GFP- and mCherry-tagged receptor constructs were grown as described above. FCCS measurements were performed at room temperature on a LSM710-ConfoCor3 system, enabling FCCS measurements at the basal plasma membrane without reflections from the coverslip. Using this setup, recordings are less noisy due to the limited flexibility of the basal plasma membrane in comparison with the apical side. GFP and mCherry fluorescence signals were recorded using a ×40/1.2 numerical aperture water objective (GFP: argon laser, λex = 488 nm, 505–540-nm band pass filter; mCherry: diode-pumped solid state laser λex = 561 nm, 580-nm long pass filter), and the spectral parts were split using an MBS 488/561 and an NFT 565 beam splitter, respectively. Under these conditions, cross-talk contributed approximately to 8%. Membranes were located by z-scans. Intensity fluctuations were recorded for 4 s and 25 repetitions. Average autocorrelation and cross-correlation curves were derived from the fluctuations using the LSM710 software ZEN 2010 (Carl Zeiss MicroImaging GmbH). For average calculations, only convergent curves were used. The curves were normalized to the correlation amplitude for display purposes. The normalized form of the autocorrelation function is defined as follows,
where angle brackets indicate average times, and δF(t) = F(t) − 〈F(t)〉, the fluctuations around the mean intensity. Correlation curves were derived using a two-component model of free diffusion in two dimensions with triplet fraction and offset for membrane-associated proteins (Equation 6) using the ZEN 2010 software (29). A two-component model was used for the two-dimensional fits to obtain satisfactory fits. The first component was too fast to reflect membrane diffusion, and thus the diffusion time of the second component was considered to be significant (27). The analytical function of the model is described by the equation,
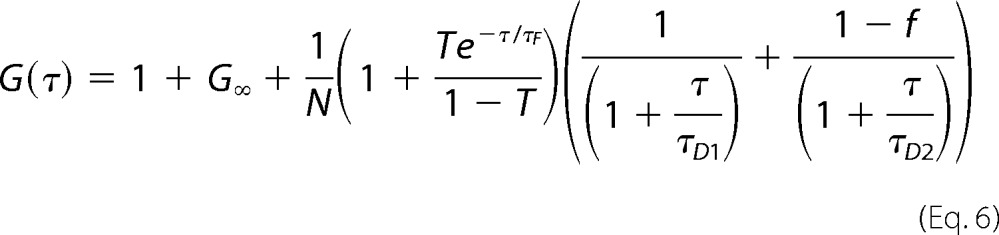 |
where G∞ is the offset from 1, and N and T represent the total number of particles and the triplet fraction, respectively. τD1 and τD2 represent free diffusion times (the subscripts indicate the different molecule species). τF is the triplet time, f and 1 − f are the fractions of species 1 and 2, and τ is the correlation time.
Statistics
Analyses were performed using Student's t test (GraphPad t test calculator, GraphPad Software, Inc., La Jolla, CA); p values of <0.0001 were considered to be extremely significant.
Molecular Modeling of the High Mannose Asn13-linked Oligosaccharide
The crystal structure of the extracellular domain of the CRF2(a)R (Protein Data Bank entry 3N95) in its ligand free state (13) was selected to model the high mannose glycan connected to the highly conserved Asn13 glycosylation site. The high mannose N-linked oligosaccharide (Man_9 GlcNAc_2) was generated using the GLYCAM web tool with energy minimization performed based on the MMFF94x force field for the protein and the GLYCAM06 force field parameters for the oligosaccharide. Analysis and a LowModeMD simulation (30) were carried out in the Molecular Operating Environment (Chemical Computing Group, Montreal, Canada).
RESULTS
Expression and Subcellular Location of CRF1R and CRF2(a)R Fusion Proteins
To determine whether the pseudo signal peptide of the CRF2(a)R has an influence on receptor oligomerization, we used the CRF1R with its conventional signal peptide, the CRF2(a)R carrying the pseudo signal peptide, and the previously described signal peptide swap mutants (12): construct SP1-CRF2(a)R representing a CRF2(a)R possessing the signal peptide of the CRF1R, and SP2-CRF1R representing the complementary CRF1R construct (see Fig. 1 for the fusion proteins used in this study). We intended to use various biophysical imaging methods as well as co-immunoprecipitation experiments to analyze receptor oligomerization. Thus, each of the constructs was fused C-terminally with the following fluorescent tags: CFP and YFP for intensity-based detection of FRET and for FLIM-FRET experiments; GFP and mCherry for FCCS measurements and co-immunoprecipitation studies (for the latter experiments, mCherry was additionally fused with a FLAG tag). We have previously shown that neither C-terminally fused GFP nor its derivatives alter the trafficking properties of the CRF1R and CRF2(a)R and that the plasma membrane expression levels of the CRF1R and CRF2(a)R differ depending on the presence of the pseudo signal peptide, which decreases the number of cell surface receptors (11, 12). To demonstrate that the same holds true for fusions with the mCherry tag, HEK 293 cells were transiently transfected with the corresponding constructs, and the mCherry fluorescence signals were localized in transiently transfected HEK 293 cells by LSM (Fig. 2A, left panels, red). The cell surface of the same cells was visualized by the use of CellMaskTM Deep Red stain (Fig. 2A, middle panel, gray). Colocalization is indicated by light red (Fig. 2A, right panel). A high plasma membrane expression was observed for constructs CRF1R.mCherry and SP1-CRF2(a)R.mCherry, and a substantially lower plasma membrane expression was observed for constructs CRF2(a)R.mCherry and SP2-CRF1R.mCherry. Colocalization of the mCherry signals at the plasma membrane was also quantified using confocal LSM (Fig. 2B; n > 65 cells/construct). Expression of construct CRF2(a)R.mCherry at the plasma membrane was ∼20% of that of CRF1R.mCherry in these experiments. In the case of construct SP2-CRF1R.mCherry, plasma membrane expression was reduced to ∼30% of that of CRF1R.mCherry. Conversely, the amount of SP1-CRF2(a)R.mCherry was up-regulated to ∼110% of that of CRF1R.mCherry. These results are consistent with those obtained for the plasma membrane expression of the corresponding GFP-tagged constructs and show again that the presence of the pseudo signal peptide decreases receptor expression as described (12). They also demonstrate that the mCherry tag does not influence trafficking of the constructs.
FIGURE 2.

Localization of the mCherry-tagged wild type receptor constructs and the signal peptide swap mutants in transiently transfected HEK 293 cells. A, colocalization of the mCherry signals of the constructs with the plasma membrane marker CellMaskTM Deep Red in live cells by LSM. The mCherry signals of the receptors are shown in red (left panels), and CellMaskTM Deep Red signals of the cell surface of the same cells are shown in gray (middle panels). mCherry and CellMaskTM Deep Red fluorescence signals were computer-overlaid (right panels; overlap is indicated by light red). The scans show representative cells. Scale bar, 10 μm. Similar data were obtained in three independent experiments. B, quantification of the mCherry fluorescence signals in the plasma membrane of the receptors. The bars represent mean values ± S.E. (error bars) in arbitrary units of a single experiment. The mCherry fluorescence intensity of at least 65 cells was analyzed for each construct. Data are representative of two independent experiments.
Biophysical Imaging Methods Indicate That the CRF2(a)R Is a Monomeric GPCR and That the Presence of the Pseudo Signal Peptide Prevents Receptor Oligomerization
We next analyzed oligomerization of CRF1R, CRF2(a)R, and the signal peptide swap mutants. We took transiently transfected HEK 293 cells and carried out various biophysical imaging experiments. Initially, FRET experiments were performed. Fluorescence spectra of the CFP-tagged receptors were measured at the plasma membrane in the presence and absence of the YFP-tagged acceptor constructs. As a negative control, the membrane-attached A kinase anchoring protein AKAP18α (31–34) was used as a FRET partner. To minimize cell damage and to avoid possible CFP bleaching due to additional scanning procedures, we developed a novel FRET approach. The calculated energy transfer efficiency (ET) was determined by the increase of the CFP fluorescence intensity only under the assumption of YFP photobleaching, taking the different quantum yields of the fluorophores into account (see “Experimental Procedures”). Real photobleaching was only performed prior to the experiments using a fused CFP/YFP tandem construct. ET values of CFP/YFP obtained by conventional photobleaching FRET and by a calculated increase of CFP intensity under the assumption of YFP bleaching were not significantly different, demonstrating the reliability of this novel approach (51.5 ± 5% versus 50.6 ± 4% respectively; p = 0.54).
The FRET data for the receptor constructs (Fig. 3) indicate that the CRF1R is an oligomeric GPCR as described previously (15, 35). The CRF2(a)R, however, is surprisingly monomeric. Moreover, the CRF1R is monomerized by replacement of its conventional signal peptide by the pseudo signal peptide of the CRF2(a)R (constructs SP2-CRF1R.CFP and YFP). Conversely, the CRF2(a)R forms a dimer when the signal peptide of the CRF1R is present (constructs SP1-CRF2(a)R.CFP and YFP). These results strongly suggest that the presence of the pseudo signal peptide is able to prevent receptor oligomerization.
FIGURE 3.

FRET measurements using transiently transfected HEK 293 cells expressing the wild type receptor constructs and the signal peptide swap mutants. A (left), fluorescence spectra of CRF1R.CFP expressed alone and CRF1R.CFP co-expressed with CRF1R.YFP. Right, fluorescence spectra of CRF2(a)R.CFP expressed alone and CRF2(a)R.CFP co-expressed with CRF2(a).YFP. In each case, the mean ± S.D. of at least 30 spectra is shown. B, relative energy transfer efficiency (ET) for all constructs calculated according to Equation 2 (see “Experimental Procedures”). Bars represent mean ET values ± S.E. (error bars) calculated out of mean values of all spectra (n > 30 cells) detected in at least three independent experiments (***, p < 0.0001). As a negative control, cells co-expressing CRF1R.CFP and membrane-attached AKAP18α.YFP were used. n.s., not significant.
FRET experiments of this kind have, to our knowledge, never been described before. Omitting YFP photobleaching prevents cell damage and avoids possible bleaching of CFP intensity due to additional scanning procedures. To confirm our results, FLIM-FRET measurements were carried out. Such analyses have been widely used in the past decade for the detection of FRET (36–38). The fluorescence lifetime of a molecule is dependent on its environment and is defined by the time it remains in its excited state. It is decreased when additional non-radiative processes like resonance energy transfer take place and may under these conditions serve to monitor protein interactions. The FLIM-FRET measurements at the plasma membrane using the constructs above expressed in transiently transfected HEK 293 cells (Fig. 4) yielded substantially lower ET (%) values in comparison with the conventional FRET measurements. This is probably due to bleaching of the CFP moieties during the 80-s recording time, which may reduce the fluorescence lifetime of CFP to a certain extent without the presence of an acceptor. The overall results of the FLIM-FRET experiments, however, were very similar to those obtained by the FRET measurements, confirming the data obtained for the oligomerization state of the individual receptor constructs.
FIGURE 4.

FLIM-FRET measurements using transiently transfected HEK 293 cells expressing the wild type receptor constructs and the signal peptide swap mutants. A (left), representative exponential decay curve of the fluorescence lifetimes of CRF1R.CFP expressed alone and CRF1R.CFP co-expressed with CRF1R.YFP. Right, representative exponential decay curve of the fluorescence lifetimes of CRF2(a)R.CFP expressed alone and CRF2(a)R.CFP co-expressed with CRF2(a)R.YFP. B, relative energy transfer efficiency (ET) for all constructs calculated according to Equation 4 (see “Experimental Procedures”). Bars represent mean ET values ± S.E. (error bars) calculated out of mean values of all fluorescence lifetimes (n > 25 cells) detected in at least three independent experiments (***, p < 0.0001). As a negative control, cells co-expressing CRF1R.CFP and membrane-attached AKAP18α.YFP were used. n.s., not significant.
The FRET and FLIM-FRET data strongly suggest that the CRF2(a)R is a monomeric GPCR and that the pseudo signal peptide prevents receptor oligomerization. However, the presence of the pseudo signal peptide also decreases receptor expression at the plasma membrane (see Fig. 2), and the higher expressed constructs (CRF1R and SP1-CRF2(a)R) show FRET signals, whereas the lower expressed constructs do not (CRF2(a)R and SP2-CRF1R). Thus, the possibility that the obtained FRET signals are distorted somewhat by receptor expression at the plasma membrane should be excluded. To address this issue, FCCS measurements were performed allowing the detection of fluorescence signals in live cells at a single molecule level. Here, fluorescent molecules are monitored, which diffuse through a confocal volume defined by the focused laser beam of the LSM (39). If two different fluorescent molecules are measured, cross-correlation analyses with mathematical procedures can be performed (see “Experimental Procedures”). A significant cross-correlation then indicates co-diffusion and consequently interaction of the molecules, whereas no cross-correlation indicates independent diffusion and monomeric molecules. Normalized autocorrelation and cross-correlation curves of HEK 293 cells transiently cotransfected with the GFP- and mCherry-tagged receptor constructs are shown in Fig. 5. Curves were derived by focusing the laser beam to the plasma membrane of the cells. Curves were fitted by applying a two-component model of free diffusion in two dimensions for the calculation of cross-correlation (see “Experimental Procedures”). No cross-correlation amplitudes were observed for the CRF2(a)R and SP2-CRF1R constructs, confirming that the CRF2(a)R is a monomeric GPCR and that the pseudo signal peptide prevents oligomerization. In the case of the CRF1 receptor constructs, in contrast, a clear cross-correlation amplitude was observed, indicating oligomerization. Unexpectedly, we could not detect a significant cross-correlation for SP1-CRF2(a)R constructs, which is not consistent with the FRET and FLIM-FRET data. However, the oligomerization tendency of the CRF2(a)R may be rather weak even without its pseudo signal peptide, which could impair measurements at a single molecule level and dampen values below the signal/noise threshold. Such weak interactions may be more readily visualized using the FRET or FLIM-FRET techniques.
FIGURE 5.

FCCS measurements using transiently transfected HEK 293 cells expressing the wild type receptor constructs and the signal peptide swap mutants. A, representative normalized auto- and cross-correlation curve of CRF1R.mCherry expressed together with CRF1R.GFP (left) and CRF2(a)R.mCherry expressed together with CRF2(a)R.GFP (right). The laser was focused at the plasma membrane. Autocorrelation (AC) curves of the individual fluorophores are depicted in black and dark gray, and cross-correlation (CC) curves of both signals are shown in light gray. B, relative cross-correlation amplitudes (CC%) for all constructs (see “Experimental Procedures”). bars represent mean cross-correlation values ± S.E. (error bars) of all cells (n > 105) detected in at least five independent experiments (***, p < 0.0001). As a negative control, cells co-expressing CRF1R.mCherry and membrane-attached AKAP18α.GFP were used. A cross-correlation of 8% was the lowest detectable value and is caused by cross-talk of GFP (see “Experimental Procedures”). n.s., not significant.
Co-immunoprecipitation Experiments Confirm That the CRF2(a)R Is a Monomeric GPCR and That the Presence of the Pseudo Signal Peptide Prevents Receptor Oligomerization
To verify our imaging results, we also used co-immunoprecipitation experiments. To this end, HEK 293 cells were transiently co-transfected with the GFP- and mCherry.FLAG-tagged receptor constructs. The mCherry.FLAG-tagged constructs were precipitated using monoclonal anti-FLAG antibodies and detected by SDS-PAGE/immunoblotting using polyclonal anti-FLAG antibodies (Fig. 6, bottom). Co-precipitated GFP-tagged constructs were detected using monoclonal anti-GFP antibodies (Fig. 6, top). Because the presence of the pseudo signal peptide leads to different expression levels, the constructs were quantified by FACS measurements in the cells prior to the SDS-PAGE, and similar amounts of the mCherry.FLAG-tagged constructs were loaded on the gel. Co-immunoprecipitation of the GFP-tagged constructs, indicating oligomerization, was detectable in the case of the CRF1R and SP1-CRF2(a)R constructs but not for the pseudo signal peptide-containing constructs CRF2(a)R and SP2-CRF1R. To validate the method, cell lysates containing GFP- or mCherry.FLAG-tagged constructs alone were mixed, and receptors were precipitated and detected as described above. No co-precipitated GFP-tagged receptors were detected under these conditions (data not shown). Taken together, the co-immunoprecipitation experiments entirely confirm the results of the imaging experiments for the oligomerization state of the constructs.
FIGURE 6.

Co-immunoprecipitation analysis using transiently transfected HEK 293 cells expressing the wild type receptor constructs and the signal peptide swap mutants. Cells were co-transfected with GFP- and mCherry.FLAG-tagged receptor constructs, and the receptors were precipitated using a monoclonal anti-FLAG antibody. Co-precipitated GFP-tagged constructs were detected by SDS-PAGE/immunoblotting using a monoclonal anti-GFP antibody and alkaline phosphatase-conjugated anti-mouse IgG (top). As a loading control, precipitated mCherry.FLAG-tagged receptors were detected using a poly anti-FLAG antibody and alkaline phosphatase-conjugated anti-rabbit IgG (bottom; the mCherry.FLAG-tagged receptors were also treated with PNGase F prior to SDS-PAGE/immunoblotting to guarantee the detection of single protein bands). Prior to the experiment, the expression of the constructs was quantified by FACS measurements (data not shown), and the amount of the mCherry.FLAG-tagged constructs loaded on the gel was adjusted. The blot is representative of three independent experiments.
DISCUSSION
The uncleaved pseudo signal peptide of the CRF2(a)R is a so far unique N-terminal domain within the GPCR protein family (11–13). Its presence leads to a rather low receptor localization at the plasma membrane (11) and prevents coupling of the CRF2(a)R to the Gi protein (12). Using FRET (Fig. 3), FLIM-FRET (Fig. 4), and FCCS (Fig. 5) measurements, we have analyzed an influence of the pseudo signal peptide on receptor oligomerization and obtained two novel results. Our data show that (i) the CRF2(a)R is a monomeric GPCR in contrast to the homologous CRF1R, and, most importantly, (ii) that the presence of the pseudo signal peptide prevents receptor oligomerization. These results were also confirmed by co-immunoprecipitation experiments (Fig. 6) and are summarized schematically in Fig. 7A.
FIGURE 7.

Summary of the available results and structure model of the N tail of CRF2(a)R. A, the CRF1R (gray) possesses a conventional cleaved signal peptide and forms oligomers. It couples to Gi and Gs (12). The CRF2(a)R (black) possesses an uncleaved pseudo signal peptide and is expressed exclusively as a monomer. It couples only to Gs (12). Construct SP2-CRF1R is expressed as a monomer, whereas construct SP1-CRF2(a)R forms oligomers. G protein coupling selectivity could also be transferred by signal peptide swap (12). B, crystal structure of the N tail of the CRF2(a)R (Protein Data Bank entry 3N95) (orange) (13) and a modeled high mannose glycan (Man_9 GlcNAc_2) at position Asn13 (green). The pseudo signal peptide (magenta) of the CRF2(a)R forms an α-helix increasing N tail length. The bulky high mannose glycan may be involved in preventing receptor oligomerization. C, sequence alignment of the pseudo signal peptides of the CRF2(a)Rs from various species. The conserved residue Asn13 is highlighted in green.
Taking the available crystal structures of GPCRs into account (e.g. the crystal structure of B2AR-Gs complex (Protein Data Bank code 3SN6) (40)), it seems to be clear that a GPCR monomer alone is able to interact with a single G protein molecule. However, when oligomerization is analyzed, GPCRs usually form at least homo-oligomers. Although it is conceivable that these receptors are expressed as a mixture of monomers and oligomers (with a frequently unknown monomer/oligomer ratio), GPCRs that are expressed exclusively as a monomer seem to be rare (see the databases summarizing the interaction behavior of GPCRs (e.g. the SSFA-GPHR and GPCR-OKB databases) (41–44)).
It is thus important to discuss how the pseudo signal peptide of the CRF2(a)R may prevent receptor oligomerization. Recently, the crystal structure of the N terminus of the CRF2(a)R containing the pseudo signal peptide was published and compared with that of the CRF1R (13) (Fig. 7B). The pseudo signal peptide is located on the N tail of the CRF2(a)R and is part of an α-helix increasing N tail length. The sequence following the pseudo signal peptide hence forms a loop structure. One may speculate that this loop structure or the helix itself is involved in impairing the interaction between two CRF2(a)R monomers. However, the presence of the pseudo signal peptide leads to an N tail structure resembling those of other class B GPCRs that also possess long N-terminal α-helices, such as the parathyroid hormone receptor and the gastric inhibitory peptide receptor (13), and these receptors seem to form oligomers (45, 46). On the other hand, it was shown previously that the pseudo signal peptide of the CRF2(a)R contains an N-glycosylation consensus sequence (Asn13-Cys14-Ser15) and that the receptor is indeed glycosylated at position Asn13 (11). Thus, an alternative and even more plausible hypothesis is that this glycan impairs the oligomerization process, most likely by steric hindrance. It is conceivable that GPCRs oligomerize in the ER (47), and thus we have modeled a high mannose glycan into the N tail crystal structure of the CRF2(a)R (Fig. 7B). Looking at the dimensions of the bulky high mannose glycan that is protruding from the N terminus structure, such a hypothesis should not be dismissed. It is noteworthy that mutation of residue Asn13 leads to a fully functional signal peptide that is cleaved off, demonstrating that residue Asn13 determines pseudo signal peptide function (11). Taking the above thoughts into account, residue Asn13 may consequently also be responsible for preserving the monomeric state of the CRF2(a)R. Interestingly, whereas signal peptide sequences are normally highly variable, residue Asn13 is conserved in all available CRF2(a)R sequences (Fig. 7C).
The CRF1R couples to both the Gs and Gi protein, leading to a biphasic concentration-response curve following ligand-induced receptor activation (12, 15). Due to the presence of the pseudo signal peptide, the CRF2(a)R is only able to couple to Gi, yielding a monophasic concentration-response curve (12). Although the underlying mechanism is not understood, the inability of the CRF2(a)R to couple to Gi may be due to its monomeric state: binding of one ligand molecule to a monomer may only enable Gs coupling, whereas binding of two ligand molecules to an oligomer may lead to an alternative conformation interacting with both Gs and Gi. In the case of the thyrotropin receptor, a similar model was proposed recently (23). Here, occupancy of both sites of the thyrotropin receptor oligomer was necessary for coupling to Gs and Gq; occupancy of one side enabled only Gs coupling (23).
The findings that the CRF2(a)R is expressed exclusively as a monomer and that the presence of a pseudo signal peptide prevents its oligomerization are so far unique for the GPCR protein family. Because pseudo signal peptides cannot be distinguished by prediction programs from conventional signal peptides as yet (11), the possibility that other GPCRs possess similar domains cannot be excluded. Future studies should also address whether non-related oligomeric GPCRs could be monomerized by fusion of the pseudo signal peptide as it was shown here for the homologous CRF1R. If so, such an experimental strategy may be useful to study the functional significance of GPCR oligomerization in general.
Acknowledgments
We are most grateful to Jenny Eichhorst for excellent technical assistance. We thank Erhard Klauschenz from the DNA sequencing service group for his contribution, Bettina Kahlich for assistance with cell culture, and Carolin Westendorf for help in performing FACS measurements.
This work was supported by Deutsche Forschungsgemeinschaft Grant SCHU 1116/2-1.
- CRF
- corticotropin-releasing factor
- CRF1R and CRF2R
- rat corticotropin-releasing factor receptor type 1 and 2, respectively
- CRF2(a)R
- rat corticotropin-releasing factor receptor type 2a
- CFP
- cyan fluorescent protein
- ER
- endoplasmic reticulum
- FCCS
- fluorescence cross-correlation spectroscopy
- FLIM
- fluorescence lifetime imaging microscopy
- GPCR
- G protein-coupled receptor
- LSM
- laser-scanning microscopy
- MBS
- main beam splitter
- PNGase F
- peptide N-glycosidase F.
REFERENCES
- 1. Hauger R. L., Risbrough V., Brauns O., Dautzenberg F. M. (2006) Corticotropin-releasing factor (CRF) receptor signaling in the central nervous system. New molecular targets. CNS Neurol. Disord. Drug Targets 5, 453–479 [DOI] [PMC free article] [PubMed] [Google Scholar]
- 2. Hauger R. L., Grigoriadis D. E., Dallman M. F., Plotsky P. M., Vale W. W., Dautzenberg F. M. (2003) International Union of Pharmacology. XXXVI. Current status of the nomenclature for receptors for corticotropin-releasing factor and their ligands. Pharmacol. Rev. 55, 21–26 [DOI] [PubMed] [Google Scholar]
- 3. Denver R. J. (2009) Structural and functional evolution of vertebrate neuroendocrine stress systems. Ann. N.Y. Acad. Sci. 1163, 1–16 [DOI] [PubMed] [Google Scholar]
- 4. Spina M., Merlo-Pich E., Chan R. K., Basso A. M., Rivier J., Vale W., Koob G. F. (1996) Appetite-suppressing effects of urocortin, a CRF-related neuropeptide. Science 273, 1561–1564 [DOI] [PubMed] [Google Scholar]
- 5. Coste S. C., Kesterson R. A., Heldwein K. A., Stevens S. L., Heard A. D., Hollis J. H., Murray S. E., Hill J. K., Pantely G. A., Hohimer A. R., Hatton D. C., Phillips T. J., Finn D. A., Low M. J., Rittenberg M. B., Stenzel P., Stenzel-Poore M. P. (2000) Abnormal adaptations to stress and impaired cardiovascular function in mice lacking corticotropin-releasing hormone receptor-2. Nat. Genet. 24, 403–409 [DOI] [PubMed] [Google Scholar]
- 6. Grammatopoulos D. K., Dai Y., Randeva H. S., Levine M. A., Karteris E., Easton A. J., Hillhouse E. W. (1999) A novel spliced variant of the type 1 corticotropin-releasing hormone receptor with a deletion in the seventh transmembrane domain present in the human pregnant term myometrium and fetal membranes. Mol. Endocrinol. 13, 2189–2202 [DOI] [PubMed] [Google Scholar]
- 7. Wietfeld D., Heinrich N., Furkert J., Fechner K., Beyermann M., Bienert M., Berger H. (2004) Regulation of the coupling to different G proteins of rat corticotropin-releasing factor receptor type 1 in human embryonic kidney 293 cells. J. Biol. Chem. 279, 38386–38394 [DOI] [PubMed] [Google Scholar]
- 8. Gutknecht E., Van der Linden I., Van Kolen K., Verhoeven K. F., Vauquelin G., Dautzenberg F. M. (2009) Molecular mechanisms of corticotropin-releasing factor receptor-induced calcium signaling. Mol. Pharmacol. 75, 648–657 [DOI] [PubMed] [Google Scholar]
- 9. Wallin E., von Heijne G. (1995) Properties of N-terminal tails in G-protein-coupled receptors. A statistical study. Protein. Eng. 8, 693–698 [DOI] [PubMed] [Google Scholar]
- 10. Alken M., Rutz C., Köchl R., Donalies U., Oueslati M., Furkert J., Wietfeld D., Hermosilla R., Scholz A., Beyermann M., Rosenthal W., Schülein R. (2005) The signal peptide of the rat corticotropin-releasing factor receptor 1 promotes receptor expression but is not essential for establishing a functional receptor. Biochem. J. 390, 455–464 [DOI] [PMC free article] [PubMed] [Google Scholar]
- 11. Rutz C., Renner A., Alken M., Schulz K., Beyermann M., Wiesner B., Rosenthal W., Schülein R. (2006) The corticotropin-releasing factor receptor type 2a contains an N-terminal pseudo signal peptide. J. Biol. Chem. 281, 24910–24921 [DOI] [PubMed] [Google Scholar]
- 12. Schulz K., Rutz C., Westendorf C., Ridelis I., Vogelbein S., Furkert J., Schmidt A., Wiesner B., Schülein R. (2010) The pseudo signal peptide of the corticotropin-releasing factor receptor type 2a decreases receptor expression and prevents Gi-mediated inhibition of adenylyl cyclase activity. J. Biol. Chem. 285, 32878–32887 [DOI] [PMC free article] [PubMed] [Google Scholar]
- 13. Pal K., Swaminathan K., Xu H. E., Pioszak A. A. (2010) Structural basis for hormone recognition by the human CRFR2α G protein-coupled receptor. J. Biol. Chem. 285, 40351–40361 [DOI] [PMC free article] [PubMed] [Google Scholar]
- 14. Evans R. T., Seasholtz A. F. (2009) Soluble corticotropin-releasing hormone receptor 2α splice variant is efficiently translated but not trafficked for secretion. Endocrinology 150, 4191–4202 [DOI] [PMC free article] [PubMed] [Google Scholar]
- 15. Milan-Lobo L., Gsandtner I., Gaubitzer E., Rünzler D., Buchmayer F., Köhler G., Bonci A., Freissmuth M., Sitte H. H. (2009) Subtype-specific differences in corticotropin-releasing factor receptor complexes detected by fluorescence spectroscopy. Mol. Pharmacol. 76, 1196–1210 [DOI] [PMC free article] [PubMed] [Google Scholar]
- 16. Terrillon S., Bouvier M. (2004) Roles of G-protein-coupled receptor dimerization. EMBO Rep. 5, 30–34 [DOI] [PMC free article] [PubMed] [Google Scholar]
- 17. Smith N. J., Milligan G. (2010) Allostery at G protein-coupled receptor homo- and heteromers. Uncharted pharmacological landscapes. Pharmacol. Rev. 62, 701–725 [DOI] [PMC free article] [PubMed] [Google Scholar]
- 18. Rozenfeld R., Devi L. A. (2011) Exploring a role for heteromerization in GPCR signaling specificity. Biochem. J. 433, 11–18 [DOI] [PMC free article] [PubMed] [Google Scholar]
- 19. George S. R., Fan T., Xie Z., Tse R., Tam V., Varghese G., O'Dowd B. F. (2000) Oligomerization of μ- and δ-opioid receptors. Generation of novel functional properties. J. Biol. Chem. 275, 26128–26135 [DOI] [PubMed] [Google Scholar]
- 20. Charles A. C., Mostovskaya N., Asas K., Evans C. J., Dankovich M. L., Hales T. G. (2003) Coexpression of δ-opioid receptors with micro receptors in GH3 cells changes the functional response to micro agonists from inhibitory to excitatory. Mol. Pharmacol. 63, 89–95 [DOI] [PubMed] [Google Scholar]
- 21. Mellado M., Rodríguez-Frade J. M., Vila-Coro A. J., Fernández S., Martín de Ana A., Jones D. R., Torń J. L., Martńez-A C. (2001) Chemokine receptor homo- or heterodimerization activates distinct signaling pathways. EMBO J. 20, 2497–2507 [DOI] [PMC free article] [PubMed] [Google Scholar]
- 22. Maurice P., Daulat A. M., Turecek R., Ivankova-Susankova K., Zamponi F., Kamal M., Clement N., Guillaume J. L., Bettler B., Galès C., Delagrange P., Jockers R. (2010) Molecular organization and dynamics of the melatonin MT1 receptor-RGS20-Gi protein complex reveal asymmetry of receptor dimers for RGS and Gi coupling. EMBO J. 29, 3646–3659 [DOI] [PMC free article] [PubMed] [Google Scholar]
- 23. Allen M. D., Neumann S., Gershengorn M. C. (2011) Occupancy of both sites on the thyrotropin (TSH) receptor dimer is necessary for phosphoinositide signaling. FASEB J. 25, 3687–3694 [DOI] [PMC free article] [PubMed] [Google Scholar]
- 24. Sambrook J., Russell D. W. (2001) Molecular Cloning: A Laboratory Manual, Cold Spring Harbor Laboratory, Cold Spring Harbor, NY [Google Scholar]
- 25. Cubitt A. B., Woollenweber L. A., Heim R. (1999) Understanding structure-function relationships in the Aequorea victoria green fluorescent protein. Methods Cell Biol. 58, 19–30 [DOI] [PubMed] [Google Scholar]
- 26. Rigler R., Mets U., Widengren J., Kask P. (1993) Fluorescence correlation spectroscopy with high content rate and low background: analysis of translational diffusion. Eur. Biophys. J. 22, 169–175 [Google Scholar]
- 27. Elson E. L. (2001) Fluorescence correlation spectroscopy measures molecular transport in cells. Traffic 2, 789–796 [DOI] [PubMed] [Google Scholar]
- 28. Haustein E., Schwille P. (2003) Ultrasensitive investigations of biological systems by fluorescence correlation spectroscopy. Methods 29, 153–166 [DOI] [PubMed] [Google Scholar]
- 29. Schwille P., Korlach J., Webb W. W. (1999) Fluorescence correlation spectroscopy with single-molecule sensitivity on cell and model membranes. Cytometry 36, 176–182 [DOI] [PubMed] [Google Scholar]
- 30. Labute P. (2010) LowModeMD. Implicit low-mode velocity filtering applied to conformational search of macrocycles and protein loops. J. Chem. Inf. Model 50, 792–800 [DOI] [PubMed] [Google Scholar]
- 31. Fraser I. D., Tavalin S. J., Lester L. B., Langeberg L. K., Westphal A. M., Dean R. A., Marrion N. V., Scott J. D. (1998) A novel lipid-anchored A-kinase anchoring protein facilitates cAMP-responsive membrane events. EMBO J. 17, 2261–2272 [DOI] [PMC free article] [PubMed] [Google Scholar]
- 32. Gray P. C., Tibbs V. C., Catterall W. A., Murphy B. J. (1997) Identification of a 15-kDa cAMP-dependent protein kinase-anchoring protein associated with skeletal muscle L-type calcium channels. J. Biol. Chem. 272, 6297–6302 [DOI] [PubMed] [Google Scholar]
- 33. Gray P. C., Johnson B. D., Westenbroek R. E., Hays L. G., Yates J. R., 3rd, Scheuer T., Catterall W. A., Murphy B. J. (1998) Primary structure and function of an A kinase anchoring protein associated with calcium channels. Neuron 20, 1017–1026 [DOI] [PubMed] [Google Scholar]
- 34. Lygren B., Carlson C. R., Santamaria K., Lissandron V., McSorley T., Litzenberg J., Lorenz D., Wiesner B., Rosenthal W., Zaccolo M., Taskén K., Klussmann E. (2007) AKAP complex regulates Ca2+ reuptake into heart sarcoplasmic reticulum. EMBO Rep. 8, 1061–1067 [DOI] [PMC free article] [PubMed] [Google Scholar]
- 35. Kraetke O., Wiesner B., Eichhorst J., Furkert J., Bienert M., Beyermann M. (2005) Dimerization of corticotropin-releasing factor receptor type 1 is not coupled to ligand binding. J. Recept. Signal Transduct. Res. 25, 251–276 [DOI] [PubMed] [Google Scholar]
- 36. Scolari S., Engel S., Krebs N., Plazzo A. P., De Almeida R. F., Prieto M., Veit M., Herrmann A. (2009) Lateral distribution of the transmembrane domain of influenza virus hemagglutinin revealed by time-resolved fluorescence imaging. J. Biol. Chem. 284, 15708–15716 [DOI] [PMC free article] [PubMed] [Google Scholar]
- 37. Li H., Yu P., Sun Y., Felder R. A., Periasamy A., Jose P. A. (2010) Actin cytoskeleton-dependent Rab GTPase-regulated angiotensin type I receptor lysosomal degradation studied by fluorescence lifetime imaging microscopy. J. Biomed. Opt. 15, 056003 [DOI] [PMC free article] [PubMed] [Google Scholar]
- 38. Sun Y., Day R. N., Periasamy A. (2011) Investigating protein-protein interactions in living cells using fluorescence lifetime imaging microscopy. Nat. Protoc. 6, 1324–1340 [DOI] [PMC free article] [PubMed] [Google Scholar]
- 39. Heinze K. G., Koltermann A., Schwille P. (2000) Simultaneous two-photon excitation of distinct labels for dual-color fluorescence cross-correlation analysis. Proc. Natl. Acad. Sci. U.S.A. 97, 10377–10382 [DOI] [PMC free article] [PubMed] [Google Scholar]
- 40. Rasmussen S. G., DeVree B. T., Zou Y., Kruse A. C., Chung K. Y., Kobilka T. S., Thian F. S., Chae P. S., Pardon E., Calinski D., Mathiesen J. M., Shah S. T., Lyons J. A., Caffrey M., Gellman S. H., Steyaert J., Skiniotis G., Weis W. I., Sunahara R. K., Kobilka B. K. (2011) Crystal structure of the β2 adrenergic receptor-Gs protein complex. Nature 477, 549–555 [DOI] [PMC free article] [PubMed] [Google Scholar]
- 41. Kreuchwig A., Kleinau G., Kreuchwig F., Worth C. L., Krause G. (2011) Research resource. Update and extension of a glycoprotein hormone receptors web application. Mol. Endocrinol. 25, 707–712 [DOI] [PMC free article] [PubMed] [Google Scholar]
- 42. Kleinau G., Brehm M., Wiedemann U., Labudde D., Leser U., Krause G. (2007) Implications for molecular mechanisms of glycoprotein hormone receptors using a new sequence-structure-function analysis resource. Mol. Endocrinol. 21, 574–580 [DOI] [PubMed] [Google Scholar]
- 43. Khelashvili G., Dorff K., Shan J., Camacho-Artacho M., Skrabanek L., Vroling B., Bouvier M., Devi L. A., George S. R., Javitch J. A., Lohse M. J., Milligan G., Neubig R. R., Palczewski K., Parmentier M., Pin J. P., Vriend G., Campagne F., Filizola M. (2010) GPCR-OKB. The G protein-coupled receptor oligomer knowledge base. Bioinformatics 26, 1804–1805 [DOI] [PMC free article] [PubMed] [Google Scholar]
- 44. Skrabanek L., Murcia M., Bouvier M., Devi L., George S. R., Lohse M. J., Milligan G., Neubig R., Palczewski K., Parmentier M., Pin J. P., Vriend G., Javitch J. A., Campagne F., Filizola M. (2007) Requirements and ontology for a G protein-coupled receptor oligomerization knowledge base. BMC Bioinformatics 8, 177. [DOI] [PMC free article] [PubMed] [Google Scholar]
- 45. Pioszak A. A., Harikumar K. G., Parker N. R., Miller L. J., Xu H. E. (2010) Dimeric arrangement of the parathyroid hormone receptor and a structural mechanism for ligand-induced dissociation. J. Biol. Chem. 285, 12435–12444 [DOI] [PMC free article] [PubMed] [Google Scholar]
- 46. Vrecl M., Drinovec L., Elling C., Heding A. (2006) Opsin oligomerization in a heterologous cell system. J. Recept. Signal. Transduct. Res. 26, 505–526 [DOI] [PubMed] [Google Scholar]
- 47. Gurevich V. V., Gurevich E. V. (2008) GPCR monomers and oligomers. It takes all kinds. Trends Neurosci. 31, 74–81 [DOI] [PMC free article] [PubMed] [Google Scholar]