Abstract
The control of RNA alternative splicing is critical for generating biological diversity. Despite emerging genome-wide technologies to study RNA complexity, reliable and comprehensive RNA-regulatory networks have not been defined. Here we used Bayesian networks to probabilistically model diverse datasets and predict the target networks of specific regulators. We applied this strategy to identify ~700 alternative splicing events directly regulated by the neuron-specific factor Nova in the mouse brain, integrating RNA-binding data, splicing microarray data, Nova-binding motifs, and evolutionary signatures. The resulting integrative network revealed combinatorial regulation by Nova and the neuronal splicing factor Fox, interplay between phosphorylation and splicing, and potential links to neurologic disease. Thus we have developed a general approach to understanding mammalian RNA regulation at the systems level.
RNA-binding proteins (RBPs) regulate alternative splicing (AS) and processing of RNA to generate biological complexity (1). Inferring RNA target networks regulated by these splicing factors may provide general insights into the mechanisms of regulation and their role in disease (2–5). Several global approaches have recently been applied toward this aim (2), including bioinformatic predictions driven by analysis of RBP motifs (6–8), profiling of RNA isoforms based on splicing microarrays (9–11) or RNA-Seq (12–14), or biochemical footprints derived from high-throughput sequencing of RNA isolated by crosslinking immunoprecipitation (HITS-CLIP) (9, 15). These methods have been applied to identify and genetically validate ~90 alternative exons regulated by Nova1/2 (9, 10), a family of neuron-specific splicing factors. Nova regulates a biologically coherent set of transcripts encoding synaptic proteins (10), and an RNA-regulatory map predicts that Nova-regulated splicing is position-dependent, such that alternative exons are included when Nova binds to downstream introns and are excluded via binding within the exons or to upstream introns (9, 16).
Each of these methods is limited in their signal-to-noise and scope. RBP motifs generally bear very low sequence specificity (e.g. YCAY for Nova, ~1 site per 64 nt), microarray or RNA-Seq data are noisy at the exon level beyond a small set of top candidates and are correlative in nature, and biochemical protein-RNA interactions do not necessarily imply functional regulation. Consequently, only a small set of targets have been confidently identified for most splicing factors (4, 17). An alternative strategy is to integrate multiple sources of information, so that individually weak bits of evidence can be combined to generate confident predictions, as demonstrated in studies of protein-protein interactions (18) and transcription factor networks (19). Here we set out to develop such an integrative approach to probabilistically model a diverse set of genomic, experimental and evolutionary data, using Bayesian networks to define and understand the function of RNA networks.
We studied the Nova splicing-regulatory network as an exemplar and compiled four types of data important for inferring direct Nova-RNA interactions coupled with defined Nova-dependent AS events: (i) 279,631 CLIP tag clusters, ranked by peak height (PH), derived from 20 independent HITS-CLIP experiments (figs. S1 and S2, table S1, and datasets S1 and S2); (ii) 841,501 Nova-binding sites (YCAY clusters) bioinformatically predicted and scored from the clustering, accessibility and conservation of YCAY elements (fig. S3); (iii) four splicing-microarray datasets comparing wild-type (WT) and Nova knockout (KO) brains, which detected 1,331 exons showing significant Nova-dependent splicing, in addition to many exons with moderate but potentially functional changes (fig. S4 and table S2); (iv) evolutionary signatures of regulated splicing, including conservation of AS in human or rat, and preservation of reading frame (20). Each individual dataset suggested a large number of informative but noisy candidates, arguing for the importance of rigorous data integration.
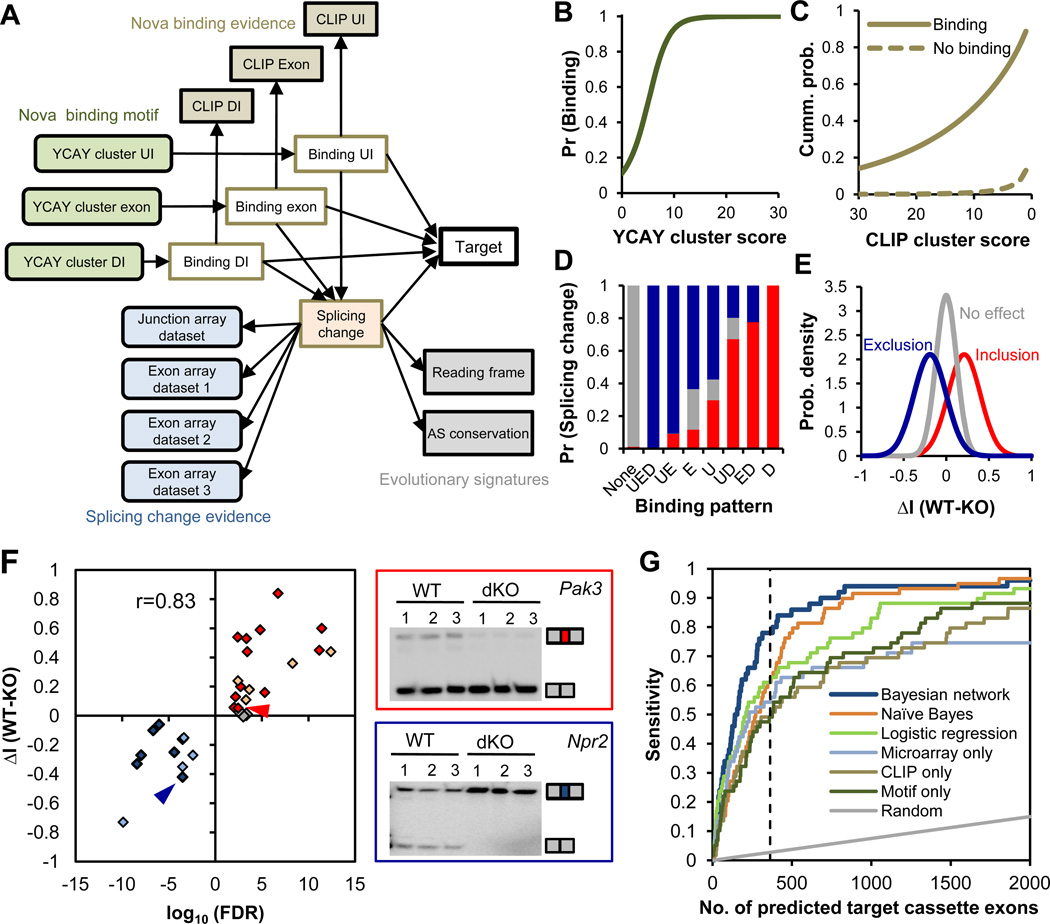
To probabilistically weigh and combine these datasets, we designed a Bayesian network for each of seven types of AS events—cassette exons (an exon is included or skipped), tandem cassette exons, mutually exclusive exons (one of two exons is included), alternative 5´ and 3´ splice sites, and alternative polyA usage coupled with 5´ or 3´ splice site choices (table S5); each AS event represents an observation of the Bayesian network. Using cassette exons as an example, the network included 17 nodes (variables) connected by edges reflecting the causal relationships between variables (Fig. 1A and table S3). The strength of YCAY clusters determines Nova binding (a binary hidden variable) in upstream introns, exons, or downstream introns, which in turn determines the probability of observing binding footprints by HITS-CLIP. The combinatorial action of Nova binding in one or more regions dictates the splicing outcome (another hidden variable), as reflected in microarray measurements and evolutionary signatures. With this pre-determined network structure, the parameters of the model (conditional probability distributions) were learned from a subset of training cassette exons, including 50 previously validated targets (20).
Figure 1. Integrative prediction of Nova targets using a Bayesian network.
The Bayesian network (BN) for cassette exons is shown. (A) Design of the BN. The 17 nodes (variables) model four types of data, including YCAY clusters and CLIP clusters in each cassette exon or flanking upstream (UI) and downstream introns (DI), splicing microarrays comparing WT and Nova KO brains, and evolutionary signatures. See table S3 for more details. (B–E) Estimated conditional probability distributions (CPDs) derived from the BN. (B) The probability of Nova binding to regions with varying YCAY cluster scores across all regions. (C) The cumulative probability of CLIP cluster scores across all regions with or without inferred Nova binding. (D) The probability of exons showing Nova-dependent inclusion (red), exclusion (blue), or no effect in comparisons of WT versus Nova KO brain transcripts, given the indicated combinatorial Nova binding patterns in exon (E), upstream (U) and downstream (D) introns. (E) The distribution of proportional splicing changes between WT and Nova KO brain RNA (ΔI, ref. (10)) measured by exon-junction arrays for exons with inferred Nova-dependent inclusion, exclusion or without Nova regulation. (F) A summary of RT-PCR analysis for the 31 exons tested in WT versus Nova KO brains. Twenty-two exons have Nova-regulated inclusion or exclusion (P<0.05; t-test), and those without significant changes tested in this study are shown in red, blue and gray, respectively; 9 previously validated exons are similarly shown in light red and light blue, respectively. The correlation between prediction confidence and the magnitude of splicing change is indicated. For two representative BN-predicted exons (arrow heads in the scatter plot), gel images are shown with the two isoforms including or excluding the regulated exon indicated (right panel). (G) Comparison of Nova target prediction by different methods (Bayesian network, naïve Bayes, and logistic regression) or using individual datasets (microarrays comparing E18.5 WT versus Nova1/2 double KO brains, CLIP clusters, and YCAY clusters). Each curve represents the prediction sensitivity with varying stringency; the performance of random predictions is also shown. The dotted line indicates the top 363 predictions.
Unlike “black box” predictions, the learned model parameters provide interpretable and novel insights into Nova splicing regulation (Fig. 1B–E and fig. S5). For example, the model confirmed and extended the previously defined RNA-regulatory map (9, 16), quantifying it and predicting the combinatorial action of Nova binding in multiple regions: Nova binding in exons or upstream introns alone results in exon exclusion with a probability of ~0.6, while the chance increases to >0.9 if Nova binds to both regions (Fig. 1D).
We prospectively applied the model to 13,357 annotated cassette exons (20). Each exon was assigned three probabilities that measure Nova-regulated exon inclusion, exclusion, and absence of direct regulation, respectively, from which a false discovery rate (FDR) was estimated. After ensuring that the model was not over-fit by 10-fold cross validation (fig. S6), we predicted 363 cassette exons as direct Nova targets, with a stringent FDR ≤ 0.01, and more broadly, 588 Nova-regulated AS events (table S5) when applied to all types of AS events (fig. S7).
We also searched novel exons with high sequence conservation, and exons whose AS pattern was missed in our database (fig. S8 and table S4) (20). This conservatively identified 76 additional exons as Nova targets. Hence the final Nova target network included 698 AS events from 358 genes, among which 610 events (87%) represent novel predictions (table S5).
To evaluate the quality of the network, we performed unbiased experimental validation. Intersecting the Bayesian network-predicted exons with a collection of well studied alterative exons (AEDB) (21) yielded a manageable set of 31 non-redundant exons, whose confidence scores are distributed very uniformly (median rank: 288 of 588; Fig. 1F and table S6). Among these, nine are previously validated Nova targets, and 19 of the remaining 22 exons were validated by comparing AS in WT and Nova KO brains (P<0.05, t-test, n=6) (Fig. 1F and fig. S9). In addition, we validated 8/9 novel exons tested (fig. S10), yielding an overall validation rate of ~90% (28/31 or 36/40). Combined with its high sensitivity in predicting 58/77 (75%) previously validated targets (39/50=78% for cassette exons), the accuracy of our network is remarkable and compares very favorably with previous studies, which obtained substantially lower validation rates or more limited sets of candidates (9, 10, 22, 23).
The Bayesian network analysis successfully integrated information from multiple types of data, predicting a substantial portion of targets missed by analysis of individual datasets or by other machine learning algorithms (20). For example, analysis of the 363 top target cassette exons predicted from microarrays, CLIP clusters or YCAY clusters alone achieved 49–54% sensitivity and an estimated validation rate of 54–61%, compared to 75–78% sensitivity and ~90% validation of the Bayesian network (Fig. 1G and fig. S11). Integration of microarray data, CLIP clusters, and YCAY clusters by naïve Bayes or logistic regression made clear but relatively moderate improvement, with 61% sensitivity and an estimated validation rate of 65–67% (Fig. 1G, and fig. S11C and E). These observations underscore the effectiveness of our integrative strategy.
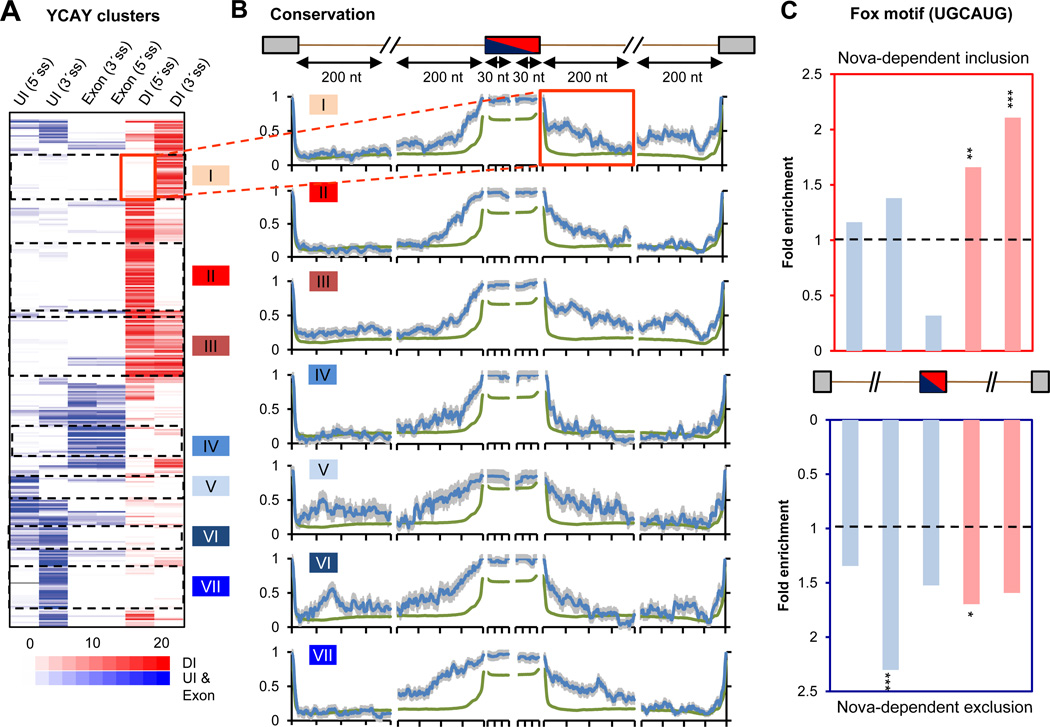
The comprehensive list of Nova targets makes it possible for the first time to correlate the positions of Nova-binding sites with sequence conservation profiles (Fig. 2 A and B, and dataset S3). While Nova-binding sites are conserved in general (2), unexpectedly, we identified additional conserved regions in regulated exons outside Nova-binding sites (Fig. 2A and B), suggesting the presence of additional regulatory elements. To search for specific RBPs that might dictate coordinated combinatorial regulation with Nova, we examined putative splicing-regulatory elements derived from brain-specifc AS exons (12). The well characterized Fox-binding element (UGCAUG) (24) was enriched in both ends of downstream introns (1.7 fold, P=0.002 for 5´ end; 2.1 fold, P=4.7×10⁻⁶ for 3´ end; 03C72 test) bordering cassette exons showing Nova-dependent inclusion, and upstream introns near 3´ splice sites (2.3 fold, P=1.8×10⁻⁵; χ2 test) of cassette exons showing Nova-dependent exclusion (Fig. 2C and fig. S12). Furthermore, 106 of the 698 Nova target AS events were candidate Fox targets in the brain, with highly conserved UGCAUG elements (7), indicating that roughly 15% of Nova targets may be under Nova and Fox combinatorial control (5.5-fold enrichment, P<10−46, Fisher’s exact test). As Fox-regulated splicing is defined by a similar position-dependent RNA-regulatory map as Nova (7, 25), these observations suggest that additive or synergistic actions of Nova and Fox may be favored over antagonistic actions.
Figure 2. Combinatorial regulation of Nova target exons.
(A) Hierarchical clustering of 325 non-redundant Nova-regulated cassette exons using six regional YCAY cluster scores in exon, UI and DI relative to alternative splice sites. The position of DI and UI/exonic YCAY clusters is predicted to dictate Nova-regulated alternative exon inclusion (red) or exclusion (blue). Seven clusters of exons with distinct Nova-binding patterns are shown. (B) Sequence conservation scores across 20 mammalian species were extracted for 30 nt exonic regions near 5´ or 3´ splice site of the regulated exon, or for 200 nt intronic regions near all four possible splice sites, as indicated in the cartoon. The average conservation profile is shown for each cluster in (A) (blue), using all cassette exons as a control (green). Error bars represent standard errors. The flanking intronic region downstream of the cassette exon in cluster I is highlighted. (C) The enrichment of the Fox motif (UGCAUG) in exons with Nova-regulated inclusion (top) or exclusion (bottom), as compared to control cassette exons. Fox-binding sites predicted to dictate Fox-regulated exon inclusion (DI) or exclusion (UI/exon) are represented by red and blue bars, respectively. Statistical significance is derived from a χ2 test (*: P<0.05; **: P<0.01; ***: P<0.001).
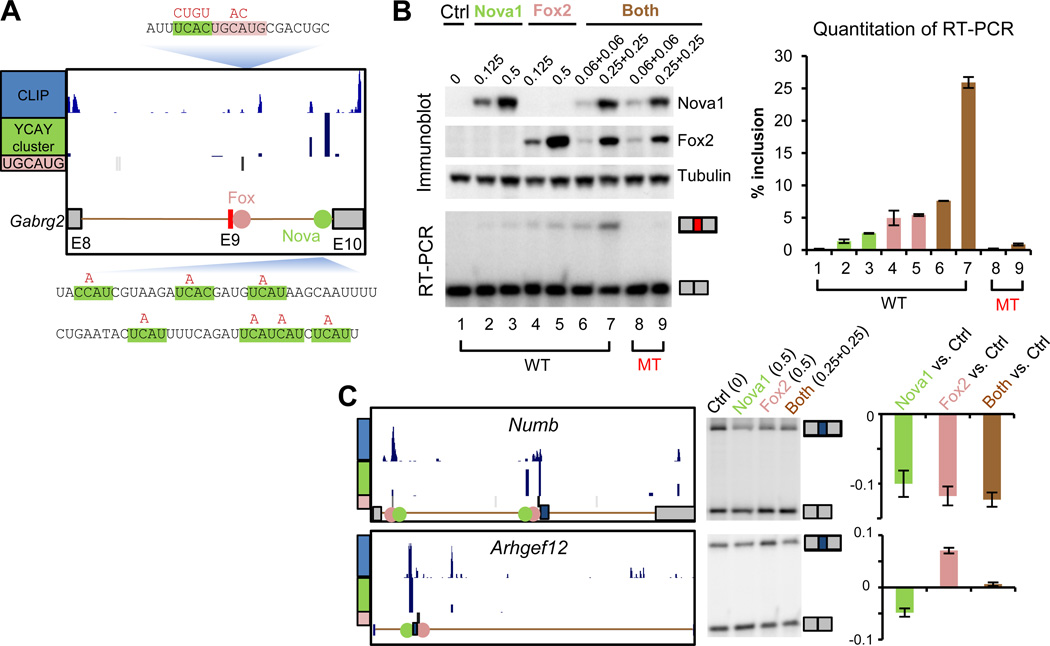
To experimentally address the bioinformatic prediction of Nova and Fox combinatorial regulation, we examined alternative splicing of several candidate exons (20). One of these, Gabrg2 exon 9, is regulated by Nova through a strong YCAY cluster (score=20) ~80 nt upstream of the 3´ splice site of intron 9 (Fig. 3A), as determined by mutagenesis analysis (26). Interestingly, an independent mutation ~30 nt downstream of exon 9 disrupted the basal level of exon 9 inclusion independent of Nova expression (26). Further examination revealed that this mutation fortuitously disrupted a very conserved Fox-binding element (Fig. 3A). To test if Nova and Fox exhibit combinatorial regulation on this exon, we transfected increasing amounts of Nova1 and Fox2, alone or in combination, into human embryonic kidney 293T cells, together with a minigene consisting of sequences between exon 8 and exon 10 (Fig. 3B). Either protein alone induced a dosage-dependent inclusion of exon 9, confirming that this exon is regulated by Nova and Fox individually. Simultaneous expression of lower amounts of both proteins dramatically increased the inclusion level from <5% to 26%, indicating a synergistic effect of Nova and Fox in splicing regulation. This synergistic regulation is direct, because mutations of their binding sites reduced exon 9 inclusion to basal levels even in the presence of both proteins. These observations suggest a model in which the binding of Fox and Nova in cis is able to synergize, perhaps by inducing a looping of the intron and thus the tethering of exons 9 and 10.
Figure 3. Experimental validation of Nova and Fox combinatorial regulation.
(A) Schematic representation of exon 8 (E8) to exon 10 (E10) of the Gabrg2 minigene (26). The CLIP tags, YCAY clusters and UGCAUG elements are shown above the cartoon. Sequences flanking Nova (shaded in green) and Fox (shaded in red) binding sites are shown. Mutations used to disrupt the Nova and Fox binding sites are indicated above the sequence. (B) After transfection of 293T cells with the Gabrg2 minigene in the presence of the indicated amounts (in ug) of Control (Ctrl), Nova1, or Fox2 expression plasmids, cells were analyzed for the indicated proteins by immunoblot and for Gabrg2 E9 splicing by RT-PCR with primers flanking E9. RT-PCR yielded the larger E9 included and smaller E9 excluded isoforms, as indicated (middle panel), and the inclusion level was quantitated in the bar graph (right panel); error bars represent standard errors estimated from two biological replicates. (C) Two additional examples of exons under Nova1 and Fox2 combinatorial regulation. For each panel, the AS region, CLIP tags, YCAY clusters and UGCAUAG elements are shown as in (A). The RT-PCR analysis is shown in the middle, with alternative isoforms indicated. The four lanes represent control cells, and cells transfected with Nova1 (0.5 µg), Fox2 (0.5 µg) and both proteins (0.25 µg +0.25 µg), respectively. The quantitated splicing changes (ΔI), are shown on the right, with averages and standard errors estimated from four replicates.
Altogether, we validated seven exons showing splicing regulation by both proteins, through synergistic (Gabrg2 and Mtap7d2), additive (Numb, Syne2 and Pbrm1), or antagonistic (Arhgef12 and Alcam) actions (Fig. 3B and C, and fig. S13). In all seven cases, the splicing outcomes can be predicted from a combinatorial RNA-regulatory map derived by superposing the map for each individual protein (fig. S13), offering a means of understanding the spatial and temporal control of RNA complexity.
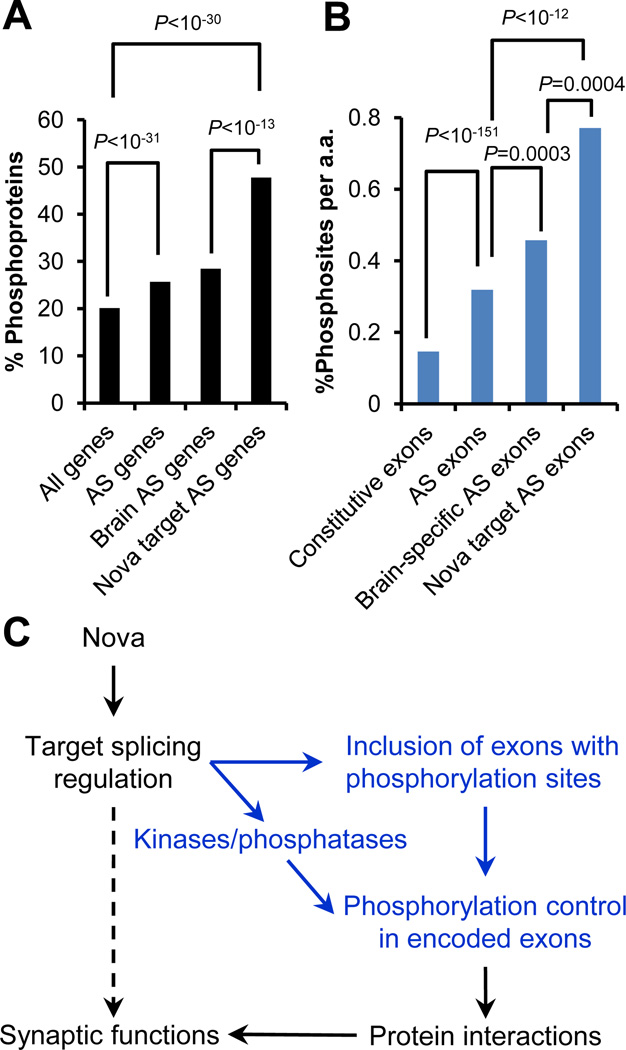
Nova regulates AS of transcripts encoding synaptic proteins that themselves interact with each other (10). The comprehensive network confirmed and extended this observation, using GO term and KEGG pathway analysis (tables S7 and S8). Nonetheless it has been unclear exactly how Nova-regulated AS might impact such interactions. Analysis of protein annotations revealed that about half of Nova target transcripts encoded phosphoproteins, a 1.7-fold enrichment compared to brain-expressing AS genes (P<10−13, Fisher’s exact test) (Fig. 4A) (20). Furthermore, Nova-regulated exons within these transcripts themselves encoded experimentally determined phosphorylation sites much more frequently when compared with constitutive or overall alternative exons (>2.4 fold, P<10−12; Fisher’s exact test; Fig. 4B), or more strictly with non-target brain-specific AS exons, (1.7 fold, P<0.0004; Fisher’s exact test; Fig. 4B) (12, 20). Similar observations were obtained with a more stringent subset of phosphorylation sites experimentally determined in the brain and thus most relevant for Nova function (20) (fig. S14). Moreover, Nova target genes included 25 kinases and 9 phosphatases, a 2.5-fold enrichment compared to all brain-expressing genes (P=10−5, Fisher’s exact test). Thus, Nova directly affects the in vivo phosphorylation patterns of brain proteins via AS regulation, a two-layered control to modulate downstream protein-protein interactions and physiological functions (Fig. 4C and table S6).
Figure 4. Nova target AS switches protein phosphorylation.
(A) Percentage of phosphoproteins for different sets of genes. (B) Percentage of experimentally determined phosphorylation sites per amino acid for different sets of exons. Different groups in (A) and (B) were compared by a Fisher’s exact test, respectively. (C) A model of Nova AS regulation to control protein phosphorylation patterns, a mechanism to modulate downstream protein-protein interactions and synaptic functions.
Finally, the comprehensiveness of the network suggests new relationships to physiology and disease. A subset of newly-predicted Nova-regulated exons are known to be functionally significant, and in some cases are essential for viability (e.g. the switch of Snap25 exon 5a/5b (27); table S6). 88 of the 358 Nova target genes are currently implicated in genetic diseases (1.5-fold enrichment compared to brain-expressing genes, P<5×10⁻⁴, Fisher’s exact test; table S9) (20), including neurologic disorders such as mental retardation, epilepsy and autism. Fox1 (A2BP1) itself is an autism susceptibility gene (28). Moreover, 8.5% genes predicted to be regulated by both Nova and Fox (on the same or different exons) are implicated in autism, compared to 3.3–3.4% for genes targeted by Nova or Fox alone (P<0.02, χ2 test), and 1.2% in all brain-expressing genes (P=10−7, Fisher’s exact test) (20). Thus coordinated RNA regulation may be susceptible to disruptions in complex multigenic neurologic diseases. While placing discrete exons and genes in the Nova (and Fox) target networks already points ways toward greater understanding of RNA regulation and disease mechanisms, the functions encoded by most AS exons remain to be characterized.
Recent advances in machine learning using sequence motifs and other RNA features are beginning to derive general rules relevant to tissue-specific splicing regulation (8). These efforts are complemented and extended by the network analysis presented here, which sums multiple types of data to generate highly accurate and global predictions of specific RBP-target regulatory interactions. This strategy should improve splicing code fidelity and provide a guide to prioritize further functional studies. Taken together, the integrative network analysis has the potential to fill gaps between the delineation of alternative RNA processing, its underlying regulatory mechanisms, and its biological significance.
Supplementary Material
Acknowledgments
We thank A. R. Krainer for Fox 1/2 expression constructs, S. Dewell for Illumina sequencing, and all Darnell lab members for helpful discussions. This work was supported by grants from the NIH to RBD (NS34389) and the Rockefeller University Hospital CTSA (UL1 RR024143). RBD is an HHMI Investigator. The HITS-CLIP and microarray data have been deposited to the NCBI SRA (SRA019982) and GEO (GSE22115) databases, respectively.
References and Notes
- 1.Nilsen TW, Graveley BR. Expansion of the eukaryotic proteome by alternative splicing. Nature. 2010;463:457. doi: 10.1038/nature08909. [DOI] [PMC free article] [PubMed] [Google Scholar]
- 2.Licatalosi DD, Darnell RB. RNA processing and its regulation: global insights into biological networks. Nat Rev Genet. 2010;11:75. doi: 10.1038/nrg2673. [DOI] [PMC free article] [PubMed] [Google Scholar]
- 3.Cooper TA, Wan L, Dreyfuss G. RNA and disease. Cell. 2009;136:777. doi: 10.1016/j.cell.2009.02.011. [DOI] [PMC free article] [PubMed] [Google Scholar]
- 4.Li Q, Lee J-A, Black DL. Neuronal regulation of alternative pre-mRNA splicing. Nat Rev Neurosci. 2007;8:819. doi: 10.1038/nrn2237. [DOI] [PubMed] [Google Scholar]
- 5.Licatalosi DD, Darnell RB. Splicing regulation in neurologic disease. Neuron. 2006;52:93. doi: 10.1016/j.neuron.2006.09.017. [DOI] [PubMed] [Google Scholar]
- 6.Galarneau A, Richard S. Target RNA motif and target mRNAs of the Quaking STAR protein. Nat Struct Mol Biol. 2005;12:691. doi: 10.1038/nsmb963. [DOI] [PubMed] [Google Scholar]
- 7.Zhang C, et al. Defining the splicing regulatory network of tissue-specific splicing factors Fox-1/2. Genes Dev. 2008;22:2250. doi: 10.1101/gad.1703108. [DOI] [PMC free article] [PubMed] [Google Scholar]
- 8.Barash Y, et al. Deciphering the splicing code. Nature. 2010;465:53. doi: 10.1038/nature09000. [DOI] [PubMed] [Google Scholar]
- 9.Licatalosi DD, et al. HITS-CLIP yields genome-wide insights into brain alternative RNA processing. Nature. 2008;456:464. doi: 10.1038/nature07488. [DOI] [PMC free article] [PubMed] [Google Scholar]
- 10.Ule J, et al. Nova regulates brain-specific splicing to shape the synapse. Nature Genet. 2005;37:844. doi: 10.1038/ng1610. [DOI] [PubMed] [Google Scholar]
- 11.Castle JC, Zhang C, Shah JK, Kulkarni AV, Johnson JM. Expression of 24,426 human alternative splicing events and predicted cis regulation in 48 tissues and cell lines. Nature Genet. 2008;40:1416. doi: 10.1038/ng.264. [DOI] [PMC free article] [PubMed] [Google Scholar]
- 12.Wang ET, et al. Alternative isoform regulation in human tissue transcriptomes. Nature. 2008;456:470. doi: 10.1038/nature07509. [DOI] [PMC free article] [PubMed] [Google Scholar]
- 13.Pan Q, Shai O, Lee LJ, Frey BJ, Blencowe BJ. Deep surveying of alternative splicing complexity in the human transcriptome by high-throughput sequencing. Nature Genet. 2008;40:1413. doi: 10.1038/ng.259. [DOI] [PubMed] [Google Scholar]
- 14.Blencowe BJ, Ahmad S, Lee LJ. Current-generation high-throughput sequencing: deepening insights into mammalian transcriptomes. Genes Dev. 2009;23:1379. doi: 10.1101/gad.1788009. [DOI] [PubMed] [Google Scholar]
- 15.Darnell RB. HITS-CLIP: panoramic views of protein-RNA regulation in living cells. Wiley Interdiscip Rev RNA. 2010 doi: 10.1002/wrna.31. in press. [DOI] [PMC free article] [PubMed] [Google Scholar]
- 16.Ule J, et al. An RNA map predicting Nova-dependent splicing regulation. Nature. 2006;444:580. doi: 10.1038/nature05304. [DOI] [PubMed] [Google Scholar]
- 17.Chen M, Manley JL. Mechanisms of alternative splicing regulation: insights from molecular and genomics approaches. Nat Rev Mol Cell Biol. 2009;10 doi: 10.1038/nrm2777. [DOI] [PMC free article] [PubMed] [Google Scholar]
- 18.Jansen R, et al. A Bayesian networks approach for predicting protein-protein interactions from genomic data. Science. 2003;302:449. doi: 10.1126/science.1087361. [DOI] [PubMed] [Google Scholar]
- 19.Wang Y, Zhang X-S, Xia Y. Predicting eukaryotic transcriptional cooperativity by Bayesian network integration of genome-wide data. Nucl. Acids Res. 2009;37:5943. doi: 10.1093/nar/gkp625. [DOI] [PMC free article] [PubMed] [Google Scholar]
- 20.Materials and methods are available as supporting material on Science Online
- 21.Stamm S, et al. ASD: a bioinformatics resource on alternative splicing. Nucleic Acids Res. 2006;34:D46. doi: 10.1093/nar/gkj031. [DOI] [PMC free article] [PubMed] [Google Scholar]
- 22.Boutz PL, et al. A post-transcriptional regulatory switch in polypyrimidine tract-binding proteins reprograms alternative splicing in developing neurons. Genes Dev. 2007;21:1636. doi: 10.1101/gad.1558107. [DOI] [PMC free article] [PubMed] [Google Scholar]
- 23.Xue Y, et al. Genome-wide analysis of PTB-RNA interactions reveals a strategy used by the general splicing repressor to modulate exon inclusion or skipping. Mol Cell. 2009;36:996. doi: 10.1016/j.molcel.2009.12.003. [DOI] [PMC free article] [PubMed] [Google Scholar]
- 24.Ponthier JL, et al. Fox-2 splicing factor binds to a conserved intron motif to promote inclusion of protein 4.1R alternative exon 16. J Biol Chem. 2006;281:12468. doi: 10.1074/jbc.M511556200. [DOI] [PubMed] [Google Scholar]
- 25.Yeo GW, et al. An RNA code for the FOX2 splicing regulator revealed by mapping RNA-protein interactions in stem cells. Nat Struct Mol Biol. 2009;16:130. doi: 10.1038/nsmb.1545. [DOI] [PMC free article] [PubMed] [Google Scholar]
- 26.Dredge BK, Darnell RB. Nova regulates GABAA receptor γ2 alternative splicing via a distal downstream UCAU-rich intronic splicing enhancer. Mol. Cell. Biol. 2003;23:4687. doi: 10.1128/MCB.23.13.4687-4700.2003. [DOI] [PMC free article] [PubMed] [Google Scholar]
- 27.Bark C, et al. Developmentally regulated switch in alternatively spliced SNAP-25 isoforms alters facilitation of synaptic transmission. J. Neurosci. 2004;24:8796. doi: 10.1523/JNEUROSCI.1940-04.2004. [DOI] [PMC free article] [PubMed] [Google Scholar]
- 28.Martin C, et al. Cytogenetic and molecular characterization of A2BP1/FOX1 as a candidate gene for autism. Am J Med Genet B Neuropsychiatr Genet. 2007;144B:869. doi: 10.1002/ajmg.b.30530. [DOI] [PubMed] [Google Scholar]
Associated Data
This section collects any data citations, data availability statements, or supplementary materials included in this article.


