

Cryoelectron microscopy reveals conformational changes at the contacts between tubulins between GMPCPP and GDP-taxol microtubules.
Abstract
Microtubules are dynamic polymers that stochastically switch between growing and shrinking phases. Microtubule dynamics are regulated by guanosine triphosphate (GTP) hydrolysis by β-tubulin, but the mechanism of this regulation remains elusive because high-resolution microtubule structures have only been revealed for the guanosine diphosphate (GDP) state. In this paper, we solved the cryoelectron microscopy (cryo-EM) structure of microtubule stabilized with a GTP analogue, guanylyl 5′-α,β-methylenediphosphonate (GMPCPP), at 8.8-Å resolution by developing a novel cryo-EM image reconstruction algorithm. In contrast to the crystal structures of GTP-bound tubulin relatives such as γ-tubulin and bacterial tubulins, significant changes were detected between GMPCPP and GDP-taxol microtubules at the contacts between tubulins both along the protofilament and between neighboring protofilaments, contributing to the stability of the microtubule. These findings are consistent with the structural plasticity or lattice model and suggest the structural basis not only for the regulatory mechanism of microtubule dynamics but also for the recognition of the nucleotide state of the microtubule by several microtubule-binding proteins, such as EB1 or kinesin.
Introduction
Microtubules play significant roles in various fundamental physiological processes, including intracellular transport, cell motility, cell polarization, and cell division (Verhey and Gaertig, 2007; Hirokawa et al., 2009a). Each microtubule is a dynamic polymer that stochastically switches between growing and shrinking phases. The hydrolysis of GTP by β-tubulin is the energy source for the dynamics and has many implications for cellular functions (Howard and Hyman, 2009; Kueh and Mitchison, 2009).
However, the atomic mechanism underlying microtubule dynamics has remained elusive. The atomic structures of microtubules have only been revealed for the GDP-bound state (Nogales et al., 1998; Gigant et al., 2000; Löwe et al., 2001; Li et al., 2002; Ravelli et al., 2004; Hirose et al., 2006; Kikkawa and Hirokawa, 2006; Bodey et al., 2009; Fourniol et al., 2010; Sui and Downing, 2010), whereas the structures of the GTP-bound state have only been reported based on low-resolution (14–18 Å) cryo-EM images (Meurer-Grob et al., 2001; Wang and Nogales, 2005). Recently, the crystal structures of tubulins in both the GTP- and GDP-bound states have been reported as a complex with the RB3 protein or for the closely related proteins γ-tubulin and bacterial tubulins (Aldaz et al., 2005; Oliva et al., 2007; Rice et al., 2008; Aylett et al., 2010; Nawrotek et al., 2011). Small conformational differences between the GTP- and GDP-bound states were observed at the nucleotide-binding interface of β-tubulin. An idea designated the structural plasticity or lattice-constraint model was thus proposed, in which the conformational changes involved in switching between the growing and shrinking phases are generated by the synergy between the nucleotide effect and the restraint in the microtubule lattice (Rice et al., 2008; Kueh and Mitchison, 2009; Aylett et al., 2011).
Here, we report the high-resolution cryo-EM structures of microtubules in the GTP-bound state with a resolution better than 10 Å (8.8 Å at Fourier shell correlation [FSC] = 0.5). Statistically significant conformational changes were detected at tubulin–tubulin interfaces, both along the protofilaments and between neighboring protofilaments, providing a structural basis for the regulatory mechanism of microtubule dynamics.
Results and discussion
Structural features of the GMPCPP microtubule
The 3D structure of microtubules has initially been reconstructed using a helical method (Hirose et al., 2006; Kikkawa and Hirokawa, 2006), but single-particle approaches become necessary to overcome difficulties to extend resolution. Previous studies achieved resolutions better than 10 Å using reference-based single-particle analysis (Li et al., 2002; Sui and Downing, 2010). In these studies, however, the differences between α- and β-tubulins were neglected because they are indistinguishable at low spatial resolution. Hence, we have developed a new algorithm based on the reference-free single-particle analysis to solve the microtubule structure with the clear discrimination between α- and β-tubulins. A single-particle analysis was modified to use the helical symmetry of the microtubule, and the tubulin dimer was treated as the minimal asymmetric unit. We first solved the structure of paclitaxel (taxol)-stabilized GDP microtubules (GDP-taxol microtubules) to validate the new algorithm (Figs. S1 and S2). This 9.7-Å structure was consistent with the previously reported GDP-taxol microtubules (Li et al., 2002; Sui and Downing, 2010). We then applied this algorithm to a microtubule polymerized with the slowly hydrolyzable GTP analogue GMPCPP (Hyman et al., 1992, 1995). The cryo-EM structure with >90% occupancy of GMPCPP of β-tubulins (Fig. 1 A) was solved by averaging >320,000 tubulin dimers. The resolution extended to 8.8 Å according to the conservative criteria of FSC = 0.5 (Fig. 1 B). This GMPCPP microtubule structure was significantly different from the GDP-taxol microtubule structure, and we describe and discuss the differences between these two structures in the following paragraphs. In this paper, we assume that most of the structural differences are a result of the difference of the nucleotide; however, it is possible that taxol, a well-known microtubule stabilizer, will affect the microtubule lattice structure. Future structural analyses of the GMPCPP-taxol microtubule and GDP microtubule without taxol will be required for the understanding of the conformational effects by taxol and nucleotide states.
Figure 1.
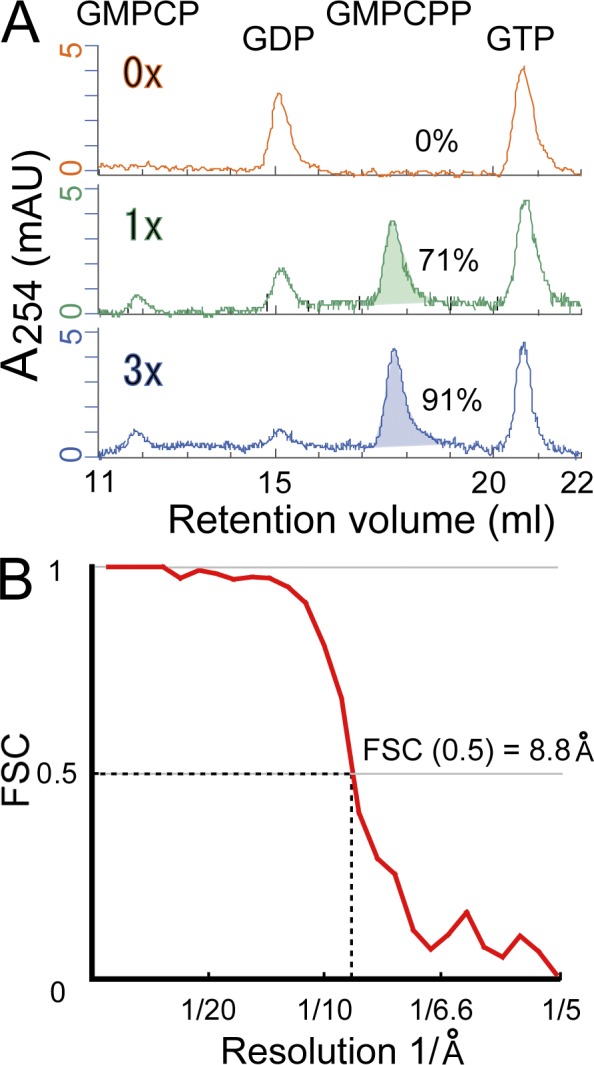
The nucleotide contents and the estimated resolution based on FSC. (A) Analysis of the nucleotide contents by FPLC. Three chromatograms are shown: GDP-taxol microtubule (top), GMPCPP microtubule prepared by one cycle of GMPCPP uptake (middle), and GMPCPP microtubule prepared by three cycles of GMPCPP uptake (bottom). The occupancies of GMPCPP in the E site are shown at the right side of each chromatogram. mAU, milli-absorbance unit. (B) FSC function for the resolution estimation. The datasets of GMPCPP microtubule images were split in half to make two independent reconstructions, and the FSC function was calculated for the whole map (32.5 nm × 32.5 nm × 32.5 nm).
The overall structure of the GMPCPP microtubule is mostly similar to that of the GDP-taxol microtubule, except for two features (Figs. 2 A and S1 A). The first feature is the holes at the junctions of four tubulin monomers (Fig. 2 A). The sizes of these holes, in general, are smaller in the GMPCPP microtubule than in the GDP-taxol microtubule (Fig. S1 A). The shapes of the holes at the junction of four tubulin dimers (intertubulin dimer interface; dashed circles in Fig. 2 A), which exhibits a smaller heart shape, are different from those at the intratubulin dimer interface (dashed squares in Fig. 2 A), suggesting that the inter- and intratubulin dimer junctions might be fortified in the GMPCPP microtubule in a different way. The second feature is the lateral contacts. Additional lateral contacts are formed between the β-tubulins of neighboring protofilaments in the GMPCPP microtubule (arrowheads in Fig. 2 A).
Figure 2.

Cryo-EM structure of a GMPCPP microtubule. (A) A low-pass–filtered GMPCPP microtubule seen from the outside with a 10-Å cutoff for the fair comparison with the GDP-taxol microtubule (Fig. S1). The plus end is up. α and β show the positions of α- and β-tubulins, respectively. The dashed orange circles and squares show the holes in the microtubule wall. The purple and cyan planes show sectioning planes for views in B and Fig. 3, respectively. Arrowheads indicate OCs. (B) Contour plot of a cross-section at 10-Å resolution observed from the plus end. Most of the α helices are well resolved as the local maxima of the densities. The arrowheads show OCs, and the dashed circle shows the low-density region at the middle of the tubulin monomers. Also see Figs. S1 and S2 and Video 1 for the comparison between GMPCPP and GDP-taxol microtubules. Bars, 2 nm.
The cross-sectional view clearly illustrates two layers of lateral contacts in the GMPCPP microtubule. Fig. 2 B shows a contour plot of a section perpendicular to the microtubule axis. Owing to the twist of the protofilaments (superhelix) of the 15-protofilament microtubule, this section shows all structural informations of the asymmetrical unit in our map (α- and β- tubulin dimer), and the α helices that run roughly parallel to the microtubule axis are particularly well resolved (Fig. 2 B and Video 1). In the cross-sectional view, each tubulin monomer in the GDP-taxol microtubule appears as a single mass (Fig. S1 B), whereas each tubulin monomer in the GMPCPP microtubule appears as two separated masses (Fig. 2 B). Consequently, the GMPCPP microtubule takes a double-layered ring structure (Fig. 2 B; the red dashed circle shows the cleft between the two layers). The additional lateral contacts unique to the GMPCPP microtubule are the contacts between the outer layer masses of β-tubulin (arrowheads in Fig. 2 B). Here, we designate these contacts as outer contacts (OCs) and the contacts between the inner layer masses as inner contacts (ICs).
For a clearer presentation of the lateral contacts between adjacent β-tubulins, contour plots sectioned at the middle of β-tubulin that is the parallel plane to the helical axis made by the neighboring β-tubulins are shown (Fig. 3). Both the OCs and ICs are clearly formed in the GMPCPP microtubule (Fig. 3, A and B), whereas only the ICs are formed in the GDP-taxol microtubule (IC in Fig. 3 C). Statistical analyses detected significant decreases in the density at the middle of β-tubulins in the GMPCPP microtubule (blue in Fig. 3 D). This reflects the apparent separation of the outer and inner layers. Significant increases in the density (red in Fig. 3 D) were detected near the contacts between the outer masses (red in Fig. 3 D), reflecting the formation of the OCs (arrowheads in Fig. 3 [A and B]). Thus, the apparent structural features of the GMPCPP microtubule were statistically validated.
Figure 3.

Conformational differences of β-tubulin between a GMPCPP and a GDP-taxol microtubule. (A–C) Contour plots at the middle of β-tubulin (see Fig. 1 A for the sectioning plane). Both the 8.8-Å (A) and low-pass–filtered 10-Å (B) maps are presented for the GMPCPP microtubule. The low-pass–filtered 10-Å map is presented for the GDP-taxol microtubule (C). The contour level of the outermost green shell is adjusted at 1.4 σ for all three maps. (D) Statistical significance of differences (t map) between the low-pass–filtered GMPCPP and GDP-taxol microtubules with a 10-Å cutoff. Red and blue show increases and decreases in the GMPCPP microtubule, respectively. Dark colors, light colors, and the mesh show significance levels of P < 10−4, P < 10−3, and P < 10−2, respectively. Arrowheads indicate OCs. Bars, 2 nm.
Atomic model fitting into the GMPCPP microtubule map
To gain clearer insights into the structural changes of microtubules during GTP hydrolysis, the atomic model of the tubulin-dimer with GDP-taxol in the zinc-induced tubulin sheet (Protein Data Bank accession no. 1JFF) was fitted to our cryo-EM map (see Materials and methods for detail). As expected from the differences of the GMPCPP map from the GDP-taxol map, the GDP-taxol tubulin model does not fit well to the GMPCPP map. We have tried flexible fitting using Flex-EM (Topf et al., 2008) to estimate the atomic model of GMPCPP-tubulin. Through this trial, we have noticed that most of the differences between the maps can be explained by the relative movements among the subdomains and that the conformational changes in the subdomain are much smaller. Therefore we have divided the atomic model into four subdomains: N1 domain (aa 1–94), N2 domain (aa 95–203), I domain (aa 204–382), and C domain (aa 383–end). These four subdomains were fitted as rigid bodies to the map. The model thus derived fitted well to the map without further flexible fitting (Figs. 4, S2, and S3 and Video 2). However, it should be noted that this model is a conservative approximate model. The positions of the most of the secondary structures are supported by the density in the map, so that we can safely describe the conformational changes at the secondary structure level. Further details, such as the positions of some specific residues, require higher-resolution maps. In the following paragraphs, we describe the major conformational changes within the tubulin monomers in the microtubule lattice according to the following orientations: top refers to the plus-end side, bottom refers to the minus-end side, right and left refer to the lateral surfaces, and outer and inner refer to the outer and inner surfaces of the microtubule.
Figure 4.

Conformational changes in α- and β-tubulin monomers. (A, C, E, and G) Contour plots with statistical significance. Colorings of t maps are same as in Fig. 3 D. (B, D, F, and H) Rigid body fitting of the atomic model. Regions with large subdomain movements are shown (N2 domain of β-tubulin in B and D, N1 domain of α-tubulin in F and H, and I domain of α-tubulin in H). The gray and colored ribbons show atomic models before and after subdomain fitting, respectively. The α-tubulins are colored red (N domain) and cyan (I domain), whereas the β-tubulins are colored brown (N domain) and blue (I domain). Sectioning planes and orientations of the views for C–D, E–F, and G–H are shown in A (black boxes). The brown circle shows the tight bond at the intratubulin dimer junction. The star indicates the putative site for Lys-40 of α-tubulin. Bars, 2 nm.
Conformational changes in β-tubulins
In β-tubulin, the N2 domain (helices H3–H5), which is located on the top and outer left side, rotates 16 degrees counterclockwise relative to the other subdomains. The rotation axis is almost parallel to the microtubule (Fig. 4, B, D, and F). Comparisons with the GDP-taxol structure (gray in Fig. 4 [B, D, and F]) show that the movement of the N2 domain helices H3–H5 can explain most of the structural changes of β-tubulin detected in Fig. 3 D. The decreases and increases in the density of β-tubulin in the GMPCPP microtubule correspond well to the outward movement of the N2 domain (Fig. 4, A and B). This movement will enable H3 and H4 (H4-S5 loop) of the N2 domain to reach H9 and the H10-S9 loop of the I domain, thereby allowing the OC to be formed (OC in Fig. 4 [B and D]). The IC between β-tubulins is formed between the M loop and H1-S2 loop (IC in Fig. 4 B), both of which will not make large conformational changes, and is thus essentially the same as in the GDP microtubule.
These two layers of lateral contacts formed in the GMPCPP microtubule are very suggestive. GMPCPP microtubules are known to have higher flexural rigidity than GDP-taxol microtubules (Mickey and Howard, 1995), which might reflect this additional lateral contact in the GMPCPP microtubules. Furthermore, they might correspond to the two modes of lateral contacts reported for the previous low-resolution cryo-EM structure of GMPCPP-tubulin ribbons (Wang and Nogales, 2005; Wu et al., 2009), the tube bond, and the sheet bond. Their positions and sizes suggest that the tube bonds correspond to the ICs and the sheet bonds correspond to the OCs. Our atomic model indicates that the OCs are supported by charged or long side-chain residues, whereas the ICs are mediated by short-reach hydrophobic residues. These observations are consistent with the scenario proposed by Wang and Nogales (2005) and Wu et al. (2009). At the plus end of the polymerizing microtubule, the long-reach OC (sheet bond) will be formed first, and, thus, an open sheet structure will be formed at the plus end. The formation of the IC (tube bond) will then follow to close the sheet and form the microtubule structure. After GTP hydrolysis, the OC will be broken, and the GDP microtubule lattice will only be supported by the IC, which will destabilize the microtubule lattice (Video 3).
Conformational changes in α-tubulins
In α-tubulin, both the N1 domain and I domain show large movements relative to the other domains (Fig. 4, E–H). The I domain of α-tubulin is located immediately above the GTP hydrolysis pocket of β-tubulin (E site) and forms the right wall of the protofilament. The I domain rotates 10 degrees around the axis nearly perpendicular to the protofilament (Fig. 4 H). Among the helices in this I domain, helix H7 is thought to serve as a shaft that regulates the longitudinal contacts (Ravelli et al., 2004), which will involve the conformational changes in the N1 domain described in the following paragraphs.
The N1 domain is located on the inner left side of α-tubulin (Fig. 4, F and H). It makes close contacts with the I domain, and the rotation of the I domain will be conveyed to the N1 domain. In fact, the N1 domain rotates in the opposite direction to the I domain, which apparently compensates for the rotation of the I domain. This rotation will rearrange both the inter- and intratubulin dimer junctions.
At the N-terminal end of the N1 domain, the helix H2 rotates and moves toward the lumen side of the microtubule (Fig. 4, F and H). This rotation generates the tight bridging between this helix and the H1-S2 loop of the β-tubulin above (dashed circle in Fig. 4 H), fortifying the longitudinal contact at the intratubulin dimer interface (Fig. 4, E–H). As a consequence, the axes of N-terminal helices H1 and H2 become more parallel to the microtubule axis, which might favor the straight conformation of the GMPCPP microtubule and might explain the stability and the stiffness of the GMPCPP microtubule (Mickey and Howard, 1995).
At the C-terminal end of the N1 domain, helix H1 and the following H1-S2 loop of α-tubulin are very flexible and were missing in the previous atomic models in the GDP-taxol microtubule (Gigant et al., 2000; Löwe et al., 2001; Ravelli et al., 2004). In the GMPCPP microtubule, however, clear densities corresponding to this region were identified (Figs. 4 [G and H] and S2 B); these make the notch of the heart-shaped hole at the interdimer interface (Figs. 2 A [dashed circles] and 4 [G and H]). This suggests that the conformational changes of the N1 domain of α-tubulin in the GMPCPP microtubule will stabilize the conformation of helix H1 and the H1-S2 loop by making extensive longitudinal and lateral contacts at the junction of four tubulin dimers (intertubulin dimer interface). Thus, the H1-S2 loop of α-tubulin can mediate interactions that gather four tubulin dimers, a role similar to doublecortin (Fourniol et al., 2010), to initiate the polymerization and/or stabilization of the plus end of the microtubule. Interestingly, the α-tubulin–specific but highly conserved Lys-40, whose acetylation is known to affect microtubule stability and various cellular functions (Verhey and Gaertig, 2007), is located in this loop (star in Fig. 4 H). This indicates that the conformational change of this region is very fundamental for microtubule formation and dynamics and suggests the functional importance of the conserved posttranslational modification of Lys-40.
Implications for the interactions with microtubule-binding proteins and the regulation of the microtubule dynamics
Recent studies have suggested that some microtubule-binding proteins can discriminate between the nucleotide states of microtubules. For example, the plus-end–tracking protein EB1 was reported to show higher affinity for GMPCPP microtubules than for GDP microtubules (Zanic et al., 2009). This preferential binding to the GTP-bound state is proposed as the plus-end–tracking mechanism for EB1. We recently reported that a microtubule motor kinesin, KIF5, has 3.5 times higher affinity for GMPCPP microtubules than for GDP microtubules and that this preference will guide KIF5 into the axon of a neuron (Nakata et al., 2011). A mutational analysis in our study further suggested that loop L11 of KIF5 is essential for this preferential binding to GMPCPP microtubules.
High-resolution cryo-EM studies of the kinesin–microtubule complex suggested that loop L11 of kinesin will bind to the cleft between the C-terminal end of helix H4 of β-tubulin and helix H11’ of α-tubulin (kinsein-binding site [KB] in Fig. 5; Nitta et al., 2004; Hirokawa et al., 2009b). Thus, the movement of helix H4 of β-tubulin is very suggestive for the mechanism of the preferential binding of kinesin to GMPCPP microtubules. In the GMPCPP microtubule, the C-terminal half of helix H4 is pushed up toward kinesin (Fig. 5 A), and its C terminus apparently makes a longitudinal contact with helix H11’ of α-tubulin (Fig. 5 C). Thus, the putative binding site for loop L11 of kinesin is exposed toward kinesin in the GMPCPP microtubule, which will serve as the structural basis for the preferential binding of kinesin. Future high-resolution cryo-EM studies for kinesin-GMPCPP microtubules will examine these possibilities.
Figure 5.

Proposed mechanism for the recognition of GTP microtubules by kinesin and EB1. (A) GTP form of β-tubulin seen from the plus end. Binding site (KB) for loop L11 (blue) of kinesin (white ribbon) is elevated toward kinesin. (B) GDP form of β-tubulin seen from the plus end. Binding site for kinesin is down and away from kinesin (see Video 3 for details). (C) Side view of KB formed between helix H4 of β-tubulin and helix H11’ of α-tubulin. (D) View from the outside of the microtubule. KB is located near an OC as the putative binding site for EB1 (EB). The conserved acetylation site of Lys-40 of α-tubulin (star) is accessible from outside of the microtubule. Bars, 2 nm.
The lower-resolution cryo-EM study of the EB1–microtubule complex suggested that the binding site for EB1 will be close to the OC, which is adjacent to the L11-binding site (des Georges et al., 2008). Thus, EB1 can use the presence of the OC as a signature for the GTP state. Recently, however, EB1 was reported to have much higher affinity to GTPγS microtubules (Maurer et al., 2011), suggesting the possibility that GTPγS-microtubule has a different conformation that favors the binding of EB1.
The view from the outside of the GMPCPP microtubule (Fig. 5 D) further suggests another potential signature for the conformation. The H1-S2 loop of α-tubulin, especially the conserved acetylation site Lys-40 (star in Fig. 5 D), is also adjacent to the OC and can be reached from the outside of the microtubule. It has long been unclear how the acetylation in the lumen of the microtubule can play important roles for the regulation of microtubule-based processes, but our structure suggests that some proteins may recognize the acetylated Lys-40 from the outside of the microtubule.
Finally, our results suggest the possibility that some proteins may regulate the microtubule dynamics by stabilizing or destabilizing the conformation reported here. For example, if certain proteins bind to the OCs and stabilize them, the conformational changes into the GDP microtubule structure will be inhibited, and the microtubule will be stabilized. Conversely, if certain proteins bind and break the OCs, the microtubule will readily take the GDP-bound conformation and become destabilized. These scenarios suggest new mechanisms of action for microtubule stabilizers and destabilizers. Future studies to test these models are awaited.
Materials and methods
Sample preparation and EM
Tubulin was purified from porcine brains by six cycles of polymerization/depolymerization. A high-molarity Pipes buffer was used to remove contaminating microtubule-associated proteins. For GDP-taxol microtubules, 7.0 µM tubulin was polymerized in a polymerization buffer (100 mM Pipes, pH 6.8, 1 mM EGTA, 1 mM MgCl2, 1 mM GTP, 7% DMSO, and 10 µM paclitaxel) at 37°C for 60 min. For GMPCPP microtubules, 3.0 µM tubulin was incubated in a polymerization buffer (100 mM Pipes, pH 6.8, adjusted by KOH, 1 mM EGTA, 1 mM MgCl2, 0.6 mM GMPCPP, and 5% DMSO) at 4°C for 30 min and then clarified by centrifugation at 4°C for 30 min at 100,000 g using a rotor (TLA-110; Beckman Coulter) in an ultracentrifuge (TLX; Beckman Coulter). The supernatant was polymerized at 37°C for 120 min, and the microtubules were collected by centrifugation through a 20% glycerol cushion at 27°C for 10 min at 20,000 g using a rotor (TLA-45; Beckman Coulter) in an ultracentrifuge (TLX). This cycle for GMPCPP uptake into the microtubules was repeated three times to increase the occupancy of GMPCPP on the E site.
A 5-µl drop of the polymerized microtubules was placed onto a glow-discharged holey carbon film on a copper mesh grid (Maxtaform HF35; Pyser-SGI). After 30 s, this solution was absorbed by filter paper (no. 1; Whatman) and quickly replaced with an 8-µl drop of the same buffer without microtubules. Immediately after absorbing this drop, the grid was plunge frozen in liquid ethane at −185°C, cooled using liquid nitrogen. The specimens were observed using a 200-kV field emission cryoelectron microscope (JEM-2010F; JEOL) with a 626 cryotransfer holder (Gatan, Inc.). Images were recorded at 40,000-fold magnification on SO163 film (Kodak) with defocus values ranging from 1.3 to 2.8 µm.
The 15-protofilament and 2-start helix microtubules (15-protofilament and 4-start for tubulin monomers) were identified by the moiré pattern, and the optical diffraction pattern of the relative peaks near 1/40 Å and the microtubule polarity were determined. The selected film was digitized with a charge-coupled device film scanner (Scitex Leafscan45; Leaf Systems) so that the final pixel size of the digitized images was 2.5 Å.
Image analysis
A high-pass–filtered cryo-EM image of a microtubule was cropped into 60 × 60–nm square pieces. The cropping frames were initially centered along the microtubule at 150-nm intervals, closely corresponding to the periodicity of the superhelix of the protofilament. These frames were categorized as class 1. Each of the cropping frames in class 1 was shifted vertically by 8.28 nm, the length of a tubulin dimer, to produce the class 2 set. This process was repeated to create 18 classes (150/8.28 = 18). The positions of the frames were then iteratively adjusted to improve the contrast score of the class-averaged image (Ogura and Sato, 2006). After the simulated annealing, the frame intervals between the neighboring classes were measured to exclude the segments with the lattice failures or distortions. The contrast transfer function (CTF) correction of class averages were then performed with Imagic V (Image Science). The CTF parameters for each micrograph were based on defocus values determined by CTFFIND3 (Mindell and Grigorieff, 2003). After the rotational and translational parameters of each class average was iteratively refined by the modified simulated annealing method (Ogura and Sato, 2006), the 3D structure was reconstructed from this set of CTF-weighted average of microtubule images with different defocus values using the simultaneous iterative reconstruction technique (Penczek et al., 1992). The angular interval of each class average was optimized to be 23.82 degrees, which is derived from the supertwist of the microtubule with 15 protofilaments and 2 starts. These iterative processes to refine the in-plane and helical parameters contributed to increasing the resolution of our maps. After the averaging of the whole tubulin dimers within the resulting reconstruction of microtubules, a 3D fast bilateral filter created with MATLAB (MathWorks, Inc.) was applied for noise reduction without blurring (a MATLAB function of bilateral3 written by Igor Solovey). A B-factor of 400 Å2 using the program EM-BFACTOR was then applied to compensate for amplitude attenuation at higher resolutions (Fernández et al., 2008).
Atomic model fitting
We used the atomic model of the tubulin dimer obtained by electron crystallography (Protein Data Bank accession no. 1JFF; Löwe et al., 2001) as the initial model. The Fit in Map tool in UCSF Chimera (Pettersen et al., 2004) was used for the rigid body fitting of the atomic models into the density maps with the guidance of fitting score (average map value [AMV]). For the first round of the fitting, the atomic model of each monomer was treated as a rigid body to fit into the map. Each tubulin monomer was fitted well to our GDP-taxol microtubule (AMV = 175.4 and 177.4 for α- and β-tubulins, respectively) but did not fit well to the GMPCPP microtubule (AMV = 158.3 and 162.6, respectively), especially in the regions that showed marked structural differences. Therefore, we divided the tubulin monomer atomic model into three subdomains, as previously reported: N domain (aa 1–203), I domain (aa 204–382), and C domain (aa 383–C terminal). The I domain and C domain fitted well to the map by rigid body fitting, but the fitting of the N domain was still poor, providing only modest improvements (AMV = 162.4 and 168.4, respectively). Hence, we further divided the N domain into two domains: N-terminal half (N1 domain, aa 1–94) and C-terminal half (N2 domain, aa 95–203). After division into these four subdomains, the atomic models of both α- and β-tubulins fitted well to the cryo-EM density map (AMV = 168.5 and 170.8, respectively; Figs. 4, S2, and S3 and Video 2).
Statistical analysis
The statistical significance of differences between the GMPCPP and GDP-taxol cryo-EM maps was examined by Student’s t test. As the final 3D map was made by averaging 25 independent protofilament segments, these independent segments were used as the dataset for the t test. The maps before final averaging were low-pass filtered at 10 Å to remove noise in the higher–spatial frequency domain and to match the resolution difference. Then, they were divided into 25 independent datasets (400 Å × 400 Å × 105 Å). The t value was calculated for each voxel after normalization of the average and the variance (degrees of freedom = 48).
Determination of nucleotide composition
Polymerized microtubules were denatured by the addition of 8 M urea in 100 mM Tris-HCl, pH 7.2, followed by heating to 100°C for 1 min. The solution was then diluted with 1 vol of water and filtered through a 10,000-kD cutoff centrifugal filter unit (Amicon Ultra-4; EMD Millipore) followed by washing through the filter with 2 vol of water. The filtrate was analyzed by fast protein liquid chromatography (FPLC) using a 1-ml 5/50 GL anion-exchange column (Mono Q; GE Healthcare) in 100 mM Tris-HCl, pH 8.0, and eluted with a 0–400 mM gradient of NaCl. The peak areas were analyzed and recorded for their OD254 using FPLC software (UNICORN; GE Healthcare). The standards used were 0.5–2.0 nmol of GMPCPP, GTP, GMPCP, and GDP, evaluated separately from the sample under analysis.
Online supplemental material
Fig. S1 shows the cryo-EM structure of a GDP-taxol microtubule solved by our new algorithm. Fig. S2 shows the 3D cryo-EM density maps of a GMPCPP and GDP-taxol microtubule with fitted atomic models in stereo. Fig. S3 shows the comparison between the experimental and simulated maps of the GMPCPP microtubules fitted with the atomic model seen from the minus end. Video 1 shows a sequence of the contour plots of GMPCPP microtubule and GDP-taxol microtubule seen from the plus end. Video 2 shows the 3D density map of GMPCPP microtubule with fitted atomic models seen from the minus end of the microtubule. Video 3 shows the conformational change of β-tubulin in stereo. Online supplemental material is available at http://www.jcb.org/cgi/content/full/jcb.201201161/DC1.
Supplementary Material
Acknowledgments
We thank the members of the Hirokawa laboratory and Ms. Sachie Manaka at the National Institute of Advanced Industrial Science and Technology for assistance and discussions.
This work was supported by the Ministry of Education, Culture, Sports, Science, and Technology of Japan, a Grant-in-Aid for Specially Promoted Research to N. Hirokawa, a Global Center of Excellence Program to The University of Tokyo, and grants to T. Ogura and C. Sato from the Ministry of Education, Culture, Sports, Science, and Technology of Japan from the Japan New Energy and Industrial Development Organization and the Japan Science and Technology Corporation.
Footnotes
Abbreviations used in this paper:
- AMV
- average map value
- CTF
- contrast transfer function
- IC
- inner contact
- FPLC
- fast protein liquid chromatography
- FSC
- Fourier shell correlation
- OC
- outer contact
References
- Aldaz H., Rice L.M., Stearns T., Agard D.A. 2005. Insights into microtubule nucleation from the crystal structure of human gamma-tubulin. Nature. 435:523–527 10.1038/nature03586 [DOI] [PubMed] [Google Scholar]
- Aylett C.H., Löwe J., Amos L.A. 2011. New insights into the mechanisms of cytomotive actin and tubulin filaments. Int Rev Cell Mol Biol. 292:1–71 10.1016/B978-0-12-386033-0.00001-3 [DOI] [PubMed] [Google Scholar]
- Aylett C.H.S., Wang Q., Michie K.A., Amos L.A., Löwe J. 2010. Filament structure of bacterial tubulin homologue TubZ. Proc. Natl. Acad. Sci. USA. 107:19766–19771 10.1073/pnas.1010176107 [DOI] [PMC free article] [PubMed] [Google Scholar]
- Bodey A.J., Kikkawa M., Moores C.A. 2009. 9-Angström structure of a microtubule-bound mitotic motor. J. Mol. Biol. 388:218–224 10.1016/j.jmb.2009.03.008 [DOI] [PubMed] [Google Scholar]
- des Georges A., Katsuki M., Drummond D.R., Osei M., Cross R.A., Amos L.A. 2008. Mal3, the Schizosaccharomyces pombe homolog of EB1, changes the microtubule lattice. Nat. Struct. Mol. Biol. 15:1102–1108 10.1038/nsmb.1482 [DOI] [PMC free article] [PubMed] [Google Scholar]
- Fernández J.J., Luque D., Castón J.R., Carrascosa J.L. 2008. Sharpening high resolution information in single particle electron cryomicroscopy. J. Struct. Biol. 164:170–175 10.1016/j.jsb.2008.05.010 [DOI] [PubMed] [Google Scholar]
- Fourniol F.J., Sindelar C.V., Amigues B., Clare D.K., Thomas G., Perderiset M., Francis F., Houdusse A., Moores C.A. 2010. Template-free 13-protofilament microtubule–MAP assembly visualized at 8 Å resolution. J. Cell Biol. 191:463–470 10.1083/jcb.201007081 [DOI] [PMC free article] [PubMed] [Google Scholar]
- Gigant B., Curmi P.A., Martin-Barbey C., Charbaut E., Lachkar S., Lebeau L., Siavoshian S., Sobel A., Knossow M. 2000. The 4 A X-ray structure of a tubulin:stathmin-like domain complex. Cell. 102:809–816 10.1016/S0092-8674(00)00069-6 [DOI] [PubMed] [Google Scholar]
- Hirokawa N., Noda Y., Tanaka Y., Niwa S. 2009a. Kinesin superfamily motor proteins and intracellular transport. Nat. Rev. Mol. Cell Biol. 10:682–696 10.1038/nrm2774 [DOI] [PubMed] [Google Scholar]
- Hirokawa N., Nitta R., Okada Y. 2009b. The mechanisms of kinesin motor motility: Lessons from the monomeric motor KIF1A. Nat. Rev. Mol. Cell Biol. 10:877–884 10.1038/nrm2807 [DOI] [PubMed] [Google Scholar]
- Hirose K., Akimaru E., Akiba T., Endow S.A., Amos L.A. 2006. Large conformational changes in a kinesin motor catalyzed by interaction with microtubules. Mol. Cell. 23:913–923 10.1016/j.molcel.2006.07.020 [DOI] [PMC free article] [PubMed] [Google Scholar]
- Howard J., Hyman A.A. 2009. Growth, fluctuation and switching at microtubule plus ends. Nat. Rev. Mol. Cell Biol. 10:569–574 10.1038/nrm2713 [DOI] [PubMed] [Google Scholar]
- Hyman A.A., Salser S., Drechsel D.N., Unwin N., Mitchison T.J. 1992. Role of GTP hydrolysis in microtubule dynamics: Information from a slowly hydrolyzable analogue, GMPCPP. Mol. Biol. Cell. 3:1155–1167 [DOI] [PMC free article] [PubMed] [Google Scholar]
- Hyman A.A., Chrétien D., Arnal I., Wade R.H. 1995. Structural changes accompanying GTP hydrolysis in microtubules: Information from a slowly hydrolyzable analogue guanylyl-(alpha,beta)-methylene-diphosphonate. J. Cell Biol. 128:117–125 10.1083/jcb.128.1.117 [DOI] [PMC free article] [PubMed] [Google Scholar]
- Kikkawa M., Hirokawa N. 2006. High-resolution cryo-EM maps show the nucleotide binding pocket of KIF1A in open and closed conformations. EMBO J. 25:4187–4194 10.1038/sj.emboj.7601299 [DOI] [PMC free article] [PubMed] [Google Scholar]
- Kueh H.Y., Mitchison T.J. 2009. Structural plasticity in actin and tubulin polymer dynamics. Science. 325:960–963 10.1126/science.1168823 [DOI] [PMC free article] [PubMed] [Google Scholar]
- Li H.L., DeRosier D.J., Nicholson W.V., Nogales E., Downing K.H. 2002. Microtubule structure at 8 A resolution. Structure. 10:1317–1328 10.1016/S0969-2126(02)00827-4 [DOI] [PubMed] [Google Scholar]
- Löwe J., Li H., Downing K.H., Nogales E. 2001. Refined structure of alpha beta-tubulin at 3.5 A resolution. J. Mol. Biol. 313:1045–1057 10.1006/jmbi.2001.5077 [DOI] [PubMed] [Google Scholar]
- Maurer S.P., Bieling P., Cope J., Hoenger A., Surrey T. 2011. GTPgammaS microtubules mimic the growing microtubule end structure recognized by end-binding proteins (EBs). Proc. Natl. Acad. Sci. USA. 108:3988–3993 10.1073/pnas.1014758108 [DOI] [PMC free article] [PubMed] [Google Scholar]
- Meurer-Grob P., Kasparian J., Wade R.H. 2001. Microtubule structure at improved resolution. Biochemistry. 40:8000–8008 10.1021/bi010343p [DOI] [PubMed] [Google Scholar]
- Mickey B., Howard J. 1995. Rigidity of microtubules is increased by stabilizing agents. J. Cell Biol. 130:909–917 10.1083/jcb.130.4.909 [DOI] [PMC free article] [PubMed] [Google Scholar]
- Mindell J.A., Grigorieff N. 2003. Accurate determination of local defocus and specimen tilt in electron microscopy. J. Struct. Biol. 142:334–347 10.1016/S1047-8477(03)00069-8 [DOI] [PubMed] [Google Scholar]
- Nakata T., Niwa S., Okada Y., Perez F., Hirokawa N. 2011. Preferential binding of a kinesin-1 motor to GTP-tubulin–rich microtubules underlies polarized vesicle transport. J. Cell Biol. 194:245–255 10.1083/jcb.201104034 [DOI] [PMC free article] [PubMed] [Google Scholar]
- Nawrotek A., Knossow M., Gigant B. 2011. The determinants that govern microtubule assembly from the atomic structure of GTP-tubulin. J. Mol. Biol. 412:35–42 10.1016/j.jmb.2011.07.029 [DOI] [PubMed] [Google Scholar]
- Nitta R., Kikkawa M., Okada Y., Hirokawa N. 2004. KIF1A alternately uses two loops to bind microtubules. Science. 305:678–683 10.1126/science.1096621 [DOI] [PubMed] [Google Scholar]
- Nogales E., Wolf S.G., Downing K.H. 1998. Structure of the alpha beta tubulin dimer by electron crystallography. Nature. 391:199–203 10.1038/34465 [DOI] [PubMed] [Google Scholar]
- Ogura T., Sato C. 2006. A fully automatic 3D reconstruction method using simulated annealing enables accurate posterioric angular assignment of protein projections. J. Struct. Biol. 156:371–386 10.1016/j.jsb.2006.05.016 [DOI] [PubMed] [Google Scholar]
- Oliva M.A., Trambaiolo D., Löwe J. 2007. Structural insights into the conformational variability of FtsZ. J. Mol. Biol. 373:1229–1242 10.1016/j.jmb.2007.08.056 [DOI] [PubMed] [Google Scholar]
- Penczek P., Radermacher M., Frank J. 1992. Three-dimensional reconstruction of single particles embedded in ice. Ultramicroscopy. 40:33–53 10.1016/0304-3991(92)90233-A [DOI] [PubMed] [Google Scholar]
- Pettersen E.F., Goddard T.D., Huang C.C., Couch G.S., Greenblatt D.M., Meng E.C., Ferrin T.E. 2004. UCSF Chimera—a visualization system for exploratory research and analysis. J. Comput. Chem. 25:1605–1612 10.1002/jcc.20084 [DOI] [PubMed] [Google Scholar]
- Ravelli R.B.G., Gigant B., Curmi P.A., Jourdain I., Lachkar S., Sobel A., Knossow M. 2004. Insight into tubulin regulation from a complex with colchicine and a stathmin-like domain. Nature. 428:198–202 10.1038/nature02393 [DOI] [PubMed] [Google Scholar]
- Rice L.M., Montabana E.A., Agard D.A. 2008. The lattice as allosteric effector: Structural studies of alphabeta- and gamma-tubulin clarify the role of GTP in microtubule assembly. Proc. Natl. Acad. Sci. USA. 105:5378–5383 10.1073/pnas.0801155105 [DOI] [PMC free article] [PubMed] [Google Scholar]
- Sui H.X., Downing K.H. 2010. Structural basis of interprotofilament interaction and lateral deformation of microtubules. Structure. 18:1022–1031 10.1016/j.str.2010.05.010 [DOI] [PMC free article] [PubMed] [Google Scholar]
- Topf M., Lasker K., Webb B., Wolfson H., Chiu W., Sali A. 2008. Protein structure fitting and refinement guided by cryo-EM density. Structure. 16:295–307 10.1016/j.str.2007.11.016 [DOI] [PMC free article] [PubMed] [Google Scholar]
- Verhey K.J., Gaertig J. 2007. The tubulin code. Cell Cycle. 6:2152–2160 10.4161/cc.6.17.4633 [DOI] [PubMed] [Google Scholar]
- Wang H.W., Nogales E. 2005. Nucleotide-dependent bending flexibility of tubulin regulates microtubule assembly. Nature. 435:911–915 10.1038/nature03606 [DOI] [PMC free article] [PubMed] [Google Scholar]
- Wu Z., Wang H.W., Mu W., Ouyang Z., Nogales E., Xing J. 2009. Simulations of tubulin sheet polymers as possible structural intermediates in microtubule assembly. PLoS ONE. 4:e7291 10.1371/journal.pone.0007291 [DOI] [PMC free article] [PubMed] [Google Scholar]
- Zanic M., Stear J.H., Hyman A.A., Howard J. 2009. EB1 recognizes the nucleotide state of tubulin in the microtubule lattice. PLoS ONE. 4:e7585 10.1371/journal.pone.0007585 [DOI] [PMC free article] [PubMed] [Google Scholar]
Associated Data
This section collects any data citations, data availability statements, or supplementary materials included in this article.