

Abstract
BACKGROUND:
Microscopic colitis (MC) is an umbrella term for collagenous colitis (CC) and lymphocytic colitis (LC). The incidence of these diseases is increasing for unclear reasons.
OBJECTIVE:
To identify factors that may impact diagnosis rates of MC in a North American population.
METHODS:
Population-based pathology and endoscopy databases were searched to identify all cases of MC and the number of lower endoscopy (LE) procedures performed over a five-year period (January 2004 to December 2008) in a catchment area of 1.2 million people. Endoscopist characteristics were compared with diagnostic rates.
RESULTS:
MC incidence increased from 1.68 per 10,000 in 2004, to 2.68 per 10,000 in 2008, with an average annual increase of 12% per year (95% CI 7% to 16%; P<0.0001). The incidence rate of LC increased but the rate of CC remained stable over the study period. Approximately one-half of the cases were probable and one-half were definite based on pathologists’ reports – a proportion that remained stable over time. The number of LEs per population increased by 4.6% annually over the study period (95% CI 2.8% to 6.4%; P<0.0001), and biopsy rates in LE for MC indications (eg, unexplained diarrhea, altered bowel habits) increased over time (3.4% annual increase [95% CI 1.8% to 6.0%]; P<0.001). Endoscopists with an academic practice, gastroenterologists and those with lower annual endoscopy volumes were more likely to make a diagnosis of MC.
CONCLUSION:
The incidence of MC is rising due to increased diagnosis of LC, while CC incidence remains stable. Patients with MC symptoms have stable endoscopy rates but are being biopsied more often. Physician training, practice type and endoscopy volume impact the diagnostic rates of MC.
Keywords: Biopsy, Clinical practice, Collagenous colitis, Colonoscopy, Diagnosis, Diarrhea, Incidence, Lymphocytic colitis
Abstract
HISTORIQUE :
La colite microscopique (CM) est un terme parapluie pour désigner la colite collagène (CC) et la colite lymphocytaire (CL). L’incidence de ces maladies augmente pour des raisons qui ne sont pas claires.
OBJECTIF :
Déterminer les facteurs qui peuvent influer sur le taux de diagnostics de CM au sein de la population nord-américaine.
MÉTHODOLOGIE :
Les chercheurs ont effectué des recherches dans les bases de données sur les pathologies et les endoscopies en population pour déterminer tous les cas de CM et le nombre d’endoscopies basses (EB) effectuées sur une période de cinq ans (janvier 2004 à décembre 2008) dans une circonscription hospitalière de 1,2 million de personnes. Ils ont comparé les caractéristiques des endoscopistes avec le taux de diagnostics.
RÉSULTATS :
L’incidence de CM est passée de 1,68 cas sur 10 000 habitants en 2004 à 2,68 cas sur 10 000 habitants en 2008, pour une augmentation annuelle moyenne de 12 % (95 % IC 7 % à 16 %; P<0,0001). Le taux d’incidence de CL a augmenté, mais celui de CC est demeuré stable pendant la durée de l’étude. Environ la moitié des cas était probable et la moitié, définie d’après les rapports des pathologistes, et cette proportion est demeurée stable au fil du temps. Le nombre d’EB a augmenté de 4,6 % annuellement pendant la durée de l’étude (95 % IC 2,8 % à 6,4 %; P<0,0001), et le taux de biopsie par EB pour des indications de CM (p. ex., diarrhée inexpliquée, habitudes intestinales altérées) s’est accru au fil du temps (augmentation annuelle de 3,4 % [95 % IC 1,8 % à 6,0 %]; P<0,001). Les endoscopistes ayant une pratique universitaire, les gastroentérologues et ceux dont les volumes d’endoscopie annuels étaient moins élevés étaient plus susceptibles de poser un diagnostic de CM.
CONCLUSION :
L’incidence de CM augmente en raison du nombre plus élevé de diagnostics de CL, tandis que l’incidence de CC demeure stable. Les patients ayant des symptômes de CM présentent des taux d’endoscopie stables, mais subissent plus de biopsies. La formation des médecins, le type de pratique et le volume d’endoscopies influent sur le taux de diagnostics de CM.
Microscopic colitis (MC) is an umbrella term for a group of inflammatory diseases of the colon that include lymphocytic colitis (LC) and collagenous colitis (CC). Among other symptoms, MC typically causes watery diarrhea. On investigation, patients have a normal colon endoscopically; however, histological assessment reveals inflammatory changes (1). While both LC and CC have increased numbers of intraepithelial lymphocytes (IEL), a thickened collagen band on the basement membrane of the colonic epithelium is seen in CC. It is unclear whether the two subtypes represent a spectrum of the same disorder or two distinct disorders with varying pathophysiology. There are several known risk factors associated with MC, including celiac disease, other autoimmune diseases, female sex, older age, smoking and some common medications (1–5).
Population-based studies suggest that the incidence of MC is rising substantially. In Olmsted County, Minnesota (USA), MC incidence increased from 4.3 per 100,000 from 1985 to 1997, to 19.7 per 100,000 from 1998 to 2001 (6). The authors believed that this was not likely due to changing histological interpretation over time (6). Similarly, studies from Örebro, Sweden, reported that the annual incidence of CC increased from 0.8 per 100,000 between 1984 and 1988 (7), to 3.7 per 100,000 between 1993 and 1995, to 6.1 per 100,000 between 1996 and 1998, with a similar trend for LC (8). Recent data from Spain showed an increased CC incidence rate but stable LC incidence between 2004 and 2008 versus 1993 to 1977 (9). In Calgary (Alberta), our group previously reported an annual MC incidence rate of 10.0 per 100,000 person-years over the period between 2002 and 2004 (1).
The underlying causes for the increasing incidence of MC are unknown. Because formulation of an MC diagnosis is not based on overt endoscopic findings, it requires suggestive clinical symptoms and relevant findings on biopsy. Clearly, diagnostic factors, such as increased availability of endoscopy and increased biopsy rates, may have contributed to the increase. Similarly, pathologists may appreciate a pattern or gestalt of MC on a biopsy that may not completely meet standard histological criteria for the disorder but may suggest its presence. Finally, increased awareness of MC over time may contribute to increased diagnosis.
We hypothesized that the apparent incidence of MC is increasing over time and our goal was to assess possible factors that may explain this rise in incidence in the community. Specifically, we analyzed two dimensions of the diagnosis pathway for MC: time trends of endoscopic biopsy rates (Are endoscopists looking more often?) and pathologist assessments of biopsies (Are pathologists diagnosing more often?).
METHODS
Patient population
The Calgary Health Region (CHR) provides all medical and surgical care for an area that includes the city of Calgary and surrounding rural areas, with a population of 1,238,959 in 2007 (10). The ethnic makeup of the CHR includes approximately 80% Caucasian, 14% Asian and 3% Native populations, with the remainder representing various other ethnicities (11). Only patients requiring liver, heart and/or lung transplantations are referred outside the region, but their pre- and post-transplantation care occurs within the region. The CHR is the sole provider of health care and pathology services to this population.
Endoscopy database
In the region, most colonoscopies and flexible sigmoidoscopies are performed at four endoscopy suites: one located in an academic site at the university hospital, two located at two community hospitals and one site located at the children’s hospital. All endoscopy reports on inpatient and outpatient procedures from these sites are linked to a central searchable database (Endopro, Pentax, USA). Although all endoscopies performed at these hospital-based sites are captured by the Endopro database and are analyzable for summary statistics, a small number of endoscopists do not use Endopro for completion of their reports. For those who use Endopro for reporting, each report contains required-entry data on indication for endoscopy from a drop-down menu, and user-optional data on whether biopsies were taken. Over the time period of the study, the indication for endoscopy was available for 83% of lower endoscopies (LEs, defined as colonoscopy and flexible sigmoidoscopy) reported on this particular Endopro system.
In the CHR, some LEs are not captured. Three small towns outside of Calgary each have a single endoscopist performing endoscopy in the local hospital. Four private practice endoscopists in Calgary also perform a small number of flexible sigmoidoscopies in their offices, generally fewer than 10 per week. These four endoscopists perform the majority of their endoscopies in one of the hospital-based endoscopy suites. The proportion of uncaptured LEs was small compared with the large numbers of captured LEs performed annually in the region. Before 2008, there were no separate ambulatory endoscopy centres in the CHR. In 2008, a university-affiliated colon cancer screening centre that only provides screening colonoscopy was opened. This centre performed 4454 colonoscopies in 2008. Because patients with any gastrointestinal symptoms or alarm features are not assessed in this facility, and only visually abnormal findings are biopsied (eg, polyps), these endoscopies were not included in any part of the present study’s calculations.
Histopathology database
Calgary Laboratory Services is the exclusive provider of histopathological specimen processing and pathology services for the CHR. All colonic mucosal biopsies taken in the CHR are processed by this provider, regardless of the location of the endoscopic procedure (ie, hospital or office). All histopathology diagnoses are entered into a centralized searchable database that allows corroboration of patient, endoscopist and pathologist data in addition to diagnosis.
Protocol
All residents of the CHR with a new histopathological diagnosis of MC, LC or CC between January 1, 2004, and December 31, 2008, were identified using the pathology database of Calgary Laboratory Services. The cases of newly diagnosed MC were identified by searching diagnosis fields using the following key words: “microscopic colitis”, “lymphocytic colitis” or “collagenous colitis”. Where the diagnosis was MC without mention of collagen deposition, it was counted as LC. Results were filtered to remove duplicate entries. Prevalent cases were excluded (ie, for cases in which the same patient had more than one diagnostic pathology report for MC, only the first was counted for incidence calculations). No information on patient medication use was available.
Pathologist assessments
The diagnoses of CC and LC were based on published histopathological criteria (7,12–14). If a CC or LC diagnosis was conclusive, or if the criteria in the pathology diagnostic report were listed and met, the case was counted as definite MC. If the biopsy findings were reported as consistent with, suggestive of, or suspicious for a diagnosis of MC, LC or CC, it was counted as probable MC. Cases were not included if any other disease state was presented in the differential diagnosis for colonic inflammation in the pathology report. The number of biopsy cases in which MC, LC or CC were specifically ruled out was also recorded. No case ascertainment was performed.
Endoscopist factors
Overall numbers of LE (defined as colonoscopy and flexible sigmoidoscopy) were obtained for each year. To capture the endoscopies that were performed in patients who experienced symptoms that may be consistent with MC, endoscopies with the indication of ‘diarrhea, unexplained’, ‘altered bowel habits’ or ‘irritable bowel syndrome’ were recorded. This subgroup of endoscopies was defined as ‘MC-specific indications’. The proportion of cases in which biopsies were taken in the MC-specific indication group was also recorded. Numbers of LE per endoscopist were obtained, and diagnosis rates were calculated by dividing the number of MC cases found by the endoscopist by the number of LEs they performed over the study period, then multiplied by 1000.
Information on endoscopist factors was collected, including training (gastroenterologist, surgeon, other), academic practice (defined as having a full-time or part-time academic appointment), time in practice (less than or greater than five years), average number of LEs performed per year and sex.
Statistical analysis
Crude incidence rates were calculated by dividing the number of new cases of MC by the annual population of the CHR during the study period from 2004 to 2008. The population size was obtained from the Alberta Population Health Registry for 2004 to 2007 (10,15–17), which showed a stable linear growth during that period. The population in 2008 was estimated by averaging the annual population increases for the previous three years and adding it to the 2007 population. Incidence rates were age- and sex-standardized to the 2001 Canadian census population (11). Definite and probable CC and LC case frequencies were plotted separately for qualitative comparison.
Independent variables affecting MC counts (age, sex, time trend according to year) as well as time trend according to year for LC and CC subtypes were assessed by Poisson regression analysis with logarithmic link function using the GENMOD procedure (SAS version 9.1, SAS Institute Inc, USA) on raw (ie, unstandardized) data. Time trends according to year for number of LEs, endoscopy indication and biopsy rates were analyzed using similar Poisson regression, with scaling for overdispersion as required. Rate ratios and 95% CIs were calculated as the exponent of the model logarithmic parameter estimates. Analysis of endoscopist factors possibly related to MC diagnostic rates were assessed using multivariate linear regression (SPSS version 16.0, IBM Corporation, USA), with MC diagnoses per 1000 LE or MC diagnoses per 1000 MC-specific indication LE as the dependent variable in separate analyses. Endoscopists were included only if they had performed at least 100 LEs in at least one of the study years. Pediatric gastroenterologists were also excluded due to the rarity of MC diagnoses in that patient population. All regression variables were dichotomous, except for endoscopies per year, which was modelled as a continuous variable. P<0.05 was considered to be statistically significant. The present study was approved by the Conjoint Health Research Ethics Board, University of Calgary, Calgary, Alberta.
RESULTS
Pathologist factors and MC incidence
A total of 1106 distinct MC cases were identified by 50 pathologists over the study period, 35 of whom made at least 10 diagnoses. For both LC and CC, the frequency of probable diagnoses was just as common as definite diagnoses over the study period (Figure 1). Considering both probable and definite results as cases, the apparent population incidence of MC increased by 12% annually (95% CI 7% to 16%) (Table 1), with age- and sex-standardized incidences of 1.68 per 10,000 in 2004, to 2.68 per 10,000 in 2008 (Figure 2). The incidence of MC was significantly higher in women and older patients (Table 1), with increases over time observed in both older men and women (Figure 2). The increase in MC incidence was driven by increases in LC diagnoses (age- and sex-standardized incidence 1.01 per 10,000 in 2004, to 1.89 per 10,000 in 2008), whereas the incidence of CC remained relatively stable (age- and sex-standardized incidence 0.67 per 10,000 in 2004 to 0.79 per 10,000 in 2008) and its time trend was not significant (Table 1). Biopsy reports in which MC was ruled out were also common (Figure 1), but its time trend was not significant (Table 1).
Figure 1).

Case frequency of lymphocytic colitis (LC) (left panel) and collagenous colitis (CC) (right panel) identified over the study period, with definite cases shown in dark grey and probable cases shown in light grey. The dotted line represents the frequency of biopsies in which microscopic colitis was ruled out, and is shown in both plots for comparison
TABLE 1.
Time and demographic factors affecting microscopic colitis incidence rates in the study region from 2004 to 2008
| Variable | Rate ratio (95% CI) | P |
|---|---|---|
| All microscopic colitis | ||
| Yearly change (annual trend) | 1.12 (1.07–1.16) | <0.0001 |
| Female | 2.92 (2.54–3.35) | <0.0001* |
| Age 30 to 59 years | 6.94 (5.38–8.97) | <0.0001† |
| Age ≥60 years | 22.45 (17.38–29.01) | <0.0001† |
| Lymphocytic colitis only (annual trend) | 1.10 (1.04–1.16) | 0.001 |
| Collagenous colitis only (annual trend) | 1.06 (0.98–1.14) | 0.129 |
| Microscopic colitis ruled out | 0.98 (0.94–1.02) | 0.274 |
Versus male;
Versus age group 0 to 29 years
Figure 2).
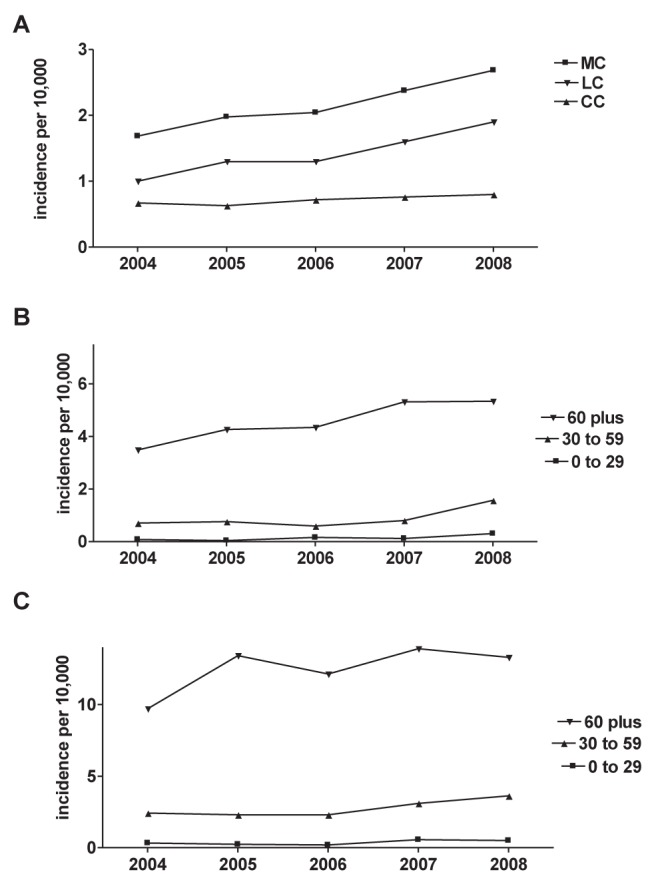
A Population incidence of all microscopic colitis (MC), lymphocytic colitis (LC) and collagenous colitis (CC) in the Calgary Health Region according to year. B Incidence in males according to age group. C Incidence in females according to age group
LE rates
Adult gastroenterologists and colorectal surgeons in the region accounted for more than 96% of the endoscopies in the Endopro system every year and 97% of the regional MC diagnoses during the study period (data not shown). The overall number of LEs performed in the CHR increased continuously at 4.6% per year throughout the study period, both in absolute terms and on a per-population basis (Table 2).
TABLE 2.
Time trends in lower endoscopy and diagnosis of microscopic colitis, Calgary Health Region, 2004 to 2008
| Variable | Year | Annual trend (95% CI) | P (for trend) | ||||
|---|---|---|---|---|---|---|---|
|
| |||||||
| 2004 | 2005 | 2006 | 2007 | 2008 | |||
| Lower endoscopies, n | 16,406 | 17,021 | 19,388 | 20,689 | 21,445 | ||
| Lower endoscopies per 1000 population, n | 14.4 | 14.6 | 16.2 | 16.7 | 16.9 | 1.046 (1.028–1.064) | <0.0001 |
| Microscopic colitis per 1000 lower endoscopies, n | 9.0 | 10.6 | 10.3 | 11.4 | 12.9 | 1.084 (1.052–1.118) | <0.0001 |
| Microscopic colitis-specific indication, % of lower endoscopies | 7.9 | 7.0 | 8.0 | 8.2 | 7.3 | 1.001 (0.958–1.045) | 0.9797 |
| Biopsy rate in micoscopic colitis-specific indication, % | 58.0 | 56.0 | 59.0 | 64.0 | 65.3 | 1.038 (1.018–1.060) | 0.0003 |
However, the proportion of all LEs performed for MC-specific indications remained stable over the study period. Conversely, biopsy rates increased by 3.4% per year in this group. Taken together, this suggests that patients with these symptoms were not undergoing endoscopic investigation more often, but were more likely to have biopsies taken during their endoscopy. The number of MC diagnoses per 1000 LEs increased significantly at a rate of 8.4% annually between 2004 and 2008 (Table 2).
Endoscopist factors
During the study period, 50 endoscopists who had hospital privileges for LE in the adult gastroenterology or surgery departments for at least one year, and whose endoscopies were captured on the city-wide endoscopy database were identified. Information regarding their demographics and practice characteristics are presented in Table 3. Multivariate regression analysis of the variables in Table 3 showed that gastroenterologists and those with an academic practice were much more likely than surgeons or community practitioners to make a diagnosis of MC; 18 and 11 more MC cases were diagnosed per 1000 LEs, respectively (Table 4). Higher annual endoscopy volume was inversely associated with MC diagnosis, with a regression estimate of 13 fewer MC cases diagnosed for each 1000 LEs more performed each year. Time in practice or endoscopist sex did not impact the rates of MC diagnosis.
TABLE 3.
Unadjusted demographic and diagnostic profiles of endoscopists in the study region over 2004 to 2008
| Variable | n (%) | LE per year* | MC per 1000 LE* | MC per 1000 LE for MC indication*† |
|---|---|---|---|---|
| All endoscopists‡ | 50 (100) | 425±37 | 15.9±1.9 | 168.4±20.2 |
| Academic practice | 19 (38) | 255±33 | 25.5±3.2 | 229.4±30.9 |
| Community practice | 31 (62) | 529±48 | 10.1±1.5 | 115.7±21.6 |
| Gastroenterologist | 43 (86) | 432±42 | 18.3±1.9 | 188.8±20.8 |
| Colorectal surgeon | 7 (14) | 384±61 | 1.3±0.6 | 21.1±14.9 |
| Male sex | 40 (80) | 427±41 | 15.1±2.1 | 164.7±24.0 |
| Female sex | 10 (20) | 417±90 | 19.4±3.7 | 186.1±24.7 |
| In practice ≤5 years | 15 (30) | 359±65 | 20.1±3.5 | 178.9±29.9 |
| In practice >5 years | 35 (70) | 453±45 | 14.1±2.2 | 162.9±26.9 |
Data presented as mean ± SE unless otherwise indicated;
n=41 for this column;
Includes adult gastroenterologists and colorectal surgeons only. Pediatric endoscopists and locum endoscopists were excluded. All endoscopists performed >100 lower endoscopies in at least one year of the study period. LE Lower endoscopies; MC Microscopic colitis
TABLE 4.
Endoscopist factors predicting microscopic colitis diagnoses per 1000 lower endoscopies
| Endoscopist variable | Regression coefficient | SE | Beta | P |
|---|---|---|---|---|
| Academic practice | 11.3 | 2.9 | 0.34 | <0.001 |
| Gastroenterologist | 18.6 | 3.4 | 0.84 | <0.001 |
| Male sex | 0.9 | 2.7 | 0.04 | 0.743 |
| In practice ≤5 years | 0.4 | 3.1 | 0.01 | 0.906 |
| Lower endoscopies per year | −0.013 | 0.005 | −0.311 | 0.016 |
To determine whether these differences in diagnostic rates were due to differences in endoscopy indication among endoscopists, a second regression analysis was performed with MC cases per 1000 MC-specific indication LEs as the dependent variable (Table 5). For this analysis, nine of 50 endoscopists were excluded because they did not use EndoPro to complete their endoscopy reports and, thus, LE indication data were not available. Similarly, the gastroenterologist/surgeon variable was dropped due to too few surgeons having the required procedure indication data. Again, endoscopists with an academic practice pattern were more likely to make a diagnosis of MC, making 147 more diagnoses per 1000 LEs in which the patient had symptoms suggestive of MC (ie, MC-specific indication) compared with community-based practitioners. Endoscopist sex, time in practice and endoscopy volume were not significant predictors of MC diagnosis in this analysis (Table 5).
TABLE 5.
Gastroenterologist endoscopist factors predicting microscopic colitis diagnoses per 1000 lower endoscopies for microscopic colitis indications
| Endoscopist variable | Regression coefficient | SE | Beta | P |
|---|---|---|---|---|
| Academic practice | 147.1 | 38.8 | 0.47 | 0.001 |
| Male sex | 68.1 | 43.0 | 0.29 | 0.122 |
| In practice ≤5 years | 44.3 | 39.9 | 0.12 | 0.273 |
| Lower endoscopies per year | 0.048 | 0.074 | 0.11 | 0.522 |
DISCUSSION
Over the past 10 years, several studies have reported markedly higher MC incidence rates over time, and most have reported that the incidence of both CC and LC is increasing (1,6,8,18). The present study identified 1106 new cases of MC over a five-year period in a well-defined, single-care provider population, making the present study one of the largest on MC incidence to date. During our five-year study period, the annual apparent incidence of MC increased by 12% annually.
Pathologist factors may play a role in apparent changes in MC incidence estimates. On analysis of the biopsy reports, approximately one-half of the cases were probable, with various degrees of hedging against uncertainty. The proportion of probable to definite cases appeared to be stable over time. Of the definite cases, very few actually reported the specific criteria that were met to make the diagnosis (data not shown). This is not unexpected, and reflects the variability and uncertainty of clinical practice. Although the goal of the present study was not to perform case ascertainment, it is likely that review of the probable cases would have led to a lower incidence estimation in this population.
Our data suggest that the incidence of LC is rising markedly, whereas the incidence of CC has remained relatively stable over the study period. This may reflect the fact that the two diagnoses may, indeed, be different entities with different (unknown) risk factors. The incidence shifts are not likely solely driven by rising biopsy rates and measurement bias because the same rise in incidence would be expected in LC and CC if that was the case. However, pathologist factors may play a role. In addition to inflammation in the lamina propria (consisting mainly of lymphocytes and plasma cells) and epithelial damage, the histopathological diagnosis of CC is more stringent than LC, with an absolute requirement for a thickened collagen layer. However, LC only has requirements for increased numbers of IELs. Although the generally accepted threshold for diagnosis is ≥20 IEL per 100 surface epithelial cells, it is possible that pathologists are using qualitative impressions (ie, gestalt) of an increased number of lymphocytes to make the diagnosis rather than a strictly quantitative approach due to the somewhat arbitrary numerical threshold. One could speculate, however, that clinical information may affect pathologists’ gestalt; for example, information from the endoscopist stating “diarrhea, normal colonoscopy, rule out microscopic colitis” may be more likely to elicit a diagnosis of LC than “normal colonoscopy”, or no information at all. Whether gastroenterologists are specifically asking the pathologists to rule out MC more often and whether this influences the diagnostic yield, is unknown.
Measurement bias due to endoscopist factors has likely played a role in the increasing incidence of MC demonstrated by several groups, which was also apparent in the present study. During the study period, although there was an increase in the number of LEs over time, the proportion of those procedures performed for symptoms suggestive of MC remained stable. However, the biopsy rate in those cases did increase significantly over time. Thus, those with MC symptoms were not more likely to undergo endoscopy over time, but were more likely to undergo biopsy when they underwent an LE. We believe this is likely due to an increased awareness of MC by endoscopists and the need for a biopsy to establish the diagnosis. These local practice changes have corresponded to increased awareness of MC over time through the medical literature and educational programs including residency/fellowship training and continuing medical education events.
Other endoscopist factors were related to MC diagnosis rates. It is not surprising that pediatric gastroenterologists did not diagnose MC in our study (data not shown) because MC is extremely rare in pediatric patients (6–8,19,20). Surgeons also rarely made a diagnosis of MC, which may be due to differences in patient populations compared with gastroenterologists. We were unable to analyze surgeons’ diagnostic rates for MC-specific indications due to lack of data for this group. It remains unexplained as to why diagnostic rates in surgeons are lower, but a previous study clearly showed that surgical trainees receive limited endoscopic training and less specific gastroenterology-related rotations than gastroenterology fellows (21).
MC diagnosis rates were higher when performed by an endoscopist with an academic practice pattern compared with a community/private practice pattern, independently of the number of endoscopic procedures performed annually. This finding also held true when diagnostic rates in symptomatic patients were analyzed specifically, suggesting it was not due to the volume of colon cancer screening endoscopy performed in asymptomatic patients. It should be noted that the regression analyses examined diagnoses over the entire five-year period and did not account for changes in individual endoscopists’ diagnostic rates on a yearly basis.
The present study had several limitations. Individual case review of histology for ascertainment purposes was not performed due to cost and time limitations. Given the large number of probable cases, it is likely that some would not meet formal MC criteria and, thus, the apparent incidence rates would be overestimated. However, the present study was designed primarily to assess systemic reasons behind the increased incidence – as opposed to etiological reasons – and to analyze the apparent epidemic of MC perceived in ‘real life’ clinical practice. While the reported incidence rates in the present study are the highest reported in the literature (2.86 per 10,000 in 2008), they are similar to those from Olmsted County USA (1.97 per 10,000 from 1998 to 2001) (6), and consistent with the increasing secular trend seen worldwide. Furthermore, reporting practices of individual pathologists are varied, and some may be less definitive even when the diagnosis would generally be regarded as certain.
A second limitation of the present study was our inability to accurately link MC diagnoses to the indication of the LE in all cases. Even among endoscopists who used the EndoPro system to generate their reports, not all endoscopists may have consistently used the MC indications to characterize the reason for the endoscopy. This could have led to overestimation of the diagnostic yield of MC-indication LE in the study. However, given that the large majority of endoscopists do use the reporting software and that variability is limited by fixed-choice selections for indication, this was not believed to be a major issue.
Biopsy site and number may also play a role in MC diagnosis rates. It is known that MC can be patchy and, thus, it is important that multiple biopsies are taken. Diagnostic yield may be higher from biopsies taken from the right and transverse colon (22). Unfortunately, an additional limitation of our study is that we were unable to assess the total number of biopsies taken per procedure.
Generally, the true incidence of MC may be increasing, but it is unlikely to be at the rate suggested by the overall rate found in the present study for the reasons described above. The other possible causes for the increasing incidence of MC are unclear. Increased use of medications known to be associated with MC, such as nonsteroidal anti-inflammatory drugs (23) and proton pump inhibitors (24), may be contributing to this increase. The aging North American population and increased incidence of autoimmune disease may also further impact the incidence of MC.
CONCLUSION
The present study was one of the largest to assess the incidence of MC. The apparent incidence of MC is increasing primarily due to increases in the incidence of LC. Although patients with symptoms suggestive of MC did not undergo endoscopy more often, endoscopists were more likely to biopsy these individuals. Endoscopists with formal gastroenterology training, an academic practice pattern and lower endoscopy volumes were more likely to diagnose MC. As would be expected in clinical practice, pathologists diagnosed a substantial proportion of cases as probable, which we speculate may also have contributed to the apparent rise in incidence. Finally, because the underlying etiology of MC is unknown, there are likely other factors impacting the incidence of MC. We believe that increasing awareness of MC through targeted educational activities may further increase diagnostic rates and ultimately enhance patient care.
Footnotes
DISCLOSURES: The authors have no financial disclosures or conflicts of interest to declare.
REFERENCES
- 1.Williams JJ, Kaplan GG, Makhija S, et al. Microscopic colitis-defining incidence rates and risk factors: A population-based study. Clin Gastroenterol Hepatol. 2008;6:35–40. doi: 10.1016/j.cgh.2007.10.031. [DOI] [PubMed] [Google Scholar]
- 2.Freeman HJ. Collagenous colitis as the presenting feature of biopsy-defined celiac disease. J Clin Gastroenterol. 2004;38:664–8. doi: 10.1097/01.mcg.0000135363.12794.2b. [DOI] [PubMed] [Google Scholar]
- 3.Koskela RM, Niemela SE, Karttunen TJ, Lehtola JK. Clinical characteristics of collagenous and lymphocytic colitis. Scand J Gastroenterol. 2004;39:837–45. doi: 10.1080/00365520410006468. [DOI] [PubMed] [Google Scholar]
- 4.Matteoni CA, Goldblum JR, Wang N, Brzezinski A, Achkar E, Soffer EE. Celiac disease is highly prevalent in lymphocytic colitis. J Clin Gastroenterol. 2001;32:225–7. doi: 10.1097/00004836-200103000-00009. [DOI] [PubMed] [Google Scholar]
- 5.Pardi DS, Ramnath VR, Loftus EV, Jr, Tremaine WJ, Sandborn WJ. Lymphocytic colitis: Clinical features, treatment, and outcomes. Am J Gastroenterol. 2002;97:2829–33. doi: 10.1111/j.1572-0241.2002.07030.x. [DOI] [PubMed] [Google Scholar]
- 6.Pardi DS, Loftus EV, Jr, Smyrk TC, et al. The epidemiology of microscopic colitis: A population based study in Olmsted County, Minnesota. Gut. 2007;56:504–8. doi: 10.1136/gut.2006.105890. [DOI] [PMC free article] [PubMed] [Google Scholar]
- 7.Bohr J, Tysk C, Eriksson S, Abrahamsson H, Jarnerot G. Collagenous colitis: A retrospective study of clinical presentation and treatment in 163 patients. Gut. 1996;39:846–51. doi: 10.1136/gut.39.6.846. [DOI] [PMC free article] [PubMed] [Google Scholar]
- 8.Olesen M, Eriksson S, Bohr J, Jarnerot G, Tysk C. Microscopic colitis: A common diarrhoeal disease. An epidemiological study in Orebro, Sweden, 1993–1998. Gut. 2004;53:346–50. doi: 10.1136/gut.2003.014431. [DOI] [PMC free article] [PubMed] [Google Scholar]
- 9.Fernandez-Banares F, Salas A, Esteve M, et al. Evolution of the incidence of collagenous colitis and lymphocytic colitis in Terrassa, Spain: A population-based study. Inflamm Bowel Dis. 2011;17:1015–20. doi: 10.1002/ibd.21438. [DOI] [PubMed] [Google Scholar]
- 10.Alberta Health and Wellness. Alberta Health Care Insurance Plan Statistical Supplement 2006/2007 (page 65). < www.health.alberta.ca/documents/AHCIP-Stats-Supplement-07.pdf> (Accesed August 5, 2011)
- 11.Statistics Canada. 2001. Census of Canada, Calgary, Alberta. < www12.statcan.ca/english/profil01/CP01/Details/Page.cfm?Lang=E&Geo1=CMA&Code1=825__&Geo2=PR&Code2=48&Data=Count&SearchText=calgary&SearchType=Begins&SearchPR=01&B1=All&Custom=> (Accessed August 5, 2011). [Google Scholar]
- 12.Bohr J, Tysk C, Eriksson S, Jarnerot G. Collagenous colitis in Orebro, Sweden, an epidemiological study 1984–1993. Gut. 1995;37:394–7. doi: 10.1136/gut.37.3.394. [DOI] [PMC free article] [PubMed] [Google Scholar]
- 13.Warren BF, Edwards CM, Travis SP. ‘Microscopic colitis’: Classification and terminology. Histopathology. 2002;40:374–6. doi: 10.1046/j.1365-2559.2002.01341.x. [DOI] [PubMed] [Google Scholar]
- 14.Chang F, Deere H, Vu C. Atypical forms of microscopic colitis: Morphological features and review of the literature. Adv Anat Pathol. 2005;12:203–11. doi: 10.1097/01.pap.0000175115.63165.6b. [DOI] [PubMed] [Google Scholar]
- 15.Alberta Health and Wellness. Alberta Health Care Insurance Plan Statistical Supplement 2003/2004 (page 66). < www.health.alberta.ca/documents/AHCIP-Stats-Supplement-04.pdf> (Accesed August 5, 2011)
- 16.Alberta Health and Wellness. Alberta Health Care Insurance Plan Statistical Supplement 2004/2005 (page 59). < www.health.alberta.ca/documents/AHCIP-Stats-Supplement-05.pdf> (Accesed August 5, 2011).
- 17.Alberta Health and Wellness. Alberta Health Care Insurance Plan Statistical Supplement 2005/2006 (page 62). < www.health.alberta.ca/documents/AHCIP-Stats-Supplement-06.pdf> (Accesed August 5, 2011)
- 18.Thijs WJ, van Baarlen J, Kleibeuker JH, Kolkman JJ. Microscopic colitis: Prevalence and distribution throughout the colon in patients with chronic diarrhoea. Neth J Med. 2005;63:137–40. [PubMed] [Google Scholar]
- 19.Fernandez-Banares F, Salas A, Forne M, Esteve M, Espinos J, Viver JM. Incidence of collagenous and lymphocytic colitis: A 5-year population-based study. Am J Gastroenterol. 1999;94:418–23. doi: 10.1111/j.1572-0241.1999.00870.x. [DOI] [PubMed] [Google Scholar]
- 20.Olesen M, Eriksson S, Bohr J, Jarnerot G, Tysk C. Lymphocytic colitis: A retrospective clinical study of 199 Swedish patients. Gut. 2004;53:536–41. doi: 10.1136/gut.2003.023440. [DOI] [PMC free article] [PubMed] [Google Scholar]
- 21.Asfaha S, Alqahtani S, Hilsden RJ, MacLean AR, Beck PL. Assessment of endoscopic training of general surgery residents in a North American health region. Gastrointest Endosc. 2008;68:1056–62. doi: 10.1016/j.gie.2008.03.1088. [DOI] [PubMed] [Google Scholar]
- 22.Surawicz CM. Collating collagenous colitis cases. Am J Gastroenterol. 2000;95:307–8. doi: 10.1111/j.1572-0241.2000.01739.x. [DOI] [PubMed] [Google Scholar]
- 23.Fernandez-Banares F, Esteve M, Espinos JC, et al. Drug consumption and the risk of microscopic colitis. Am J Gastroenterol. 2007;102:324–30. doi: 10.1111/j.1572-0241.2006.00902.x. [DOI] [PubMed] [Google Scholar]
- 24.Keszthelyi D, Jansen SV, Schouten GA, et al. Proton pump inhibitor use is associated with an increased risk for microscopic colitis: A case-control study. Aliment Pharmacol Ther. 2010;32:1124–8. doi: 10.1111/j.1365-2036.2010.04453.x. [DOI] [PubMed] [Google Scholar]