

Abstract
Effects of covalent intramolecular bonds, either native disulfide bridges or chemical crosslinks, on ESI supercharging of proteins from aqueous solutions were investigated. Chemically modifying cytochrome c with up to seven crosslinks or ubiquitin with up to two crosslinks did not affect the average or maximum charge states of these proteins in the absence of m-nitrobenzyl alcohol (m-NBA), but the extent of supercharging induced by m-NBA increased with decreasing numbers of crosslinks. For the model random coil polypeptide reduced/alkylated RNase A, a decrease in charging with increasing m-NBA concentration attributable to reduced surface tension of the ESI droplet was observed, whereas native RNase A electrosprayed from these same solutions exhibited enhanced charging. The inverse relationship between the extent of supercharging and the number of intramolecular crosslinks for folded proteins, as well as the absence of supercharging for proteins that are random coils in aqueous solution, indicate that conformational restrictions induced by the crosslinks reduce the extent of supercharging. These results provide additional evidence that protein and protein complex supercharging from aqueous solution is primarily due to partial or significant unfolding that occurs as a result of chemical and/or thermal denaturation induced by the supercharging reagent late in the ESI droplet lifetime.
Introduction
The ability to produce multiply charged ions of large molecules directly from aqueous solution with electrospray ionization has many advantages for the analysis of proteins and protein complexes using mass spectrometry (MS). A key advantage is that multiple charging reduces the analyte m/z ratio into a range where the performance of many measurements, including accurate mass and tandem MS, can be excellent. Many factors can affect the extent of protein charging observed in ESI, including analyte conformation,1-4 solvent and analyte basicity,5-7 solvent surface tension,8-10 and instrument parameters.11-14 Charge states can be lowered by using ion-molecule6, 7 or ion-anion15, 16 reactions, which can reduce mass spectral complexity of mixtures by reducing the number of peaks observed in a mass spectrum, but can require mass analyzers with high m/z capability. In contrast, there are relatively few methods to systematically increase analyte charge, which can be especially advantageous for MS/MS experiments or for instruments, such as orbitrap or Fourier transform ion cyclotron resonance mass spectrometers, where sensitivity increases with ion charge. Unfolded proteins can charge to a significantly greater extent compared to the same protein in a globular or a native state.1-3 Multiple charge state distributions of the same protein or protein complex can often be observed in ESI mass spectra, and information about different conformations that coexist in solution has been inferred from modeling these distributions.4 McLuckey and coworkers recently demonstrated that the charge states of proteins formed by ESI from purely aqueous solutions can be significantly increased by introducing acid vapor into the counter-current drying gas of an ESI interface, resulting in a lowering of the pH in the ESI droplet and concomitant acid denaturation of the protein.17
Addition of small amounts of some low-volatility “supercharging” reagents to ESI solutions can also significantly increase ion charge states.8-10, 18-29 For ions formed from acidified solutions containing both water and organic solvents where the protein is largely unfolded, higher charging is predominantly the result of increased surface tension of the ESI droplet that occurs when the concentration of the supercharging reagent in the droplet increases as higher volatility solvents with lower surface tension preferentially evaporate.8-10, 29 The maximum number of charges, zRe, which a spherical droplet can hold is related to surface tension, γ, by eq. 1;
| (eq. 1) |
where zR is the unit charge limit, e is the elementary charge, ε0 is the permittivity of the surrounding medium, and R is the droplet radius.30 In the absence of any competing factors, the charge on an ion should be related to the charge density on the droplet surface.10, 31
For ions formed from purely aqueous or buffered aqueous solution, conformational changes induced by the supercharging reagent in the late stages of ESI droplet evaporation appear to be the major factor in increased charging observed for proteins,22-24 although this mechanism remains controversial.26-28 As the charged aqueous droplets containing a supercharging reagent evaporate, the concentration of the supercharging reagent increases owing to its high boiling point compared to water. For example, the boiling point of m-NBA, a commonly used supercharging reagent, is 177 °C at 3 Torr,32 from which a value of ~405 °C at 760 Torr can be estimated.33 The rapid increase in supercharging reagent concentration in the later stages of the ESI droplet lifespan has two complementary effects. First, the lifetime of the ESI droplet is extended34 due to the lower evaporation rate compared to a purely aqueous droplet without the reagent. This can result in more collisional activation and less evaporative cooling, causing an increase in the droplet temperature compared to droplets without the reagent. Higher droplet temperatures can destabilize the native form of proteins due to thermal denaturation, and even partial unfolding of the protein can cause increased charging.22 Second, the supercharging reagents can act as chemical denaturants, which increasingly destabilize the native protein structure as the concentration of the reagent increases during droplet evaporation.23, 24 Sulfolane, a reagent found by Loo and coworkers to be effective at supercharging proteins and protein complexes from aqueous solutions,26 is a chemical denaturant, destabilizing the native structure of myoglobin by 1.5 kcal/mol/M, making sulfolane ~30% as effective at destabilizing this protein as guanidinium chloride.23
Results from hydrogen/deuterium exchange24 and circular dichroism (CD) experiments23 show that native protein conformations are essentially unaffected at the low reagent concentrations typically used in the solutions prior to ESI. Similarly, solution pH is essentially unaffected by addition of up to 1.0% m-NBA.25 However, as the concentration of the reagent rapidly increases during droplet evaporation, the native structures of proteins are increasingly destabilized, resulting in conformational changes and concomitant higher charging.23, 24 The increased droplet temperature and reagent concentration effects are complementary in that the denaturing strength of sulfolane increases with increasing solution temperature.23 The chemical and/or thermal denaturation caused by the supercharging reagent in the ESI droplet is analogous to McLuckey and coworkers’ acid-induced denaturation in the ESI droplet, in which protein unfolding occurs in the acidified droplet on the timescale of droplet evaporation.17
In contrast to results for proteins, addition of small amounts of m-NBA to aqueous solutions containing an amine-functionalized dendrimer, poly(propyleneimine) (DAB-16), results in a lowering of the charge states.10 Because DAB-16 cannot undergo significant conformational changes,35 the lowering of the charge state distribution for this ion can be attributed to a lowering of the surface tension of a droplet enhanced in m-NBA (50 ± 5 mN/m)9 compared to a pure aqueous droplet (72 mN/m at 25 °C).32 Thus, for proteins, the charge enhancement due to unfolding can overcome the charge-lowering effects of reduced droplet surface tension, both caused by the increase in supercharging reagent concentration in the aqueous ESI droplets.
The effects of supercharging reagents on protein ion conformations have been investigated using ion mobility. Relative extents of protein unfolding induced by supercharging were measured using traveling wave ion mobility spectrometry for both ubiquitin24 and myoglobin.23 Arrival time distributions show that the higher charge state ions that are formed by supercharging are significantly more unfolded than lower charge state ions. Recently, Hogan et al. measured the mobilities of monomers and homooligomers of phosphorylase B ions formed from aqueous solutions containing the charge-reducing reagent triethylammonium formate (TEAF) and the supercharging reagent sulfolane using a differential mobility analyzer-mass spectrometer.27 An average decrease in mobility of ~8.8%, corresponding to increased collision cross sections, was measured for common-charge-state ions formed with sulfolane compared to when sulfolane was absent.27 The authors concluded that the decrease in mobility was likely due to adduction or “trapping” of sulfolane in the protein interior, although no change in mass was measured.27 An alternative explanation for these results is that partial unfolding occurred.
Here, the relationship between protein conformational flexibility and the extent of supercharging from purely aqueous solutions is investigated using proteins that are conformationally restricted either with various numbers of native disulfide bonds or various numbers of covalent chemical crosslinks. The extent of supercharging has an inverse correlation with the number of crosslinks, which provides additional support for our hypothesis that protein conformational changes caused by chemical and/or thermal denaturation in the electrospray droplet are the primary cause of supercharging proteins and protein complexes from purely aqueous solutions. These results also suggest that the extent of supercharging is likely to be protein-dependent and may be affected by the protein stability and radius of gyration of the unfolded states of the protein in solution.
Experimental
All mass spectra were acquired using a LTQ-mass spectrometer (Thermo Fisher Scientific, Waltham, MA, USA) equipped with a nanoelectrospray source. Ions were formed using nanoelectrospray emitters prepared by pulling borosilicate capillaries (1.0 mm o.d./0.78 mm i.d., Sutter Instruments, Novato, CA, USA) to a tip i.d. of ~1 μm with a Flaming/Brown micropipette puller (Model P-87, Sutter Instruments, Novato, CA, USA). A platinum wire (0.127 mm diameter, Sigma, St. Louis, MO, USA) was inserted into the nanoelectrospray emitter so that contact was made with the solution, and ESI was initiated and maintained by applying 0.6 – 1.2 kV to the wire relative to instrument ground. Solution heating was done using a cylindrical aluminum collar placed around the capillary which was resistively heated with NiCr wire.22 The temperature of the heating collar was monitored continuously with a thermocouple and temperature meter (Omega, Stamford, CT, USA). All proteins and m-NBA were purchased from Sigma-Aldrich (St. Louis, MO, USA) and used without additional purification.
Reduced/alkylated RNase A and phospholipase A2 were prepared by first denaturing the proteins in 6 M guanidine hydrochloride (MP Biomedicals, Solon, OH, USA), 200 mM ammonium acetate solution, and then reacting in the dark at ambient temperature with a ~100× molar excess of dithiothreitol (DTT) and either iodoacetamide or iodoacetic acid (Sigma-Aldrich, St. Louis, MO, USA) for ~1.5 hours. The solutions were dialyzed into 20 mM ammonium bicarbonate and either flash-frozen in liquid nitrogen before being stored at –80 °C or they were used immediately for analysis.
Cytochrome c and ubiquitin were crosslinked using suberic acid, bis(3-sulfo-N-hydroxysuccinimide ester) (BS3), from 1.50 mL solutions that were 10 μM in protein, 90 mM in potassium phosphate and 0.3 M in sodium chloride (pH 7.6). To initiate the reaction, 30 μL of a freshly made 5 mM solution of BS3 in extra dry dimethyl sulfoxide (DMSO; Acros Organics, Waltham, MA, USA) was added. The mixture was left to react at room temperature for 30 minutes, at which point the reaction was quenched with 100 μL of 100 mM ammonium acetate. The reaction mixture was dialyzed into 100 mM ammonium acetate (pH 7.0). For cytochrome c, crosslinking was also done with 1,3-diformyl-5-ethynylbenzene (DEB)36 from a 98 μL solution that was 18 μM in protein and 100 mM in HEPES (pH 8.0), equilibrated at 37 °C with 10 mM DEB (added from 10× stock solution in DMSO). Sodium cyanoborohydride (Acros Organics, Waltham, MA, USA) was added to a final concentration of 20 mM (from 50× stock in 0.01 N NaOH), and the sample was incubated for 1 hour at 37 °C. Crosslinking was quenched and the buffer exchanged for 100 mM ammonium acetate (pH 7.0) by applying the sample to a gel-filtration spin column that had been equilibrated into this buffer (ZebaSpin, 7 kDa MWCO, Thermo Scientific, Waltham, MA, USA).
Results and Discussion
Crosslinks and Supercharging
The small homobifunctional crosslinking reagent BS3 can covalently bind surface-accessible amino groups within ~11.4 Å of its end-to-end distance.37 The extent to which a crosslinked protein can unfold is limited both by the number of crosslinks and the locations where they are formed. This approach to limiting protein conformational flexibility was used previously to investigate how conformational changes affect asymmetric charge partitioning in gas-phase dissociation of protein-protein complexes.38 Nanoelectrospray mass spectra of 10 μM BS3-crosslinked cytochrome c in 100 mM ammonium acetate (pH 7.0) solution containing 0 to 1.5% m-NBA are shown in Figure 1. Multiple peaks corresponding to between two and seven crosslinks, as well as multiples of derivatized protein where only one end of the crosslinking reagent is attached and the other end remains unreacted (“dead-ends”), are observed for each charge state. The two native covalent thioether crosslinks to the heme group39 are included in the total number of crosslinks for determining how the average and maximum charge vary with the number of crosslinks. Dead-end crosslinks are not included because they do not likely restrict protein unfolding. It is notable that the observed trends in charging and the extent of charging as a function of m-NBA concentration for molecules with a single dead-end crosslink are similar to the corresponding variant with the same number of complete crosslinks but without a dead-end crosslink, indicating that converting the primary amine of a lysine side chain or the N-terminus to a less basic amide does not significantly affect the trends observed.
Figure 1.

Nanoelectrospray mass spectra of 10 μM BS<sup>3</sup>-crosslinked cytochrome <i>c</i> in 200 mM ammonium acetate(pH 7.2) solution containing 0 to 1.5% <i>m</i>-NBA. For each charge state, there are peaks corresponding to between two and seven crosslinks, with different numbers of dead-end crosslinks (inset). Only intact crosslinks were included in average and maximum charge calculations.
Without m-NBA, neither the average nor maximum charge states of cytochrome c with between two and seven crosslinks depend significantly on the number of crosslinks (Figure 1, Table 1). The average charge is ~7.0+ and the maximum charge state is either 7+ or 8+. The similar charge state distributions for ions with different numbers of crosslinks indicate that the crosslinkers do not cause any major structural changes to this protein. Both the average and maximum charge states for each of the six variants increases with increasing concentration of m-NBA, but more charging occurs for variants that have fewer crosslinks (Table 1). The average charge of each variant as a function of m-NBA concentration is shown in Figure 2a. There is a clear inverse relationship between the extent of supercharging and the number of crosslinks.
Table 1.
Average and maximum charge states for crosslinked cytochrome c and ubiquitin as a function of m-NBA concentration in the electrospray solution.
| Number of Crosslinks |
Average (Maximum) Charge |
|||
|---|---|---|---|---|
| Cytochrome c | % m-NBA | |||
| BS3 | 0 | 0.5 | 1.0 | 1.5 |
|
|
||||
| 2 | 7.0 (8) | 8.5 (11) | 10.0 (12) | 10.3 (13) |
| 3 | 7.0 (8) | 8.4 (11) | 9.7 (12) | 10.0 (13) |
| 4 | 6.9 (8) | 8.2 (11) | 9.3 (12) | 9.7 (13) |
| 5 | 6.9 (8) | 8.0 (11) | 8.9 (12) | 9.2 (13) |
| 6 | 6.9 (7) | 7.8 (9) | 8.4 (9) | 8.9 (12) |
| 7 | 7.0 (7) | 7.6 (8) | 7.9 (8) | 8.2 (9) |
| DEB | ||||
| 2 | 7.0 (8) | 7.5 (9) | 9.9 (12) | 9.8 (12) |
| 3 | 6.9 (8) | 7.6 (9) | 9.9 (12) | 9.9 (12) |
| 4 | 6.9 (8) | 7.5 (9) | 9.7 (12) | 9.6 (12) |
| 5 | 6.9 (8) | 7.4 (9) | 9.1 (10) | 9.4 (11) |
|
Ubiquitin
BS3 |
||||
| 0 | 5.6 (6) | 8.4 (11) | 8.5 (11) | 8.8 (11) |
| 1 | 5.5 (6) | 7.8 (10) | 7.7 (10) | 7.9 (10) |
| 2 | 5.8 (6) | 6.4 (7) | 6.5 (7) | 6.6 (7) |
Figure 2.

Trends for average charge as a function of % <i>m</i>-NBA in the ESI solutions of crosslinked cytochrome <i>c</i> and ubiquitin.
Even with seven crosslinks, charging is still increased with m-NBA (Table 1), suggesting that some unfolding can still occur. The effects of the crosslinks will depend on which residues are bound, so not all crosslinks are equally effective at restricting conformational flexibility. Fales and coworkers used trypsin proteolysis and MS/MS to find the most favorable positions of BS3 crosslinks in cytochrome c.40 Some of the crosslinks, including the most easily formed Lys25–Lys27 crosslink, bind residues within the same loop or helix, whereas others, such as the Lys72–Lys86 crosslink, bind residues from different structural elements.40 Crosslinks within a loop or helix, such as a Lys25-Lys27 crosslink,40 should only have a modest effect on cytochrome c unfolding. Even crosslinks between different regions of the protein may still allow considerable unfolding or elongation to occur.
When lysine residues and/or the N-terminus are crosslinked with BS3, these primary amines react by acylation to form amides, which reduces the gas-phase basicity of these potential protonation sites. To determine if the decrease in gas-phase basicity affects the trends we observe, cytochrome c was also reacted with DEB. DEB crosslinks primary amines (the N-terminus and lysine side chains) through reductive amination to form stable secondary amine linkages36 which should increase the gas-phase basicity of these sites. For these ions, there is a decrease in the extent of supercharging with increasing numbers of crosslinks, although this effect is smaller for the DEB-crosslinked cytochrome c than for the BS3-crosslinked cytochrome c (Table 1, Figure 2b). A comparison of the extents of supercharging for BS3- and DEB-crosslinked proteins is complicated by the shorter end-to-end distance of DEB (~7.3 Å)36 versus BS3 (~11.4 Å),37 which results in a different propensity to crosslink various sites. Nonetheless, it is clear from these results that the extent of supercharging in cytochrome c is limited by the conformational constraints induced by these crosslinks.
Similar results were obtained for BS3-crosslinked ubiquitin. Only one or two BS3 crosslinks were formed. Both the average and maximum charge of these ions increases with m-NBA, but as was the case for cytochrome c, there is a lower extent of supercharging with increasing numbers of crosslinks (Table 1, Figure 2c). Interestingly, for all three forms of ubiquitin (zero, one and two crosslinks), the average and maximum charge increased very little, if at all, above 0.5% m-NBA, suggesting that the native state(s) of ubiquitin may require less m-NBA to unfold compared to cytochrome c which increases in average and maximum charge with up to 1.0% of the supercharging reagent (Figure 2, Table 1).
Random Coil & Native RNase A
The protein RNase A with all of its disulfide bonds reduced is widely recognized as a model unfolded polypeptide41-45 due, in part, to its random coil CD spectra43, 46-50 and lack of protection in hydrogen/deuterium exchange experiments.43, 45 In recent synchrotron-based small angle X-ray scattering experiments, Sosnick and coworkers found that the radius of gyration of fully reduced RNase A does not change in 0–6 M guanidinium chloride.51 For the experiments described here, all of the disulfide bonds of RNase A were reduced with DTT and capped using either iodoacetic acid or iodoacetamide to form carboxymethyl or carbamidomethyl derivatives, respectively, to prevent the disulfide bonds from reforming. The effects of supercharging these random coil RNase A derivatives are compared to supercharging native RNase A present in the same solutions so that any uncertainties owing to minor environmental or instrumental differences can be eliminated in this comparison.
Nanoelectrospray mass spectra of ~1:1 mixtures of reduced/alkylated RNase A (ra-RNase A) and native RNase A in aqueous 200 mM ammonium acetate (pH 7.2) solutions containing 0 and 1.5% m-NBA are shown in Figure 3a and 3c. Without m-NBA, the charge state distributions (CSD) for both the carboxymethyl derivative (Figure 3a; “acid-form”) and the carbamidomethyl derivative (Figure 3c; “amide-form”) are bimodal, with much higher relative abundances for the high charge state distribution (19+ – 10+) than for the low charge state distribution (9+ – 7+). The broad distribution of high-charge peaks indicate that the majority of the derivatized protein is unfolded in solution, as expected,41-45 whereas the low-charge distribution indicates that there is a small population that retains some residual or transient higher-order structure in solution. In contrast, the native (nonderivatized) protein in both mixtures has a single gaussian-shaped CSD with a much lower average (6.9+) and maximum (8+) charge than the random coil derivatives (Table 2), consistent with a family of native or native-like structures in solution.
Figure 3.

Nanoelectrospray mass spectra of ~1:1 mixtures of ~10 μM reduced/carboxymethylated RNase A (a) and reduced/carbamidomethylated RNase A (c) with native RNase A from 200 mM ammonium acetate (pH 7.2) solutions containing 0 or 1.5% <i>m</i>-NBA. Normalized abundances of each charge state as a function of <i>m</i>-NBA concentration for reduced/carboxymethylated RNase A (b) and reduced/carbamidomethylated RNase A (d) with native RNase A.
Table 2.
Average and maximum charge states for different forms of ribonuclease A (RNase A) as a function of m-NBA concentration in the electrospray solution.
| Average (Maximum) Charge (+) |
||||
|---|---|---|---|---|
| % m-NBA | ||||
| RNase A | 0 | 0.5 | 1.0 | 1.5 |
|
|
||||
| Native | 6.9 (8) | 8.9 (12) | 9.8 (12) | 10.2 (13) |
| Carboxymethylated (19+ – 10+) |
14.1 (19) | 13.2 (19) | 13.1 (19) | 12.5 (19) |
| Carboxymethylated (9+ – 7+) |
7.8 (N/A) | 8.4 (N/A) | 8.6 (N/A) | 8.7 (N/A) |
| Native | 6.9 (8) | 8.4 (11) | 9.8 (12) | 10.3 (13) |
| Carbamidomethylated (19+ – 10+) |
13.7 (19) | 13.2 (18) | 12.8 (19) | 13.1 (19) |
| Carbamidomethylated (9+ – 7+) |
7.8 (N/A) | 8.7 (N/A) | 8.7 (N/A) | 8.6 (N/A) |
There is a significant increase in the average and maximum charge state of native RNase A with increasing m-NBA concentration (Table 2, Figure 3). Without m-NBA, the average and maximum charge state of native RNase A is 6.9+ and 8+ whereas these values with 1.5% m-NBA are 10.3+ and 13+, respectively. In striking contrast, a decrease in the average charge state with increasing m-NBA concentration occurs for the high charge state distribution (19+ – 10+) of both the RNase A derivatives, whereas the corresponding low charge state distribution (9+ – 7+) of these same molecules increases in average charge (Table 2). Thus, m-NBA is effective at supercharging native RNase A and the derivatized forms that have some higher-order structure in the initial solution, whereas from the same solution, it causes decreased charging for the derivatized forms of RNase A that are already unfolded in solution. The opposing trends in charging for the derivative forms of RNase A and native RNase A as a function of initial m-NBA concentration can be clearly seen in Figure 3b and 3d, which shows the normalized abundances of the charge states for each of these molecules as a function of m-NBA concentration. The decrease in charging with increasing m-NBA concentration for the unfolded forms of these RNase A derivatives is consistent with a surface tension effect. The surface tension of a droplet enhanced in m-NBA (pure m-NBA; 50 ± 5 mN/m)9 is lower than that of pure water (72 mN/m at 25 °C),32 and in the absence of significant conformational changes to an analyte, the lowered surface tension can cause reduced charging.10 In contrast, the increased charging of RNase A with m-NBA is consistent with partial unfolding of the molecules in the ESI droplet. Thus, the competing effects of both surface tension and chemical and/or thermal denaturation induced by addition of m-NBA can be observed for these different analytes formed from the same ESI droplets. Nearly identical results are observed for both forms of ra-RNase A (Table 2), indicating that any effects of basicity caused by these chemical modifications on charging are negligible.
Supercharging “Denatured” Proteins from Aqueous Solution
To determine the effects of adding m-NBA to an aqueous solution containing a “denatured” protein, an ESI mass spectrum of native RNase A formed from an aqueous solution to which HCl was added (pH 1.9) and heated at 50 °C for five minutes prior to and during analysis was obtained (Figure 4b). The average and maximum charge state of RNase A from this solution is 10.9+ and 14+, respectively, which is significantly higher than those obtained from a “native” solution (Figure 4a; 200 mM ammonium acetate, pH 7.2), consistent with a significant loss of structure of this protein in the heated, acidified solution. The extent of acid/heat induced charge enhancement is only somewhat higher than that observed from “native” aqueous solutions containing 1.5% m-NBA (Table 2, Figure 3) indicating that m-NBA present in the ESI droplet is nearly as effective at disrupting the native structure of this protein as the acid/heat treatment used here.
Figure 4.
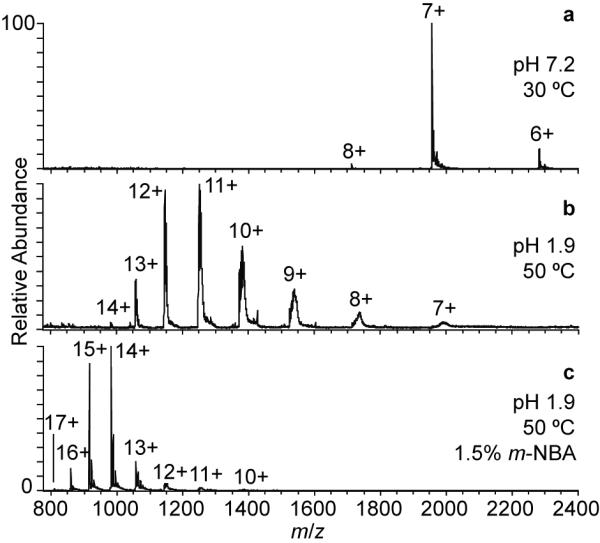
Nanoelectrospray mass spectra of 10 μM RNase A in (a) 200 mM ammonium acetate (pH 7.2) solution, (b) 50 °C HCl solution (pH 1.9), and (c) 50 °C HCl solution (pH 1.9) containing 1.5% <i>m</i>-NBA.
With m-NBA added to the 50 °C “denaturing” solution, the average and maximum charge states increase further to 14.1+ and 17+, respectively (Figure 4c). This result is consistent with some studies which indicate that in similarly low pH, high temperature solutions,52, 53 or in solutions with high denaturant concentration,54 native RNase A retains a significant amount of native structure. For example, Fink and coworkers measured 11% helix and 17% β-sheet content in native RNase in a pH 2.0, 65 °C solution.53 Upon addition of guanidinium chloride to this “denaturing” solution, they observed a noncooperative loss of the remaining helical structure.53 Similarly, Lustig and Fink measured a loss of secondary structure upon addition of methanol to a pH 2.0, 70 °C, 5 M guanidinium chloride solution of RNase A.55 These experiments demonstrate the additive effect of two or more denaturants when the analyte still has residual structure that can be disrupted, and illustrates that some higher-order protein structure can remain even in solutions often thought to be more fully denaturing. Here, the addition of m-NBA to the “denaturing” acidified and heated solution appears to have a similar additive effect causing additional unfolding and concomitantly higher charging to occur during ESI.
It is interesting that there is a higher average charge with a tighter distribution of charge states and a lower maximum charge for the “denatured” native RNase A with 1.5% m-NBA compared to both forms of the raRNase A with 1.5% m-NBA, which should be largely unfolded (Table 2). The higher average charge and tighter distribution of charge states for RNase A could be the result of the high denaturant concentration/conditions causing even transient intramolecular interactions that may occur for raRNase A to become less favorable, while the lower maximum charge could be due to the intact disulfide bonds, which may not allow the protein to unfold as much as the disulfide-reduced protein.
Highly disulfide-bonded phospholipase A2
Phospholipase A2 (PLA2) proteins from diverse sources have native structures that are highly resistant to denaturation.56-58 For example, there is no change in the optical rotary dispersion (ORD) spectrum of honeybee PLA2 from 10 to 90 °C59 and no change in the ORD or CD spectra of porcine PLA2 upon increasing the urea concentration from 0 to 8 M.60 Common among the members of the PLA2 superfamily of enzymes61 are a large number of disulfide bonds (5–8) for their relatively small sizes (13–18 kDa).62-64 The high density of disulfide bonding is the foundation of their rigid structures and their stability to proteolysis and resistance to denaturation.57, 58 Nanoelectrospray mass spectra of phospholipase A2 from cobra venom (c-PLA2; 7 disulfide bonds) in aqueous 200 mM ammonium acetate (pH 7.2) solutions containing 0 to 1.5% m-NBA are shown in Figure 5a-d. There is a significant increase in average (from 7.0+ to 8.9+) and maximum (8+ to 11+) charge state for c-PLA2 with 0 and 0.5% m-NBA, respectively (Table 3). Additional increases in average charge to 9.5+ and 10.2+ occurs with 1.0 and 1.5% m-NBA, respectively, whereas the maximum charge does not change above the 13+ observed with 1.0% m-NBA (Table 3).
Figure 5.

Nanoelectrospray mass spectra of phospholipase A<sub>2</sub> from (a–d) cobra venom and (e–h) honeybee venom from 10 μM ammonium acetate(pH 7.4) solutions containing between 0 and 1.5% <i>m</i>-NBA.
Table 3.
Average and maximum charge states for different forms of phospholipase A2 from cobra and honeybee venoms as a function of m-NBA concentration in the electrospray solution.
| Average (Maximum) Charge (+) |
||||
|---|---|---|---|---|
| % m-NBA | ||||
| Phospholipase A2 | 0 | 0.5 | 1.0 | 1.5 |
|
|
||||
| Cobra (7 disulfides) | 7.0 (8) | 8.9 (11) | 9.5 (13) | 10.2 (13) |
| Cobra (reduced/carboxymethylated) | 10.7 (16) | 11.4 (16) | 11.4 (16) | 11.5 (16) |
| Honeybee (6 disulfides) | 7.8 (9) | 9.1 (10) | 9.9 (11) | 10.0 (12) |
| Honeybee (reduced/ carboxymethylated) | 15.9 (19) | 16.5 (21) | 16.5 (21) | 16.5 (21) |
Similar results were obtained for phospholipase A2 from honeybee venom (hb-PLA2; 6 disulfide bonds) (Figure 5e-h). Each charge state in the distribution for hb-PLA2 is composed of a series of peaks separated by 160 Da, corresponding to multiple glycosylations that have been previously characterized.65 Each glycoform was used in the calculation of average and maximum charge. There is also a charge state distribution for an unknown species (labeled * in Figure 5e-h) that is consistent with a large C-terminal fragment of hb-PLA2, but was not characterized further and is treated as an impurity herein. Without m-NBA, the average and maximum charge states are 7.8+ and 9+, respectively (Figure 5e, Table 3). The average and maximum charge state of hb-PLA2 increase to 9.1+ and 10+, respectively, with 0.5% m-NBA (Figure 5f, Table 3). The average and maximum charge are 9.9+ and 11+, respectively, with 1.0% m-NBA (Figure 5g, Table 3). There is very little change in charging with 1.5% m-NBA (10.0+ (12+) Figure 5f, Table 3).
Despite their inherent resistance to denaturation, both cobra and honeybee PLA2 can be supercharged with m-NBA. To investigate whether this additional charging is due to structural changes occurring in regions between the disulfide bonds, we prepared fully reduced/carboxymethylated derivatives of both proteins and obtained mass spectra from aqueous 200 mM ammonium acetate (pH 7.2) solutions containing 0 to 1.5% m-NBA. Broad charge state distributions at high charge (16+ – 6+ (cPLA2), 19+ – 10+ (hbPLA2)) are formed without m-NBA, consistent with significantly more unfolded structures in solution when the disulfide bonds are reduced and capped. In contrast to the results for raRNase A, a very minor increase in charging was observed with 0.5% m-NBA, although no significant additional charging occurs with 1.0% or 1.5% m-NBA (Table 3). These results suggest that surface tension effects may be overcome by the loss of some residual or higher-order transient structure of the reduced/carboxymethylated lipases. Nonetheless, the higher charging observed for both of these derivatives (even without m-NBA) compared to the highest average and maximum charge for the corresponding native proteins indicate that the disulfide bonds of the native proteins likely limit the extent of supercharging, similar to what was observed for native RNase A (Table 3).
Conclusions
The effects of reduced conformational flexibility, induced either by native disulfide bonds or by chemical crosslinkers, on the extent of supercharging in aqueous solutions with m-NBA were investigated. Supercharging occurs even for extensively crosslinked proteins that cannot fully unfold, but there is a clear reduction in the extent of supercharging with increasing numbers of chemical crosslinkers. Although supercharging occurs for native RNase A formed from aqueous solutions containing ammonium acetate (pH 7.2), a decrease in charge is observed for derivatized forms of RNase A in which the disulfide bonds are reduced and there is minimal residual higher-order structure. Changes to basicities at potential sites of protonation induced by the chemical modifications had no noticeable effect on the extent of charging or supercharging with m-NBA indicating that the intrinsic proton transfer reactivity at these sites does not affect the extent of supercharging in these experiments.
Although many factors can affect charging in ESI, including conformation,1, 2 solvent and analyte basicity,5-7 solvent surface tension,8-10 and instrument parameters,11-14 these results provide additional support for our hypothesis that conformational change, induced by enrichment of the supercharging reagent late in the ESI droplet lifetime, is the primary origin of supercharging of native proteins or protein complexes in aqueous solutions. Previous circular dichroism and H/D exchange results indicate that these supercharging reagents do not cause a change in protein structure at the low concentrations used in the initial solutions,23, 24 but can destabilize protein conformation in the ESI droplet by chemical23, 24 and/or thermal22 denaturation as the concentration of the supercharging reagent increases owing to preferential evaporation of water. The lower surface tension of the supercharging reagents compared to water can result in a lowering of the charge states for molecules where significant conformational changes are not possible,10 and the results described here show that a lowering of charge states can also occur for proteins in aqueous solution when the protein has little or no higher-order structure. Thus, the additional charging induced by analyte unfolding can overcome the competing effects of lower droplet surface tension to produce a net supercharging effect for protein and protein complexes formed from aqueous solution. Because supercharging depends in part on conformation, the extent of supercharging will be protein-dependent and will likely be influenced by protein stability as well as the radius of gyration of the unfolded states of the protein.
Acknowledgments
The authors thank the National Science Foundation (grant CHE-1012833 for E.R.W.) and the National Institutes of Health (training grant T32GM08295 for H.J.S.; grant R01-AI077703 for B.A.K; and grant NIH NCRR P41RR001614 for A.L.B. ) for generous financial support.
References
- 1.Chowdhury SK, Katta V, Chait BT. J. Am. Chem. Soc. 1990;112:9012–9013. [Google Scholar]
- 2.Loo JA, Loo RRO, Udseth HR, Edmonds CG, Smith RD. Rapid Commun. Mass Spectrom. 1991;5:101–105. doi: 10.1002/rcm.1290050303. [DOI] [PubMed] [Google Scholar]
- 3.Konermann L, Douglas DJ. Rapid Commun. Mass Spectrom. 1998;12:435–442. doi: 10.1002/(SICI)1097-0231(19980430)12:8<435::AID-RCM181>3.0.CO;2-F. [DOI] [PubMed] [Google Scholar]
- 4.Dobo A, Kaltashov IA. Anal. Chem. 2001;73:4763–4773. doi: 10.1021/ac010713f. [DOI] [PubMed] [Google Scholar]
- 5.Iavarone AT, Jurchen JC, Williams ER. J. Am. Soc. Mass Spectrom. 2000;11:976–985. doi: 10.1016/S1044-0305(00)00169-0. [DOI] [PMC free article] [PubMed] [Google Scholar]
- 6.Loo RRO, Smith RD. J. Mass Spectrom. 1995;30:339–347. [Google Scholar]
- 7.Williams ER. J. Mass Spectrom. 1996;31:831–842. doi: 10.1002/(SICI)1096-9888(199608)31:8<831::AID-JMS392>3.0.CO;2-7. [DOI] [PMC free article] [PubMed] [Google Scholar]
- 8.Iavarone AT, Jurchen JC, Williams ER. Anal. Chem. 2001;73:1455–1460. doi: 10.1021/ac001251t. [DOI] [PMC free article] [PubMed] [Google Scholar]
- 9.Iavarone AT, Williams ER. Int. J. Mass Spectrom. 2002;219:63–72. [Google Scholar]
- 10.Iavarone AT, Williams ER. J. Am. Chem. Soc. 2003;125:2319–2327. doi: 10.1021/ja021202t. [DOI] [PMC free article] [PubMed] [Google Scholar]
- 11.Thomson BA. J. Am. Soc. Mass Spectrom. 1997;8:1053–1058. [Google Scholar]
- 12.Benkestock K, Sundqvist G, Edlund PO, Roeraade J. J. Mass Spectrom. 2004;39:1059–1067. doi: 10.1002/jms.685. [DOI] [PubMed] [Google Scholar]
- 13.Yang PX, Cooks RG, Ouyang Z, Hawkridge AM, Muddiman DC. Anal. Chem. 2005;77:6174–6183. doi: 10.1021/ac050711l. [DOI] [PubMed] [Google Scholar]
- 14.Page JS, Kelly RT, Tang K, Smith RD. J. Am. Soc. Mass Spectrom. 2007;18:1582–1590. doi: 10.1016/j.jasms.2007.05.018. [DOI] [PubMed] [Google Scholar]
- 15.Stephenson JL, McLuckey SA. J. Am. Chem. Soc. 1996;118:7390–7397. [Google Scholar]
- 16.Scalf M, Westphall MS, Smith LM. Anal. Chem. 2000;72:52–60. doi: 10.1021/ac990878c. [DOI] [PubMed] [Google Scholar]
- 17.Kharlamova A, Prentice BM, Huang TY, McLuckey SA. Anal. Chem. 2010;82:7422–7429. doi: 10.1021/ac101578q. [DOI] [PMC free article] [PubMed] [Google Scholar]
- 18.Iavarone AT, Williams ER. Anal. Chem. 2003;75:4525–4533. doi: 10.1021/ac034144i. [DOI] [PMC free article] [PubMed] [Google Scholar]
- 19.Sze SK, Ge Y, Oh H, McLafferty FW. Proc. Natl. Acad. Sci. USA. 2002;99:1774–1779. doi: 10.1073/pnas.251691898. [DOI] [PMC free article] [PubMed] [Google Scholar]
- 20.Davies NW, Wiese MD, Browne SGA. Toxicon. 2004;43:173–183. doi: 10.1016/j.toxicon.2003.11.021. [DOI] [PubMed] [Google Scholar]
- 21.Kjeldsen F, Giessing AMB, Ingrell CR, Jensen ON. Anal. Chem. 2007;79:9243–9252. doi: 10.1021/ac701700g. [DOI] [PubMed] [Google Scholar]
- 22.Sterling HJ, Williams ER. J. Am. Soc. Mass Spectrom. 2009;20:1933–1943. doi: 10.1016/j.jasms.2009.06.012. [DOI] [PMC free article] [PubMed] [Google Scholar]
- 23.Sterling HJ, Daly MP, Feld GK, Thoren KL, Kintzer AF, Krantz BA, Williams ER. J. Am. Soc. Mass Spectrom. 2010;21:1762–1774. doi: 10.1016/j.jasms.2010.06.012. [DOI] [PMC free article] [PubMed] [Google Scholar]
- 24.Sterling HJ, Williams ER. Anal. Chem. 2010;82:9050–9057. doi: 10.1021/ac101957x. [DOI] [PMC free article] [PubMed] [Google Scholar]
- 25.Lomeli SH, Yin S, Loo RRO, Loo JA. J. Am. Soc. Mass Spectrom. 2009;20:593–596. doi: 10.1016/j.jasms.2008.11.013. [DOI] [PMC free article] [PubMed] [Google Scholar]
- 26.Lomeli SH, Peng IX, Yin S, Loo RRO, Loo JA. J. Am. Soc. Mass Spectrom. 2010;21:127–131. doi: 10.1016/j.jasms.2009.09.014. [DOI] [PMC free article] [PubMed] [Google Scholar]
- 27.Hogan CJ, Loo RRO, Loo JA, de la Mora JF. Phys. Chem. Chem. Phys. 2010;12:13476–13483. doi: 10.1039/c0cp01208d. [DOI] [PubMed] [Google Scholar]
- 28.Yin S, Loo JA. Int. J. Mass Spectrom. 2010 doi: 10.1016/j.ijms.2010.06.032. 10.1016/j.ijms.2010.1006.1032. [DOI] [PMC free article] [PubMed] [Google Scholar]
- 29.Valeja SG, Tipton JD, Emmett MR, Marshall AG. Anal. Chem. 2010;82:7515–7519. doi: 10.1021/ac1016858. [DOI] [PMC free article] [PubMed] [Google Scholar]
- 30.Rayleigh Lord. Phils. Mag. 1882;14:184–186. [Google Scholar]
- 31.Fenn JB, Mann M, Meng CK, Wong SF, Whitehouse CM. Science. 1989;246:64–71. doi: 10.1126/science.2675315. [DOI] [PubMed] [Google Scholar]
- 32.Lide DR, editor. CRC Handbook of Chemistry and Physics. 89th edn 2008-2009. [Google Scholar]
- 33.Goodman JM, Kirby PD, Haustedt LO. Tetrahedron Lett. 2000;41:9879–9882. [Google Scholar]
- 34.Grimm RL, Beauchamp JL. J. Phys. Chem. A. 2010;114:1411–1419. doi: 10.1021/jp907162w. [DOI] [PubMed] [Google Scholar]
- 35.Scherrenberg R, Coussens B, van Vliet P, Edouard G, Brackman J, de Brabander E, Mortensen K. Macromolecules. 1998;31:456–461. [Google Scholar]
- 36.Trnka MJ, Burlingame AL. Mol. Cell. Proteom. 2010;9:2306–2317. doi: 10.1074/mcp.M110.003764. [DOI] [PMC free article] [PubMed] [Google Scholar]
- 37.Onisko B, Fernandez EG, Freire ML, Schwarz A, Baier M, Camina F, Garcia JR, Villamarin SRS, Requena JR. Biochemistry. 2005;44:10100–10109. doi: 10.1021/bi0501582. [DOI] [PubMed] [Google Scholar]
- 38.Jurchen JC, Williams ER. J. Am. Chem. Soc. 2003;125:2817–2826. doi: 10.1021/ja0211508. [DOI] [PMC free article] [PubMed] [Google Scholar]
- 39.Bushnell GW, Louie GV, Brayer GD. J. Mol. Biol. 1990;214:585–595. doi: 10.1016/0022-2836(90)90200-6. [DOI] [PubMed] [Google Scholar]
- 40.Pearson KM, Pannell LK, Fales HM. Rapid Commun. Mass Spectrom. 2002;16:149–159. doi: 10.1002/rcm.554. [DOI] [PubMed] [Google Scholar]
- 41.Harrington WF, Sela M. Biochim. Biophys. Acta. 1959;31:427–434. doi: 10.1016/0006-3002(59)90017-4. [DOI] [PubMed] [Google Scholar]
- 42.Klee WA. Biochemistry. 1967;6:3736–3742. doi: 10.1021/bi00864a016. [DOI] [PubMed] [Google Scholar]
- 43.Woodward CK, Rosenberg A. Proc. Natl. Acad. Sci. USA. 1970;66:1067–1074. doi: 10.1073/pnas.66.4.1067. [DOI] [PMC free article] [PubMed] [Google Scholar]
- 44.Pittz EP, Bello J. Arch. Biochem. Biophys. 1971;147:284. doi: 10.1016/0003-9861(71)90336-5. &. [DOI] [PubMed] [Google Scholar]
- 45.Bai YW, Milne JS, Mayne L, Englander SW. Prot. Struct. Funct. Gen. 1993;17:75–86. doi: 10.1002/prot.340170110. [DOI] [PMC free article] [PubMed] [Google Scholar]
- 46.Tamburro AM, Boccu E, Celotti L. Int. J. Prot. Res. 1970;2:157–164. doi: 10.1111/j.1399-3011.1970.tb01672.x. [DOI] [PubMed] [Google Scholar]
- 47.Jirgensons B. Biochim. Biophys. Acta. 1970;200:9–17. doi: 10.1016/0005-2795(70)90037-1. [DOI] [PubMed] [Google Scholar]
- 48.Noppert A, Gast K, MullerFrohne M, Zirwer D, Damaschun G. Febs Letters. 1996;380:179–182. doi: 10.1016/0014-5793(96)00048-8. [DOI] [PubMed] [Google Scholar]
- 49.Qi PX, Sosnick TR, Englander SW. Nat. Struct. Biol. 1998;5:882–884. doi: 10.1038/2321. [DOI] [PubMed] [Google Scholar]
- 50.Takahashi S, Kontani T, Yoneda M, Ooi T. J. Biochem. 1977;82:1127–1133. doi: 10.1093/oxfordjournals.jbchem.a131785. [DOI] [PubMed] [Google Scholar]
- 51.Jacob J, Dothager RS, Thiyagarajan P, Sosnick TR. J. Mol. Biol. 2007;367:609–615. doi: 10.1016/j.jmb.2007.01.012. [DOI] [PubMed] [Google Scholar]
- 52.Talluri S, Scheraga HA. Biochem. Biophys. Res. Commun. 1990;172:800–803. doi: 10.1016/0006-291x(90)90745-9. [DOI] [PubMed] [Google Scholar]
- 53.Seshadri S, Oberg KA, Fink AL. Biochemistry. 1994;33:1351–1355. doi: 10.1021/bi00172a010. [DOI] [PubMed] [Google Scholar]
- 54.Zhou JM, Fan YX, Kihara H, Kimura K, Amemiya Y. Febs Letters. 1998;430:275–277. doi: 10.1016/s0014-5793(98)00639-5. [DOI] [PubMed] [Google Scholar]
- 55.Lustig B, Fink AL. Biochim. Biophys. Acta. 1992;1119:205–210. doi: 10.1016/0167-4838(92)90393-r. [DOI] [PubMed] [Google Scholar]
- 56.Nair BC, Nair C, Elliott WB. Toxicon. 1976;14:43–47. doi: 10.1016/0041-0101(76)90118-5. [DOI] [PubMed] [Google Scholar]
- 57.Balsinde J, Balboa MA, Insel PA, Dennis EA. Annu. Rev. Pharmacol. Toxicol. 1999;39:175–189. doi: 10.1146/annurev.pharmtox.39.1.175. [DOI] [PubMed] [Google Scholar]
- 58.Verheij HM, Slotboom AJ, De Haas GH. Reviews of Physiology Biochemistry and Pharmacology. vol. 91. Springer-Verlag; Berlin: 1981. [DOI] [PubMed] [Google Scholar]
- 59.Nair C, Hermans J, Munjal D, Elliott WB. Toxicon. 1976;14:35–42. doi: 10.1016/0041-0101(76)90117-3. [DOI] [PubMed] [Google Scholar]
- 60.Scanu AM, Van Deenen LLM, De Haas GH. Biochim. Biophys. Acta. 1969;181:471–473. doi: 10.1016/0005-2795(69)90282-7. [DOI] [PubMed] [Google Scholar]
- 61.Six DA, Dennis EA. Biochim. Biophys. Acta, Mol. Cell. Biol. Lipids. 2000;1488:1–19. doi: 10.1016/s1388-1981(00)00105-0. [DOI] [PubMed] [Google Scholar]
- 62.Markert Y, Mansfeld J, Schierhorn A, Rucknagel KP, Ulbrich-Hofmann R. Biotechnol. Bioeng. 2007;98:48–59. doi: 10.1002/bit.21392. [DOI] [PubMed] [Google Scholar]
- 63.Davidson FF, Dennis EA. J. Mol. Evol. 1990;31:228–238. doi: 10.1007/BF02109500. [DOI] [PubMed] [Google Scholar]
- 64.Dennis EA. J. Biol. Chem. 1994;269:13057–13060. [PubMed] [Google Scholar]
- 65.Weber A, Marz L, Altmann F. Comp. Biochem. Physiol. B: Biochem. Mol. Biol. 1986;83:321–324. doi: 10.1016/0305-0491(86)90374-3. [DOI] [PubMed] [Google Scholar]