

Abstract
Signals of archaic admixture have been identified through comparisons of the draft Neanderthal and Denisova genomes with those of living humans. Studies of individual loci contributing to these genome-wide average signals are required for characterization of the introgression process and investigation of whether archaic variants conferred an adaptive advantage to the ancestors of contemporary human populations. However, no definitive case of adaptive introgression has yet been described. Here we provide a DNA sequence analysis of the innate immune gene STAT2 and show that a haplotype carried by many Eurasians (but not sub-Saharan Africans) has a sequence that closely matches that of the Neanderthal STAT2. This haplotype, referred to as N, was discovered through a resequencing survey of the entire coding region of STAT2 in a global sample of 90 individuals. Analyses of publicly available complete genome sequence data show that haplotype N shares a recent common ancestor with the Neanderthal sequence (∼80 thousand years ago) and is found throughout Eurasia at an average frequency of ∼5%. Interestingly, N is found in Melanesian populations at ∼10-fold higher frequency (∼54%) than in Eurasian populations. A neutrality test that controls for demography rejects the hypothesis that a variant of N rose to high frequency in Melanesia by genetic drift alone. Although we are not able to pinpoint the precise target of positive selection, we identify nonsynonymous mutations in ERBB3, ESYT1, and STAT2—all of which are part of the same 250 kb introgressive haplotype—as good candidates.
Introduction
Comparisons of the Neanderthal and Denisova genomes with those of present-day humans support the hypothesis of hybridization between these ancient Pleistocene populations and the ancestors of anatomically modern humans (AMH) in Eurasia.1,2 With the growing acceptance of gene flow between archaic humans and AMH, we can now begin to investigate the role that natural selection might have played in influencing the introgression process after hybridization. To do this, we must move beyond estimates of the average extent of archaic ancestry across the genome to studies that (1) identify specific genomic regions that have introgressed, (2) determine the extent of the chromosomal region affected by introgression, and (3) measure the frequency of introgressive alleles in human populations. Neutrally evolving introgressive alleles are only expected to be found sporadically among human populations given the likely loss of many of these variants through genetic drift. On the other hand, archaic alleles that confer a selective advantage after introgressing may consistently reach higher frequencies even in the case of low levels of archaic admixture.3,4
Thus far, only a handful of loci have been hypothesized to have entered the human gene pool through archaic admixture and positive selection, including MAPT (MIM 157140),5 MCPH1 (MIM 607117),3 and particular alleles at the HLA locus (MIM 142800, 142830, 142840).6 However, analysis of the Neanderthal genome failed to provide evidence of introgressive alleles at the former two loci.1 Because of its role in fighting pathogens, HLA presents an instance where it is relatively easy to conceive of an a priori reason that acquisition of an archaic Eurasian HLA allele would benefit human ancestors, especially as they expanded into new habitats.7 However, the fact that HLA haplotypes are known to exhibit transspecific polymorphism and show evidence of strong balancing selection8,9 increases the probability that similarities between modern and archaic haplotypes are due to ancestral shared polymorphism (i.e., as opposed to archaic admixture). In addition, the SNPs tagging the main HLA haplotype that was said to have introgressed were not observed in the Denisova or Neanderthal draft genomes.
Here we present evidence that STAT2 (MIM 600556), a gene also having an important role in immunity, introgressed from Neanderthals. Located on chromosome 12, STAT2 encodes STAT2 (accession number AAA98760.1), which plays an important role in interferon signaling pathways. Because of its key role in interferon-mediated responses10 and potential associations with autoimmune disorders,11 we considered STAT2 a candidate for local adaptation in humans. Initially, we resequenced ∼8.6 kb of STAT2, including all coding exons, in six Old World populations (Biaka, Mandenka, San, Han Chinese, French Basque, and Papua New Guineans) and observed the presence of a haplotype (N) that is restricted to non-African populations and has a relatively deep branching. This haplotype shares derived SNPs with Neanderthals, produces extended linkage disequilibrium (LD) in non-Africans, and shows recent common ancestry with the Neanderthal sequence. Surprisingly, haplotype N is found at 10-fold higher frequency in Papuan New Guinea, making it a candidate for positive selection in Melanesians.
Subjects and Methods
Samples
Four panels of samples were used in this study. The first panel (resequencing panel) consisted of 90 humans from three sub-Saharan African and three non-African populations (16 Mandenka from Senegal, 16 Biaka Pygmy from the Central African Republic, 10 San from Namibia, 16 French Basque, 16 Chinese Han, and 16 Papua New Guineans), as well as a common chimpanzee and a bonobo. A study of neutral genetic variation in humans,12,13 which included 61 noncoding loci, had used these samples previously. The second panel (genotyping panel) consisted of 75 Melanesians and was genotyped for SNPs diagnostic for haplotypes in the N and D clades (see below). The third panel (public SNP panel) consisted of samples genotyped in published studies; these included the Human Genome Diversity Project (HGDP) subset that was genotyped on the Illumina 650Y array,14,15 ten European populations used in a study of the geographic structure of genetic variation in Europe,16 six HapMap populations, and 24 other populations.17 The fourth panel consists of publicly available whole-genome sequences (public WGS panel), including 1 Japanese (NA18956) and 1 Luhya (NA19026) sequenced by Complete Genomics, 1 San (KB1),18 and 1 Papuan (HGDP00542),1 as well as the Neanderthal and Denisova draft genomes. All sampling procedures were approved by the University of Arizona Human Subjects Committee.
Sequencing and Genotyping
In what follows all positions refer to chromosome 12 and the 2006 build of the human genome (hg18). The resequencing panel was amplified by PCR and sequenced for ∼8.6 kb of STAT2 in six segments spanning bases 55,021,597–55,040,412 (Figure 1; see also Tables S1A and, for primer sequences, Table S1B in the Supplemental Data available with this article online). Chromatograms were analyzed with Phred/Phrap/Consed/Polyphred and finished manually.13 The ancestral state was inferred from chimpanzee and bonobo sequences. Samples in the genotyping panel were sequenced at positions 55,030,502, 55,030,689, and 55,030,712 (Table S2).
Figure 1.
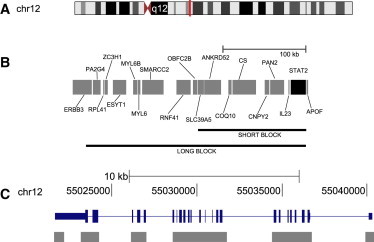
Schematic Representation of Studied Region
(A) Chromosome 12. A vertical bar indicates the position of STAT2.
(B) The physical location of the genes surrounding STAT2. STAT2 is indicated with a black box, other genes are indicated with gray boxes, and the spans of two haplotypes (described in the main text as the short and long variants of N) are indicated with horizontal lines and labeled as “short block” and “long block.”
(C) STAT2. The six sets of contiguous resequenced amplicons are indicated with boxes below the scheme of the gene. In the representation of the gene, boxes indicate exons (wide boxes correspond to coding sequence).
Sequence and Phylogenetic Analysis
Watterson’s θW, nucleotide diversity π, and Tajima’s D19 were computed from the resequenced data. DNAsp20 was used for estimating the parameters and their sample standard deviations. Haplotypes were phased manually after alleles that occurred in fewer than three chromosomes were removed. Cladograms were constructed from the haplotypes in Table 1, both manually and through the use of PAUP21 after the removal of two haplotypes showing evidence of recombination. A fully resolved bifurcating tree was obtained after our data set was augmented with the publicly available genome sequences of individuals NA19026 and KB1 and after two additional nucleotide sites outside of the resequenced region were taken into consideration (Table S3).
Table 1.
Polymorphism Table for Six Segments Covering All Exons of STAT2a
| Haplotype |
Genomic Positionsb |
Africans |
Non-Africans |
||||||||||||||||||||||||||
|---|---|---|---|---|---|---|---|---|---|---|---|---|---|---|---|---|---|---|---|---|---|---|---|---|---|---|---|---|---|
|
2 2 1 1 4 |
2 3 5 2 2 |
2 3 7 3 3 |
2 4 2 4 0 |
2 6 1 2 8 |
2 6 2 8 4 |
2 6 6 4 7 |
2 6 9 4 9 |
2 6 9 6 7 |
2 9 2 6 4 |
2 9 6 3 4 |
2 9 9 6 5 |
3 0 3 5 8 |
3 0 5 0 2 |
3 0 5 4 3 |
3 0 6 8 9 |
3 0 7 1 2 |
3 5 7 6 1 |
3 5 7 6 2 |
3 5 8 5 9 |
3 6 4 7 1 |
4 0 0 8 9 |
4 0 4 0 4 |
BIA | MAN | SAN | PNG | HAN | BAS | |
| G | C | G | G | C C |
A G A |
C | G | C | T | C | T | A | A | G | G | T | A | T | A | C | C | T | |||||||
| Neanderthal | ∗ | . | . | . | – | ∗ | . | . | . | . | . | ∗ | ∗ | . | . | A | C | . | . | . | T | ∗ | . | ||||||
| Denisova | . | . | ∗ | . | . | . | ∗ | . | . | . | . | . | . | T | . | . | . | . | . | ∗ | . | . | . | ||||||
| N | . | . | . | . | – | — | . | . | . | . | . | . | . | . | . | A | C | . | . | . | T | A | . | 19 | 3 | ||||
| D | . | . | . | . | . | . | . | . | . | . | . | . | . | T | . | . | . | . | . | . | . | . | . | 3 | |||||
| S | . | T | . | . | . | . | T | . | . | . | . | . | . | . | . | . | . | . | C | G | . | . | . | 6 | |||||
| Mb-1 | . | . | . | A | . | . | . | C | . | . | T | . | . | . | C | . | . | . | . | . | . | . | . | 9 | 8 | 10 | 31 | 22 | |
| Mb-2 | . | . | A | A | . | . | . | C | . | . | T | . | . | . | C | . | . | . | . | . | . | . | . | 4 | |||||
| Mb-3 | . | . | . | A | . | . | . | C | . | . | T | . | C | . | C | . | . | . | . | . | . | . | . | 3 | |||||
| Ma-1 | . | . | . | . | . | . | . | C | . | . | . | . | . | . | . | . | . | . | . | . | . | . | . | 2 | 2 | ||||
| Ma-2 | . | . | . | . | . | . | . | C | . | . | . | C | . | . | . | . | . | . | . | . | . | . | . | 2 | |||||
| Ma-3 | . | . | . | . | . | . | . | C | . | . | . | C | . | . | . | . | . | . | . | . | . | . | G | 16 | 10 | 5 | |||
| Ma-4 | A | . | . | . | . | . | . | C | . | . | . | C | . | . | . | . | . | . | . | . | . | . | G | 2 | 2 | ||||
| Ma-5 | . | . | . | . | . | . | . | C | T | . | . | C | . | . | . | . | . | . | . | . | . | . | G | 3 | |||||
| Ma-6 | . | . | . | . | . | . | . | C | . | C | . | C | . | . | . | . | . | . | . | . | . | . | G | 1 | 7 | 2 | |||
| Ma-7 | . | . | . | . | . | . | . | C | . | . | . | C | . | . | . | . | . | G | . | . | . | . | G | 1 | 5 | ||||
| Rec N-Mb | . | . | . | A | . | . | . | C | . | . | . | . | . | . | . | A | C | . | . | . | T | A | . | 1 | |||||
| Rec S-M | . | T | . | . | . | . | T | . | . | . | . | . | . | . | . | . | . | . | . | . | . | . | . | 1 | |||||
An asterisk indicates low coverage. The following abbreviations are used: BIA, Biaka; MAN, Mandinka; SAN, San; PNG, Papua New Guinea; HAN, Han Chinese; and BAS, French Basque.
Sites with <3 chromosomes are excluded.
55,000,000 has been subtracted from the original positions.
Haploblock Analysis and Decay of LD
Phased haplotypes from HapMap phase III were downloaded and analyzed with the program Haploblock Finder v. 0.7.22 For LD analysis, SNPs with minor allele frequency greater than 0.02 were used (i.e., singletons were removed). Pairwise LD in each population was plotted with the scripts accompanying the program. The probability that the haplotype N of length r (in Morgans) persisted in a panmictic population for t generations was estimated under the assumptions that generation time was 25 years and that the decay of a haplotype by recombination follows an exponential distribution with parameter r. Because of its high precision, we chose the genetic map of Hinch et al.23 to determine r. Given the absence of recombinational hotsposts in the analyzed region, the variance in r between populations is expected to be small.
Estimation of Divergence Times
We used one of two different methods to calculate the divergence time between a pair of hominin lineages, depending on sequence coverage. For sequences with complete coverage, the number of mutations separating the sequences was assumed to be a sample from a Poisson distribution. The corresponding mutation rate was calculated with 6 million years (My) as a divergence time for the human and chimpanzee reference sequences (Figure S1). For an individual, the number of mutations separating the sequences of the two chromosomes is the number of heterozygous sites. For comparisons between NA18956 (from the WGS panel) and the Neanderthal sequence, which has incomplete coverage, the mutations derived in NA18956 since the common ancestor with chimpanzee were checked against the Neanderthal sequence (Figure S1). The mutations with sequence coverage were classified as predating or postdating the split between NA18956 and Neanderthal lineages. We used methods based on the distribution of presplit and postsplit mutations24,25 to estimate the fraction of the interval that postdates the split. A joint likelihood was then obtained for the divergence times of the sequence of NA18956 from those of Neanderthals and the human reference (Appendix A), which was then used to obtain point estimates and confidence intervals.
Test for Selection in Melanesians
The allele frequency of the N lineage was estimated via diagnostic SNPs (Table S2), and its geographic distribution was plotted with Generic Mapping Tools.26 To test for an unusually high frequency of haplotype N we (1) generated an empirical distribution of derived-allele frequencies for each of two Melanesian HGDP samples (Papuans and Nasioi), (2) compared the frequency of the SNP rs7962107 (diagnostic of the long variant of the N lineage) to this distribution, and (3) applied a one-tailed test for elevated frequency of the derived allele. We built the empirical distribution by using SNPs in the Illumina 650Y array that were genotyped in the HGDP panel.15 We filtered SNPs by requiring that the derived-allele frequency and variance among East Asian populations be within 30% of the values corresponding to rs7962107. The frequencies in Melanesian populations of the 6,213 SNPs that passed the filter were used for generating the empirical distributions of derived-allele frequencies in Papuans and in Nasioi samples. We note that the test yielded similar results when these values were between 20% and 30% (see Results); however, the value of 30% is reported below as it both increases the robustness of the test (i.e., by including a larger number of SNPs) and at the same time makes the test more conservative (i.e., by including more SNPs that are at higher frequency in East Asia than in the N lineage).
Results
STAT2 Haplotypes
Figure 2 shows a cladogram of 13 haplotypes observed in the 90 humans included in the resequencing panel (Table 1 and Table S4). Publicly available sequence data (public WGS panel) from regions surrounding the 8.6 kb STAT2 helped to resolve the phylogeny into a fully binary tree (boxes in Figure 2). The cladogram contains four clades, labeled S, D, N, and M (standing for San, Denisova, Neanderthal, and modern, respectively). S is observed only in the San, with a frequency of 35% (including a recombinant haplotype) (Table 1). Clade D, containing a single rare haplotype, is restricted to our Papuan sample, where it is found at a frequency of 9%. Clade N is present at high frequency in Papuans (59%) and at lower frequency in the Basque (9%). The remaining chromosomes fall into two major subclades, labeled Ma and Mb (Figure 2). The Ma subclade is restricted to sub-Saharan Africans, where it ranges in frequency from 65% to 75%, whereas the Mb subclade is most common in our worldwide sample (48%). Haplotypes in clade Mb predominate in non-Africans, especially the Han and French Basque, where they are found at frequencies of 97% and 91%, respectively.
Figure 2.
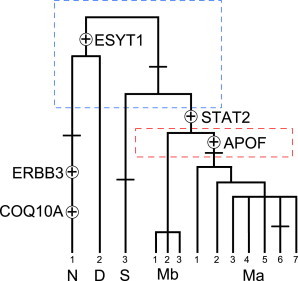
Cladogram for the Inferred Haplotypes in the Resequenced Region of STAT2
The nomenclature of the haplotypes follows Table 1. Nonsynonymous mutations are indicated with a cross hatch if they are predicted as benign and with a cross within a circle and the name of the gene if they are predicted as functional. The mutation at COQ10A is restricted to the short variant of N, and it is unknown whether the mutation at ERBB3 was present in the long variant of N before the origin of the short variant. The presence of the mutation at ESYT1 in the ancestry of D was inferred by the association of D with the Denisova sequence. The additional resolution obtained through analysis of an extended genomic sequence in two samples not included in the resequencing panel (NA19026 and KB1) is highlighted in boxes indicated with dashed lines. For example, a mutation at position 55,027,495 is shared by the M and S clades, a mutation at position 54,799,412 is shared by Neanderthal and Denisova, and a mutation at position 55,041,325 is shared by haplotypes in the Ma clade (Table S3). Two recombinant haplotypes (i.e., between haplotypes in clades M and N and clades M and S) are not shown.
Nucleotide Diversity at STAT2
In the resequencing panel, levels of polymorphism within the 8,606 bp of sequence generated within and around STAT2 (∼0.03%–0.04% per base, Table 2) are lower than the genome average (∼0.1% per base).13 This result holds when the analysis is restricted to the noncoding sequences of STAT2 (Table 2 and Figure 1C). Notably, although they are still lower than the genome average, values of STAT2 nucleotide diversity are highest in the San (θ = 0.043 ± 0.018 and π = 0.049) and in Papuans (θ = 0.040 ± 0.016 and π = 0.050). Additionally, these two population samples exhibit the highest Tajima’s D values (0.55 and 0.79, respectively) (Table 2). In a comparison with 61 noncoding loci sequenced in the same populations,12 the STAT2 locus shows reduced polymorphism in all three sub-Saharan African samples, as well as in the Han Chinese, but not in our samples of French Basque or Papua New Guineans (Figure S2).
Table 2.
Nucleotide Diversity at STAT2
| Population | na |
All Amplicons (8,606 bp) |
Noncoding (6,027 bp) |
||||||||
|---|---|---|---|---|---|---|---|---|---|---|---|
| S | θ (%) | π (%) | TD | S | θ (%) | π (%) | TDb | θ/ Dc | π/ Dc | ||
| Biaka | 32 | 10 | 0.029 | 0.030 | 0.16 | 7 | 0.029 | 0.039 | 0.95 | 0.029 | 0.038 |
| Mandenka | 32 | 13 | 0.038 | 0.034 | −0.30 | 11 | 0.046 | 0.039 | −0.49 | 0.045 | 0.038 |
| San | 20 | 13 | 0.043 | 0.049 | 0.55 | 8 | 0.038 | 0.036 | −0.15 | 0.038 | 0.035 |
| Papuans | 32 | 14 | 0.040 | 0.050 | 0.79 | 12 | 0.050 | 0.064 | 0.89 | 0.049 | 0.063 |
| Han | 32 | 10 | 0.029 | 0.007 | −2.34 | 10 | 0.042 | 0.011 | −2.34 | 0.041 | 0.010 |
| Basque | 32 | 14 | 0.040 | 0.024 | −1.35 | 13 | 0.054 | 0.032 | −1.36 | 0.053 | 0.031 |
Number of chromosomes in the sample.
Tajima’s D.
Divergence calculated between human and chimpanzee reference sequences.
LD in the Vicinity of STAT2
The tree-like structure within the 8.6 kb of sequence data analyzed in Figure 2 is consistent with strong LD in the vicinity of STAT2. To explore how far LD extends along the chromosome and to assess whether observed LD in the region of STAT2 could be the consequence of a recent bottleneck in non-Africans, we performed a haploblock analysis of SNP-based haplotypes present in ten populations of HapMap phase III. Some non-African chromosomes are characterized by an approximately 260 kb haploblock, whereas others contain a shorter 130 kb haploblock that is nested within the longer block (Figure 1). Neither version of this haploblock is present in the African HapMap data, where the average length of LD is much shorter (Figure S3). The short and long haploblocks match haplotypes that are members of the N clade. Thus, we refer to these haplotypes as short and long variants of N. The short variant is present in all non-African populations, whereas the long variant is found only in East Asians, especially Japanese (Figure S3). The individual NA18956, whose sequence is used in a more detailed analysis below, is heterozygous for the short and long variants of the N lineage. This sample was chosen because (1) it was sequenced to high coverage (e.g., > 40×), and (2) it is homozygous for the N lineage at STAT2. The maximal genetic distance between markers at the ends of the short variant is ∼0.032 cM. The 95% upper bound for the time of maintenance of this haplotype is estimated at ∼235 kya. Analogously, for the long variant, the genetic length is ∼0.081 cM, resulting in a 95% upper bound of 92 kya.
Comparisons with the Draft Neanderthal Sequence
For all positions within the 130 kb short block with coverage in the Neanderthal draft genome sequence (Figure 1), we compared the sequences of NA18956, the human reference, the chimpanzee reference, and Neanderthal. Wherever the human reference has the derived state at a given site, the Neanderthal sequence shares the ancestral state with NA18956. The Neanderthal sequence matches NA18956 at 32 out of the 36 positions at which NA18956 is homozygous derived.
To assess whether the 130 kb that are unique to the long block also match Neanderthal sequence (i.e., from 54,770,000 to 54,913,000), we compared the sequences of NA18956, the human reference, a Papuan individual homozygous for the N lineage (HGDP00542), and chimpanzee references as an outgroup (i.e., to infer ancestral state). We chose to analyze variants in NA18956 because it has the highest sequence coverage among individuals carrying the N/Neanderthal lineage. We considered only sites at which the best alignment quality of a Neanderthal read was 60 or more. In 86% of the cases (18/21) where a variant in NA18956 was ancestral (i.e., where it differed from the human reference and was shared with the chimpanzee reference), we found the Neanderthal variant to be ancestral. Analogously, for 86% (19/22) of the sites at which NA18956 and HGDP00542 shared the derived allele, we found the Neanderthal variant to be derived (Table S5). The overall pattern of similarity between the N lineage and the Neanderthal lineage over the long block suggests that the entire 260 kb introgressed from the Neanderthal lineage. Finally, Denisova and Neanderthal sequences agree at eight of the 20 sites at which both Neanderthal and Denisova have sequence coverage and Neanderthal sequence is derived.
Divergence Time of Neanderthal and N Clade Sequences
We used variant sites between positions 54,913,000 and 55,040,500 in the public WGS panel to estimate divergence time between the Neanderthal and N clade lineages. We used a maximum-likelihood approach to estimate the times of divergence both between the Neanderthal and NA18956 sequences and between each of these sequences and the human reference (Figure 3). The Neanderthal-N lineage divergence time is necessarily more recent because the sequences of NA18956 and Neanderthal share several derived mutations. If we assume a divergence time for human and chimpanzee sequences of 6 Mya, the estimated times of sequence divergence for the reference-Neanderthal comparison and the NA18956-Neanderthal comparison are 609 kya (501–731 kya, 95% CI) and 78 kya (25–159 kya, 95% CI), respectively. The sequences of the short and long variants observed in NA18956 diverged ∼22 kya (6–56 kya, 95% CI) (Table 3).
Figure 3.
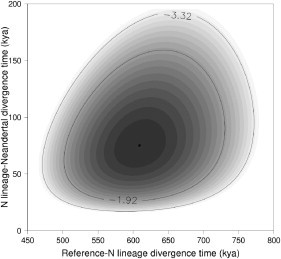
Joint Log-Likelihood for the Divergence Times between the Sequences of NA18956 and the Human Reference and between the Sequence of NA18956 and the Published Neanderthal Sequence
Table 3.
Times of Divergence between Pairs of Haplotype Lineages
| Haplotype Lineage 1 (individual) | Haplotype Lineage 2 (Individual) | Divergence Time in kya (95% CI) |
|---|---|---|
| N (NA18956) | Mb (reference) | 609 (501–731) |
| N (NA18956) | Neanderthal | 78 (25–159) |
| N-short (NA18956) | N-long (NA18956) | 22 (6–56) |
Elevated Frequency of the Long Variant of N among Papuans
We used data from the genotyping and public SNP panels (see Subjects and Methods) to investigate the global distribution of N haplotypes. Although N lineages are broadly distributed across non-African populations and distributed in North African Mozabites at an average frequency of 5% (Figure 4 and Table S6), they are 10 times more frequent in Melanesian populations (∼54%). To determine the relative prevalence of the short and long variants of the N lineage, we examined the subset of populations (i.e., 30 populations from HGDP) with sufficient genotyping information to distinguish them. Table S6 shows that the long variant is present in East Asian (14/748 chromosomes) and Oceanian (22/56 chromosomes) populations (but it never reaches frequencies higher than 10% in samples with n > 10 in East Asia) and that it is absent in South Asian, Southeast Asian, western Eurasian, and North African populations. In Papua New Guinea, where the N lineage is most frequent (Table S6), the long variant predominates, accounting for ∼85% of N lineage haplotypes.
Figure 4.
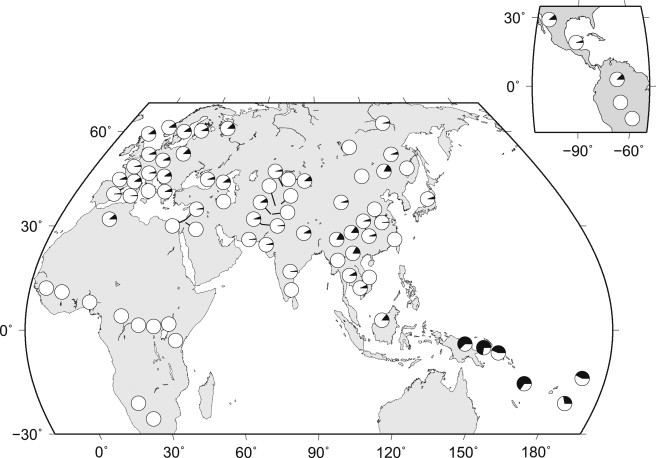
Geographic Distribution of the N Lineage
The N lineage is shown in the filled region of the pie chart.
The significance of the large difference in frequency of the long variant of the N lineage between Melanesian and East Asian populations was tested as follows. When scored on chromosomes carrying the N lineage, the SNP at rs7962107 distinguishes between the short and long variants. We performed a test that controls for demography by comparing the derived allele frequency at rs7962107 between Melanesian and East Asian populations as described in the Subjects and Methods (Figure 5). The derived allele frequency of rs7962107 is significantly high (p ≈ 0.02) in Papuans, close to significant in Nasioi (p ≈ 0.06), and remains significant in Papuans after a Bonferroni correction for combining these two tests.
Figure 5.
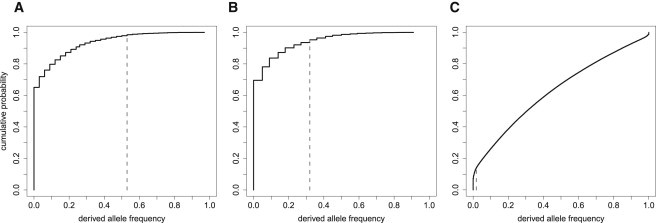
Cumulative Distribution Function for Derived Allele Frequencies
For (A) Papuans and (B) Nasioi, the distribution is conditional on the observed derived allele frequency of the SNP rs7962107 in East Asians. The gray bar indicates the observed frequency f of rs7962107 for the HGDP samples in the public SNP panel. Panels (A) and (B) are based on 6,213 SNPs, whereas panel (C), for East Asians, is based on 660,219 SNPs.
Comparisons with the Denisova Draft Genome
We also compared the draft Denisova sequence with our resequencing data (Table 1). For the ∼8 kb of Denisova sequence coverage within the 18.8 kb spanning STAT2 in Figure 1C, haplotype D agrees with the Denisova sequence at all 20 segregating sites. Based on the observed ∼0.8% divergence from the chimpanzee sequence and the assumption of a Poisson distribution of the number of mutations separating two lineages, we estimate that the total evolutionary time separating the D and Denisova sequences is 0–570 kya (95% CI). We can estimate their TMRCA by considering the age of the Denisova fossil, which could be older than 50 kya.2 If we assume that the remains are more recent than 100 ky old, the upper bound for the age of the most recent common ancestor of Denisova and the D lineage is 335 kya. In a survey of SNPs diagnostic for the D lineage (position 55,030,502, Table S4) in 108 Melanesians (49 Papuans, 16 Nasioi, 23 Vanuatuans, and 20 New Britain Islanders) from the resequencing and the genotyping panels, we did not identify any more individuals carrying the D lineage than had been found in our initial resequencing survey (i.e., the three chromosomes in the resequencing panel).
Discussion
Evidence for Neanderthal Introgression at STAT2
We provide several lines of evidence that the N lineage of the STAT2 locus introgressed into the genome of anatomically modern humans from Neanderthals. First, N matches the Neanderthal sequence at all 18 sites that fall within the resequenced 8.6 kb STAT2 region and have Neanderthal sequence coverage (Table 1). Second, N lineages are broadly distributed at relatively low frequencies in Eurasian populations (Figure 3) and are not observed in sub-Saharan African populations (Table S6). Third, the N haplotype extends for ∼130 kb in West Eurasians and up to ∼260 kb in some East Asians and Melanesians, producing much stronger LD than that observed in sub-Saharan Africans. The LD-based 95% one-sided confidence intervals for the time the N lineage has been evolving in the same population as other human sequences are 235 ky and 92 ky for the short and long variants, respectively. Given that the N lineage and the reference sequence diverged ∼600 kya, these results suggest that population structure has influenced the recent evolution of this locus. Balancing selection alone is not expected to maintain this extent of LD and consequently is not sufficient to explain these patterns. Moreover, although a strong bottleneck could generate extended LD similar to the levels we observe near STAT2 in non-Africans, it would not explain why the N lineage went extinct in Africa (i.e., why the SNPs associated with the N lineage in non-Africans were not observed in sub-Saharan Africans that are part of our WGS or public SNP panels). These observations meet a priori expectations that introgressive alleles produce extended LD and that most alleles that introgressed outside of Africa should be at lower frequency in sub-Saharan Africans.4,27 Perhaps the most definitive piece of evidence supporting archaic introgression is the recent common ancestry between Neanderthal and contemporary N lineage sequences. The estimated upper 95% CI for the divergence time between Neanderthal and N sequences (∼160 kya) corresponds to a time that postdates current estimates of the divergence time for the populations leading to AMH and Neanderthals.1 This makes ancestral shared polymorphism an unlikely explanation for the similarity between Neanderthal and AMH STAT2 haplotypes. Depending on the process of archaic admixture, Neanderthal alleles might have introgressed independently in different non-African populations.28 Although we observe two variants of this haplotype (long and short), a TMRCA of ∼22 kya (upper 97.5% of 56 kya) suggests that the short variant resulted from recombination after introgression of the long haplotype from Neanderthals (i.e., rather than from separate introgression processes).
We point out that although a recent common ancestry between a human lineage and Neanderthal sequences might indicate gene flow between Neanderthals and modern humans, this information alone does not inform us about the direction of gene flow. With the additional evidence of the observed extent of LD in modern human sequences, it is possible to infer that the N lineage introgressed into modern humans (either from Neanderthals or another archaic source that contributed to both Neanderthals and AMH). Although two X-linked haplotypes previously predicted to be introgressive27,29 were more recently shown to share derived SNPs with the Neanderthal sequence,30,31 the case of STAT2 is the first to show both a recent TMRCA and gene flow from archaic to modern humans.
Interestingly, a rare haplotype observed only in Papuans shares all ancestral and derived sites with the Denisova sequence. Estimates of the time of divergence of the D lineage and the Denisova sequence suggest a recent common ancestor (i.e., ∼300 kya). The presence of Denisova-like sequences in Papuans has been found for another locus, OAS1 (MIM 164350),32 and is consistent with results of genome-wide surveys suggesting that the signal of Denisova admixture might be limited to Melanesia and a few neighboring island southeast Asian populations.32,33
Positive Selection on the Introgressed N Lineage in Melanesia
Green et al.1 estimated a Neanderthal genetic contribution to non-Africans of about 1%–4%, and more recently Reich et al.2 estimated the Neanderthal ancestry of Melanesians at about 1%. The observed occurrence of the introgressive allele of STAT2 in Eurasians is in line with these estimates. For example, the frequency of the N lineage typically varies between 2% and 9% in Eurasian populations (Figure 4). In contrast, the average frequency of this lineage in Melanesia (54%) is approximately ten times higher than the mean Eurasian frequency of ∼5%. Moreover, the long variant comprises ∼85% (17/20) of Papuan N chromosomes, but it only makes up ∼2% (14/748) of East Asian N chromosomes. We find that the elevated frequency of the long variant cannot be explained by demographic processes alone, suggesting that positive selection has acted to increase the frequency of the N lineage in Melanesia. However, given the length of LD associated with the introgressive haplotype in Melanesia, it is not clear that the target of selection was at STAT2.
There are four nonsynonymous mutations differentiating the ∼260 kb introgressive haplotype from African haplotypes. Two of these variants are less likely to be the target of selection on the N lineage in Papuans because they do not lead to a predicted change in function (horizontal lines on branches in Figure 2). Nonsynonymous mutations in the long variant that are predicted to have functional effects are found in ERBB3 (MIM 190151) and ESYT1 (Table 4). The Neanderthal genome shares the derived state at ESYT1 but has no sequence coverage at the candidate site in ERBB3. A single nonsynonymous substitution with potential functional effects distinguishing the N lineage from most African haplotypes and the other Eurasian haplotypes is also found in STAT2; however, this difference is also shared by the short variant (Figure 1).
Table 4.
Nonsynonymous Mutations Possibly Influencing the Genealogy of STAT2
| Gene | Lineage | Mutation Position (hg18) | Amino Acid Substition | Effecta | Descriptionb |
|---|---|---|---|---|---|
| ERBB3 | N | 54,781,290 | p.Arg1042His | probably damaging | protein kinase |
| ESYT1 | N + D | 54,818,985 | p.Ser848Trp | probably damaging | membrane trafficking |
| ANKRD52 | N | 54,923,242 | p.Ser1061Thr | benign | protein binding |
| COQ10A | N | 54,947,172 | Met1-c | possibly damaging | mitochondrial |
| PAN2 | Ma | 55,008,327 | p.Leu179Ile | benign | 3′–5′ exoribonuclease |
| STAT2 | S | 55,023,522 | p.Gly825Asp | benign | signal transducer |
| STAT2 | M | 55,026,949 | p.Ile594Met | possibly damaging | “ |
| STAT2 | Ma | 55,029,264 | p.Ile464Val | benign | “ |
| APOF | Ma | 55,041,325 | p.Ile311Thr | possibly damaging | lipid transport |
| APOF | S + M | 55,041,724 | p.Gly178Ala | benign | “ |
Mutations are indicated with respect to the inferred ancestral state. When multiple isoforms are present, the position corresponds to the longest isoform.
As predicted by Polyphen 2. The prediction of some variants as damaging might only indicate a change in function.
From Gene Ontology.
Results in a truncated protein for the isoform with 243 amino acids. The reading frame is preserved.
The variant within ERBB3 affects the intracellular domain of the tyrosine-kinase-type cell-surface receptor ERBB3 (p.Arg1042His; Table 4), changing a residue that is highly conserved in mammals. ERBB3 and ERBB2 form a heterodimer that plays an important role in cell growth, survival, and differentiation and in the suppression of apoptosis.34 ESYT1, which has ubiquitous expression, encodes for the extended synaptotagmin-like protein 1 (ESYT1), a type I transmembrane protein.35,36 It has been recently shown that the expression of ESYT1 is dramatically induced during differentiation of fibroblasts into adipocytes. The variant on the N lineage (p.Ser848Trp; Table 4) affects a residue generally conserved in primates. Interestingly, the Denisova sequence also encodes tryptophan at this position (Figure 2). STAT2 plays a crucial role in one of the JAK-STAT pathways of interferon signaling. Its proper function involves the recognition of phosphorylated tyrosines through its SH2 domain. The observed mutation with potential for functional effects in STAT2 (p.Ile594Met) affects a residue annotated in GenBank as belonging to the SH2 domain.
The identification of specific introgressive variants can shed light on the phenotypic changes brought about by archaic admixture and the role that natural selection may play in the process of genetic introgression. In general, introgressive alleles are more likely to persist in AMH if they were selected at the time of hybridization. However, even alleles that initially behave neutrally can become adaptive at a later time in some populations, which should lead to differentiation among AMH populations at the introgressed allele. This scenario is consistent with the differentiation observed at STAT2 between Melanesian (especially Papuans) and East Asian populations (Figure S4). Despite the high frequency of the long variant of N, the introgressive haplotype is not fixed or near fixation in any of the Melanesian populations, a situation compatible with several scenarios. For example, if selection is recent, the selected allele might not have had enough time to reach fixation. Alternatively, selection might be older, but with a weak selection coefficient. It is also possible that the selected allele is subjected to some form of balancing selection. Any combination of the previous three scenarios is also possible, and distinguishing among these possibilities would require a more extensive Melanesian sequence data set and/or genotype/phenotype association studies in Melanesians. In light of the small overall genetic contribution of Neanderthals, it is remarkable that an introgressive allele reaches such a high frequency and that it does so only in populations of one region.
Acknowledgments
We thank August Woerner and Krishna Veeramah for comments on the manuscript. This research was funded by a National Science Foundation HOMINID grant (BCS-0423670) to M.F.H.
Appendix A: Calculation of Divergence Time for the Neanderthal Lineage
Here we show the joint likelihood function of the divergence time of two lineages with complete sequence coverage and the split time of one sublineage with incomplete sequence coverage, if we assume that there is a single genealogy and that the mutation rate is known. In Figure S1, the lineages with complete sequence coverage are M and N. The lineage N is more closely related to the lineage R, which has incomplete sequence coverage.
Let K1 and K2 the number of mutations since their most recent common ancestor in the lineages M and N, respectively, C be the number of the K2 mutations with sequence coverage in the lineage R, and A be the number of those C mutations at which R has the derived allele (Figure S1). The maximum possible value for C is reached when the sequence R has maximum coverage. Although A depends on K2, A is conditionally independent of K2 once C is given. If t and td are the times since the splits of M and N, and of N and R, respectively, and μ is the mutation rate, the likelihood function for t and td can be written as
Note that .
The likelihood function reaches its maximum for the values and .
To determine the range of values of td and t that are consistent with the data, we performed the calculation in a grid for the values of the parameters. For each of the parameters, we required that the log-likelihood was not smaller than 1.92 times the value for the maximum. The values for the constants in the grid search are a = 32, c = 36.5, k1+k2 = 109, and μ = 8.95 × 10⁻⁵/year.
The half integer in the values of c was chosen because out of the four heterozygous sites in NA18956, only one of them has sequence coverage in Neanderthal. The value chosen for the mutation rate uses the maximum-likelihood estimate when the divergence time between the human and chimpanzee reference sequences is 6 Mya.
Supplemental Data
Supplemental Data include four supplemental figures and six supplemental tables and can be found with this article online at http://www.cell.com/AJHG.
Supplemental Data
Web Resources
The URLs for data presented herein are as follows:
Complete Genomics Inc., http://www.completegenomics.com
Gene Ontology, http://www.geneontology.org/
Generic Mapping Tools, http://gmt.soest.hawaii.edu/
International HapMap Project http://hapmap.ncbi.nlm.nih.gov/
Online Mendelian Inheritance in Man (OMIM), http://www.omim.org
Accession Numbers
The GenBank accession numbers for the 90 sequences reported in this paper are JX178202–JX178291.
References
- 1.Green R.E., Krause J., Briggs A.W., Maricic T., Stenzel U., Kircher M., Patterson N., Li H., Zhai W., Fritz M.H. A draft sequence of the Neandertal genome. Science. 2010;328:710–722. doi: 10.1126/science.1188021. [DOI] [PMC free article] [PubMed] [Google Scholar]
- 2.Reich D., Green R.E., Kircher M., Krause J., Patterson N., Durand E.Y., Viola B., Briggs A.W., Stenzel U., Johnson P.L. Genetic history of an archaic hominin group from Denisova Cave in Siberia. Nature. 2010;468:1053–1060. doi: 10.1038/nature09710. [DOI] [PMC free article] [PubMed] [Google Scholar]
- 3.Evans P.D., Mekel-Bobrov N., Vallender E.J., Hudson R.R., Lahn B.T. Evidence that the adaptive allele of the brain size gene microcephalin introgressed into Homo sapiens from an archaic Homo lineage. Proc. Natl. Acad. Sci. USA. 2006;103:18178–18183. doi: 10.1073/pnas.0606966103. [DOI] [PMC free article] [PubMed] [Google Scholar]
- 4.Hawks J., Cochran G., Harpending H.C., Lahn B.T. A genetic legacy from archaic Homo. Trends Genet. 2008;24:19–23. doi: 10.1016/j.tig.2007.10.003. [DOI] [PubMed] [Google Scholar]
- 5.Hardy J., Pittman A., Myers A., Gwinn-Hardy K., Fung H.C., de Silva R., Hutton M., Duckworth J. Evidence suggesting that Homo neanderthalensis contributed the H2 MAPT haplotype to Homo sapiens. Biochem. Soc. Trans. 2005;33:582–585. doi: 10.1042/BST0330582. [DOI] [PubMed] [Google Scholar]
- 6.Abi-Rached L., Jobin M.J., Kulkarni S., McWhinnie A., Dalva K., Gragert L., Babrzadeh F., Gharizadeh B., Luo M., Plummer F.A. The shaping of modern human immune systems by multiregional admixture with archaic humans. Science. 2011;334:89–94. doi: 10.1126/science.1209202. [DOI] [PMC free article] [PubMed] [Google Scholar]
- 7.Reed D.L., Smith V.S., Hammond S.L., Rogers A.R., Clayton D.H. Genetic analysis of lice supports direct contact between modern and archaic humans. PLoS Biol. 2004;2:e340. doi: 10.1371/journal.pbio.0020340. [DOI] [PMC free article] [PubMed] [Google Scholar]
- 8.Takahata N., Nei M. Allelic genealogy under overdominant and frequency-dependent selection and polymorphism of major histocompatibility complex loci. Genetics. 1990;124:967–978. doi: 10.1093/genetics/124.4.967. [DOI] [PMC free article] [PubMed] [Google Scholar]
- 9.Thomson G. HLA population genetics. Baillieres Clin. Endocrinol. Metab. 1991;5:247–260. doi: 10.1016/s0950-351x(05)80126-0. [DOI] [PubMed] [Google Scholar]
- 10.Reich N.C. STAT dynamics. Cytokine Growth Factor Rev. 2007;18:511–518. doi: 10.1016/j.cytogfr.2007.06.021. [DOI] [PMC free article] [PubMed] [Google Scholar]
- 11.Li Y., Begovich A.B. Unraveling the genetics of complex diseases: Susceptibility genes for rheumatoid arthritis and psoriasis. Semin. Immunol. 2009;21:318–327. doi: 10.1016/j.smim.2009.04.002. [DOI] [PubMed] [Google Scholar]
- 12.Hammer M.F., Woerner A.E., Mendez F.L., Watkins J.C., Cox M.P., Wall J.D. The ratio of human X chromosome to autosome diversity is positively correlated with genetic distance from genes. Nat. Genet. 2010;42:830–831. doi: 10.1038/ng.651. [DOI] [PubMed] [Google Scholar]
- 13.Wall J.D., Cox M.P., Mendez F.L., Woerner A., Severson T., Hammer M.F. A novel DNA sequence database for analyzing human demographic history. Genome Res. 2008;18:1354–1361. doi: 10.1101/gr.075630.107. [DOI] [PMC free article] [PubMed] [Google Scholar]
- 14.López Herráez D., Bauchet M., Tang K., Theunert C., Pugach I., Li J., Nandineni M.R., Gross A., Scholz M., Stoneking M. Genetic variation and recent positive selection in worldwide human populations: evidence from nearly 1 million SNPs. PLoS ONE. 2009;4:e7888. doi: 10.1371/journal.pone.0007888. [DOI] [PMC free article] [PubMed] [Google Scholar]
- 15.Pickrell J.K., Coop G., Novembre J., Kudaravalli S., Li J.Z., Absher D., Srinivasan B.S., Barsh G.S., Myers R.M., Feldman M.W., Pritchard J.K. Signals of recent positive selection in a worldwide sample of human populations. Genome Res. 2009;19:826–837. doi: 10.1101/gr.087577.108. [DOI] [PMC free article] [PubMed] [Google Scholar]
- 16.Lao O., Lu T.T., Nothnagel M., Junge O., Freitag-Wolf S., Caliebe A., Balascakova M., Bertranpetit J., Bindoff L.A., Comas D. Correlation between genetic and geographic structure in Europe. Curr. Biol. 2008;18:1241–1248. doi: 10.1016/j.cub.2008.07.049. [DOI] [PubMed] [Google Scholar]
- 17.Xing J., Watkins W.S., Shlien A., Walker E., Huff C.D., Witherspoon D.J., Zhang Y., Simonson T.S., Weiss R.B., Schiffman J.D. Toward a more uniform sampling of human genetic diversity: A survey of worldwide populations by high-density genotyping. Genomics. 2010;96:199–210. doi: 10.1016/j.ygeno.2010.07.004. [DOI] [PMC free article] [PubMed] [Google Scholar]
- 18.Schuster S.C., Miller W., Ratan A., Tomsho L.P., Giardine B., Kasson L.R., Harris R.S., Petersen D.C., Zhao F., Qi J. Complete Khoisan and Bantu genomes from southern Africa. Nature. 2010;463:943–947. doi: 10.1038/nature08795. [DOI] [PMC free article] [PubMed] [Google Scholar]
- 19.Tajima F. Statistical method for testing the neutral mutation hypothesis by DNA polymorphism. Genetics. 1989;123:585–595. doi: 10.1093/genetics/123.3.585. [DOI] [PMC free article] [PubMed] [Google Scholar]
- 20.Librado P., Rozas J. DnaSP v5: A software for comprehensive analysis of DNA polymorphism data. Bioinformatics. 2009;25:1451–1452. doi: 10.1093/bioinformatics/btp187. [DOI] [PubMed] [Google Scholar]
- 21.. Wilgenbusch, J.C., and Swofford, D. (2003). Inferring evolutionary trees with PAUP∗. In Current Protocols in Bioinformatics, Chapter 6, Unit 6.4. [DOI] [PubMed]
- 22.Zhang K., Jin L. HaploBlockFinder: Haplotype block analyses. Bioinformatics. 2003;19:1300–1301. doi: 10.1093/bioinformatics/btg142. [DOI] [PubMed] [Google Scholar]
- 23.Hinch A.G., Tandon A., Patterson N., Song Y., Rohland N., Palmer C.D., Chen G.K., Wang K., Buxbaum S.G., Akylbekova E.L. The landscape of recombination in African Americans. Nature. 2011;476:170–175. doi: 10.1038/nature10336. [DOI] [PMC free article] [PubMed] [Google Scholar]
- 24.Karafet T.M., Mendez F.L., Meilerman M.B., Underhill P.A., Zegura S.L., Hammer M.F. New binary polymorphisms reshape and increase resolution of the human Y chromosomal haplogroup tree. Genome Res. 2008;18:830–838. doi: 10.1101/gr.7172008. [DOI] [PMC free article] [PubMed] [Google Scholar]
- 25.Mendez F.L., Karafet T.M., Krahn T., Ostrer H., Soodyall H., Hammer M.F. Increased resolution of Y chromosome haplogroup T defines relationships among populations of the Near East, Europe, and Africa. Hum. Biol. 2011;83:39–53. doi: 10.3378/027.083.0103. [DOI] [PubMed] [Google Scholar]
- 26.Wessel P., Smith W.H.F. New, improved version of generic mapping tools released. Eos Transactions, American Geophysical Union. 1998;79:579. [Google Scholar]
- 27.Garrigan D., Mobasher Z., Severson T., Wilder J.A., Hammer M.F. Evidence for archaic Asian ancestry on the human X chromosome. Mol. Biol. Evol. 2005;22:189–192. doi: 10.1093/molbev/msi013. [DOI] [PubMed] [Google Scholar]
- 28.Currat M., Excoffier L. Strong reproductive isolation between humans and Neanderthals inferred from observed patterns of introgression. Proc. Natl. Acad. Sci. USA. 2011;108:15129–15134. doi: 10.1073/pnas.1107450108. [DOI] [PMC free article] [PubMed] [Google Scholar]
- 29.Zietkiewicz E., Yotova V., Gehl D., Wambach T., Arrieta I., Batzer M., Cole D.E., Hechtman P., Kaplan F., Modiano D. Haplotypes in the dystrophin DNA segment point to a mosaic origin of modern human diversity. Am. J. Hum. Genet. 2003;73:994–1015. doi: 10.1086/378777. [DOI] [PMC free article] [PubMed] [Google Scholar]
- 30.Yotova V., Lefebvre J.F., Moreau C., Gbeha E., Hovhannesyan K., Bourgeois S., Bédarida S., Azevedo L., Amorim A., Sarkisian T. An X-linked haplotype of Neandertal origin is present among all non-African populations. Mol. Biol. Evol. 2011;28:1957–1962. doi: 10.1093/molbev/msr024. [DOI] [PubMed] [Google Scholar]
- 31.Hammer M.F., Woerner A.E., Mendez F.L., Watkins J.C., Wall J.D. Genetic evidence for archaic admixture in Africa. Proc. Natl. Acad. Sci. USA. 2011;108:15123–15128. doi: 10.1073/pnas.1109300108. [DOI] [PMC free article] [PubMed] [Google Scholar]
- 32.Mendez F.L., Watkins J.C., Hammer M.F. Global genetic variation at OAS1 provides evidence of archaic admixture in Melanesian populations. Mol. Biol. Evol. 2012;29:1513–1520. doi: 10.1093/molbev/msr301. [DOI] [PubMed] [Google Scholar]
- 33.Reich D., Patterson N., Kircher M., Delfin F., Nandineni M.R., Pugach I., Ko A.M., Ko Y.C., Jinam T.A., Phipps M.E. Denisova admixture and the first modern human dispersals into Southeast Asia and Oceania. Am. J. Hum. Genet. 2011;89:516–528. doi: 10.1016/j.ajhg.2011.09.005. [DOI] [PMC free article] [PubMed] [Google Scholar]
- 34.Baselga J., Swain S.M. Novel anticancer targets: revisiting ERBB2 and discovering ERBB3. Nat. Rev. Cancer. 2009;9:463–475. doi: 10.1038/nrc2656. [DOI] [PubMed] [Google Scholar]
- 35.Lalioti V., Muruais G., Dinarina A., van Damme J., Vandekerckhove J., Sandoval I.V. The atypical kinase Cdk5 is activated by insulin, regulates the association between GLUT4 and E-Syt1, and modulates glucose transport in 3T3-L1 adipocytes. Proc. Natl. Acad. Sci. USA. 2009;106:4249–4253. doi: 10.1073/pnas.0900218106. [DOI] [PMC free article] [PubMed] [Google Scholar]
- 36.Min S.W., Chang W.P., Südhof T.C. E-Syts, a family of membranous Ca2+-sensor proteins with multiple C2 domains. Proc. Natl. Acad. Sci. USA. 2007;104:3823–3828. doi: 10.1073/pnas.0611725104. [DOI] [PMC free article] [PubMed] [Google Scholar]
Associated Data
This section collects any data citations, data availability statements, or supplementary materials included in this article.