

Abstract
The sequencing and analysis of multiple housekeeping genes has been routinely used to phylogenetically compare closely related bacterial isolates. Recent studies using whole-genome alignment (WGA) and phylogenetics from >100 Escherichia coli genomes has demonstrated that tree topologies from WGA and multilocus sequence typing (MLST) markers differ significantly. A nonrepresentative phylogeny can lead to incorrect conclusions regarding important evolutionary relationships. In this study, the Phylomark algorithm was developed to identify a minimal number of useful phylogenetic markers that recapitulate the WGA phylogeny. To test the algorithm, we used a set of diverse draft and complete E. coli genomes. The algorithm identified more than 100,000 potential markers of different fragment lengths (500 to 900 nucleotides). Three molecular markers were ultimately chosen to determine the phylogeny based on a low Robinson-Foulds (RF) distance compared to the WGA phylogeny. A phylogenetic analysis demonstrated that a more representative phylogeny was inferred for a concatenation of these markers compared to all other MLST schemes for E. coli. As a functional test of the algorithm, the three markers (genomic guided E. coli markers, or GIG-EM) were amplified and sequenced from a set of environmental E. coli strains (ECOR collection) and informatically extracted from a set of 78 diarrheagenic E. coli strains (DECA collection). In the instances of the 40-genome test set and the DECA collection, the GIG-EM system outperformed other E. coli MLST systems in terms of recapitulating the WGA phylogeny. This algorithm can be employed to determine the minimal marker set for any organism that has sufficient genome sequencing.
INTRODUCTION
Multilocus sequence typing (MLST) has been used for decades as a tool to discriminate between closely related strains of the same species based on molecular methods (13, 23). In traditional MLST, multiple housekeeping genes, which are well conserved in bacterial species, are selected as molecular markers, sequenced, and compared to housekeeping genes of other isolates of the same species. PCR primers are included with each system, so markers from a new isolate can be amplified and comparable results can be obtained with a sequenced reference set of isolates. Culture collections can then be screened by PCR/sequencing, and information can be obtained about new isolates at reasonable cost without performing whole-genome sequencing on the entire collection. Typing schemes are created by which isolates are binned into sequence types (STs) and clonal groups (CGs) based on sequence similarity for each loci (26). Additionally, researchers can then concatenate the MLST sequences, perform a pairwise alignment, and infer a phylogenetic tree for the examined isolates of any species (9, 13). However, recent studies have demonstrated that phylogenies inferred from concatenated MLST sequences can be incorrect, especially at deeply branching nodes (12, 21); this may or may not affect the results of a study depending on the stated hypothesis.
With the advent of massively parallel whole-genome sequencing, we have access to large volumes of genomic data, especially from well-studied organisms, such as Escherichia coli and Acinetobacter baumannii. With improved algorithms for whole-genome alignment, such as Mugsy (2) and progressive Mauve (4), we can obtain unprecedented detail into the phylogenetic relationships of isolates at the genome level. Additionally, with the decreasing cost of second- and third-generation sequencing, genomic data are being made readily available to most laboratories at moderate cost.
Until all new bacterial isolates are routinely and systematically sequenced, experiments that use a small number of markers to bin novel isolates will have utility. The purpose of this study was to identify conserved genomic markers from a whole-genome alignment that more accurately capture the topology of whole-genome phylogeny compared to the phylogeny inferred by gene-based MLST systems. Because of sequencing costs, strains are frequently chosen for whole-genome sequencing based on unique MLSTs (21). If fewer markers could be sequenced to produce a more accurate phylogeny than the MLST phylogeny, then fewer resources would be required prior to targeted genomic sequencing projects to efficiently identify the most relevant isolates for either a phylogenetic targeted group or a global distribution. This approach will provide the opportunity to select isolates that most appropriately meet the needs of the project at hand.
MATERIALS AND METHODS
Phylomark algorithm.
Phylomark was designed to find accurate phylogenetic markers from a whole-genome alignment (WGA). Genomes, either draft and/or finished, are first aligned with Mugsy (2); alignments can also be generated with Progressive Mauve (4) as long as they are converted into the multiple alignment format (MAF) (3). The MAF file was parsed so that it only contained genomic blocks from all input genomes. This reduced MAF file was then converted into fasta format, with all blocks concatenated. The resulting file is a concatenated multi-fasta, with one sequence represented for each genome. The program mothur (22) was then used to remove any column from the alignment that contained a gap; this removed missing regions in genomes as well as small insertions/deletions (indels).
A sliding window approach was employed on the concatenated WGA, slicing the alignment into fragments of a desired length and step size. An alignment filter was then calculated in mothur to find polymorphic positions in the alignment. The output mask contains a 1 for a polymorphic position and a 0 for a totally conserved position. The mask was sliced with the same sliding window method into fragments of the same length as the nucleotide sequence; a complete workflow of the algorithm is shown in Fig. 1.
Fig 1.
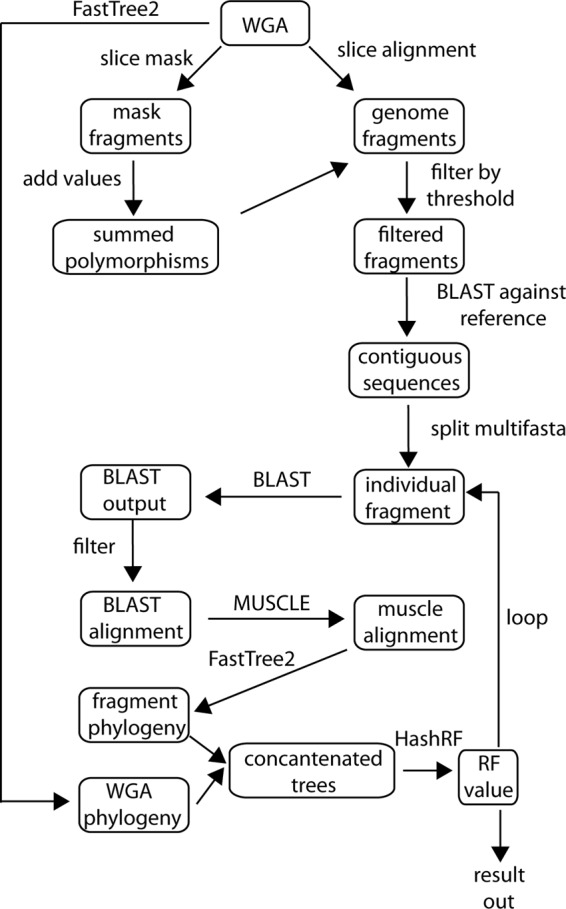
Workflow of the Phylomark algorithm. There are five input files required for Phylomark to run; all five files are dependent on a whole-genome alignment. Published algorithms are used for local alignment (BLAST), pairwise alignment (MUSCLE) (6), tree building (FastTree2) (16), and calculation of Robinson-Foulds distance (HashRF) (25).
The masked fragments were then individually summed; the summed value represents the number of polymorphic positions per fragment. The sequence fragments were then removed from further analysis if they did not contain a minimum number of polymorphic positions; this value is provided by the user as an input variable. This greatly reduces the number of genomic fragments to screen if they contain insufficient phylogenetic information.
Each remaining genomic fragment was then aligned with BLAST (1) against a reference genome contained in the alignment to verify that the fragment was contiguous. Because the WGA is a concatenation of homologous blocks, this step is needed to verify that the fragment does not span noncontiguous genomic regions. A loop was then performed in which each fragment was aligned with BLAST against a database of all genomes that were part of the initial whole-genome alignment. The reference alignment for each query fragment was parsed from the BLAST output, and a multi-fasta file was created. A pairwise alignment of each fragment from all examined genomes was performed with MUSCLE (6), and a tree was inferred with FastTree2 (16). The resulting tree was concatenated with the WGA tree, and the Robinson-Foulds (RF) (20) distance was calculated with HashRF (25). The RF metric compares nodes between two phylogenetic trees; the lower the RF value, the more similar the topology. The results file from the Phylomark script lists each genome fragment identity, the RF value, and the number of polymorphisms present.
The Phylomark Python script is publically available (https://sourceforge.net/projects/phylomark/). The script requires 5 input files: the concatenated alignment from the original MAF file, a filter mask from mothur, the WGA tree in Newick format, a multi-fasta file of all genomes incorporated into the WGA, and one reference sequence fasta file from the WGA. User input parameters that can be changed include the fragment length (default, 500 nucleotides), the step size for slicing sequences (default, 5), the minimum number of polymorphic positions to keep from a sequence fragment (default, 50), and the number of processors to use on the job (default, 2). An additional script, Phylomark_prep.py, is also included with the Phylomark package; this script generates Phylomark input files from an input MAF file.
An additional script (Phylomark_R.py) has also been made available. This script has the same functionality as the original Phylomark algorithm but also populates a table for each marker that demonstrates the base frequency at each position in the alignment. The script generates a PDF file that displays a cluster dendrogram of the alignment and base conservation across the entire length of each interrogated fragment. This script takes longer to complete the analysis and generates two additional files for each genomic fragment; settings should be optimized to prevent the generation of an excessive number of additional files. This information can be important for researchers looking at the base conservation in specific genomic fragments.
Whole-genome alignment and phylogeny.
E. coli was selected as a test case for the Phylomark algorithm. Forty draft and complete E. coli genomes were downloaded from GenBank (see Table S1 in the supplemental material) and were aligned with Mugsy (2). Only MAF alignment blocks that contained homologous sequence from all genomes were parsed from the alignment with bx-python (https://bitbucket.org/james_taylor/bx-python/wiki/Home). Conserved MAF blocks were converted to fasta format and concatenated. Any column that contained a gap was removed from the alignment using mothur. The resulting alignment consisted of ∼2.7 Mbp of conserved genomic sequence. A tree was then inferred on this alignment with RaxML (24); this phylogeny is referred to as the WGA phylogeny (see Fig. S1 in the supplemental material); RAxML was used to infer the tree because bootstrap support values can be estimated for each node. The tree topologies inferred on the WGA with either RaxML or FastTree2 were identical (not shown). As an initial step to identify phylogenetic markers, Phylomark was applied to genomic fragments from the E. coli WGA ranging from 500 to 900 nucleotides.
From the results, approximately 20 phylogenetic markers were selected based on the lowest calculated RF values. From the set of 20, a shell script was used to randomly select between 3 and 8 markers, concatenate their alignments, and calculate the RF metric compared to the WGA phylogeny. The trees from markers with the lowest RF values were then manually compared to the WGA tree to verify that the major lineages of E. coli were resolved. From this analysis, 4 markers of a new system (genomic guided E. coli markers, or GIG-EM) were selected for further analysis.
Primer design and PCR validation.
PCR primers were manually designed that flank the marker regions of interest. A list of primers designed and validated in this study is shown in Table 1. To test the specificity of the primers, 72 isolates from the ECOR sequence collection (14) were screened by PCR. PCRs were performed with AmpliTaq gold (Applied Biosystems); cycling conditions consisted of an initial denaturation at 94°C for 5 min, followed by 30 cycles of 94°C for 45 s, 60°C for 45 s (50°C for DPP primers), and 72°C for 1 min. Amplicons were visualized on 1% agarose gels and then purified with Diffinity rapid tips (PN RT025-096; Diffinity Genomics). Purified amplicons were sequenced on an ABI 3730 Sanger sequencer at the Institute for Genome Sciences Genome Resource Center (http://www.igs.umaryland.edu/research/grc/intro.php).
Table 1.
Oligonucleotides used in this study from markers selected by Phylomark
| Target name | Target annotation | Sequence (5′–3′) |
Amplicon size (bp) | |
|---|---|---|---|---|
| Forward | Reverse | |||
| tonB | Iron outer membrane transporter | GGCTTAGYTTGCCCTTCGGC | CATTCTCCTTTAAGCAGCGGC | 914 |
| traP | Inner membrane transport protein | GGCCATWATGATATCTGCC | TTCARGCRAACGCHGTTGC | 762 |
| DPP | Deoxyribodipyrimidine photolyase | GCTATAAACTCGTMTTTCTGGC | GGCGTAAAGACTTTGTACA | 930 |
| dinG | ATP-dependent helicase | TATTGGCTGTTTATACAGT | CTCATACARCTCTTCACAAT | 976 |
Sequence assembly.
Sanger sequences were assembled with a Python wrapper (15) for Phred (7) and Phrap (www.phrap.org). A sliding window approach was employed to find the highest quality start and stop regions for each sequence. The 25-base window was moved from the beginning and end of each contig until the first and last quality value was greater than 25. Bases at the beginning and end of each contig were discarded if they fell outside the window.
Assembled and trimmed sequences were aligned with MUSCLE (6). Sequences were trimmed to include regions that contain sequence for all 40 isolates; details about the trimmed length of chosen markers are shown in Table 2. The sequences for all amplicons for the ECOR collection are available in GenBank (accession numbers JQ283462 to JQ283677).
Table 2.
Marker presence/absence in test sets
| Primer | Trimmed length (nt) | DECA presencea (n = 78) | ECOR presenceb (n = 72) |
|---|---|---|---|
| tonB | 780 | 78 | 72 |
| traP | 724 | 78 | 56 |
| DPP | 692 | 78 | 72 |
| dinG | 813 | 78 | 72 |
Determined informatically.
Determined by PCR.
MLST systems.
Genomic markers from three different E. coli MLST systems, PubMLST (adk, fumC, gyrB, icd, mdh, purA, and recA) (28), EcMLST (aspC, clpX, fadD, icdA, lysP, mdh, and uidA) (19), and Pasteur (dinB, pabB, putB, trpB, icdA, polB, trpA, and uidA) (http://www.pasteur.fr/recherche/genopole/PF8/mlst/EColi.html), were downloaded. In addition to the current MLST systems, three markers (tyrB, torC, and gudX) were downloaded that were identified in a study of intraspecies diversity in E. coli (10). Additionally, 7 markers were identified by panseq (11) that were conserved in a subset of E. coli genomes. Sequences for all markers from each system were identified from the 40-genome test set with BLAST. Alignments were parsed from the BLAST report and aligned using MUSCLE, and a tree was inferred with FastTree2 using 1,000 bootstrap replicates for each data set.
Informatics validation.
Recently, we sequenced the 78 genomes from the DECA E. coli collection (http://www.shigatox.net/stec/cgi-bin/deca) as part of the NIAID Genome Sequencing Center for Infectious Diseases (GSCID) project (http://gscid.igs.umaryland.edu/wp.php?wp=emerging_diarrheal_pathogens). The three trimmed markers identified in this study were identified using BLAST in these genomes, and the alignments were parsed from the output. The identified sequences were aligned using MUSCLE, and a phylogenetic tree was inferred with FastTree2. MLST sequences from the PubMLST system were evaluated using the same methodology.
Subsample validation of the GIG-EM system.
To test the robustness of the 3 markers identified in the 40-genome test set, 20 genomes (see Table S1 in the supplemental material) were randomly selected from the total set with a custom script. These 20 genomes were aligned with Mugsy and processed with Phylomark using the same settings as those for the entire set. The RF values of the 3 markers were evaluated in the context of all tested markers.
Phylomark on Acinetobacter baumannii genomes.
To extend the application of the Phylomark algorithm beyond E. coli, 42 A. baumannii genomes were downloaded from GenBank (see Table S1 in the supplemental material) and aligned with Mugsy. Phylomark was run on the concatenated alignment using a fragment length of 800 nucleotides, a step size of 10, and a minimum number of polymorphisms of 20. Three markers were selected from the results, based on a low RF value compared to the WGA phylogeny; a tree was inferred from the concatenated sequences with FastTree2. The sequences from seven housekeeping genes (gltA, gyrB, gdhB, recA, cpn60, gpi, and rpoD) in the A. baumannii PubMLST system (http://pubmlst.org/) were also downloaded. All 7 alleles were informatically extracted from the 42 A. baumannii genomes; the sequences were then concatenated and aligned with MUSCLE, and a tree was inferred with FastTree2.
RESULTS
Phylomark algorithm.
Phylomark is a script written in Python and designed to identify accurate phylogenetic markers from a whole-genome alignment (WGA); a workflow of the algorithm is shown in Fig. 1. Depending on the size of the fragment, Phylomark can calculate RF values for up to 2,500 markers per h (500-bp fragment) on a single processor. This number can be linearly scaled if multiple processors are available. In this study, Phylomark was performed on a MAF file generated by Mugsy; Mugsy is a reference-independent whole-genome aligner that uses Mummer (5) to find alignment anchors and T-Coffee (18) to sequentially align homologous blocks. An additional script (Phylomark_prep.py) is included with Phylomark that will generate all necessary input files from a Mugsy WGA (2).
Fragment length correlation with RF metric.
In this study, the genomic core of 40 diverse E. coli isolates was used as input for the Phylomark algorithm. The concatenated alignment was separated into genomic fragments of 500, 600, 700, 800, and 900 nucleotides; each fragment size was run separately, and the RF values were collated. As expected, 900-nucleotide fragments generally showed lower RF values (see Fig. S2 in the supplemental material), but a range of RF values was generally observed for each marker. Specific markers of 500 bases performed well compared to all tested markers and would be amenable to rapid sequencing.
Variation in RF values across individual genes.
The results from Phylomark include genomic fragments not limited by coding region boundaries, an approach not previously undertaken with generalized typing methods. However, an approach was developed and applied to examine RF values across each gene in a selected E. coli genome using a sliding window approach. The results of Phylomark can be used to identify genes that have an uneven distribution of RF values across the gene span, which may indicate gene recombination (see Fig. S3A in the supplemental material). The results can also be used to find RF values that are consistently high across the length of a gene; this may represent the presence of homoplastic single-nucleotide polymorphisms (SNPs) (see Fig. S3B).
Polymorphism correlation with RF metric.
To test the performance of markers based on the number of polymorphisms included in each marker, the two values were plotted for an analysis of 500-bp fragments (Fig. 2). The original hypothesis was that genomic fragments with a greater number of single-nucleotide polymorphisms (SNPs) would contain more phylogenetic information and would therefore represent more discriminative phylogenetic markers. However, when the number of polymorphic positions was plotted against the RF distances, the two values were only positively correlated at low SNP levels; once the number of SNPs reached a threshold (∼85 SNPs in a 500-bp fragment), no further correlation was observed (Fig. 2). The results clearly show that the performance of the marker did not strictly depend on the number of polymorphisms.
Fig 2.
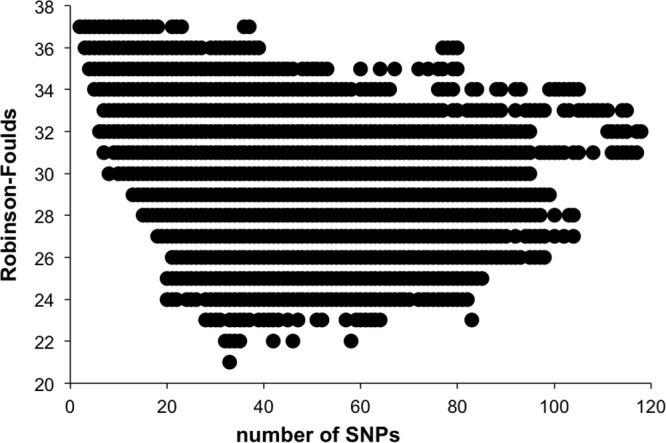
Number of single-nucleotide polymorphisms (SNPs) compared to RF value. A plot of the number of SNPs in a genomic fragment (500 bases) compared to RF values calculated from a comparison of the phylogeny of each fragment to the whole-genome phylogeny.
In addition to finding phylogenetic markers, the Phylomark algorithm can be used to identify slowly and rapidly evolving genomic fragments. For example, in an analysis of 500-nucleotide fragments, one genomic fragment associated with a gene encoding the translocation protein TolB showed only two SNPs within the diverse 40-genome test set. In contrast, a lipopolysaccharide (LPS) assembly gene showed 118 SNPs in the same test set alignment, which suggests that it is under strong selection for mutation. Further studies are under way to examine the general utility of this methodology.
Case study: E. coli.
Previously, we demonstrated that a phylogenetic tree inferred from concatenated housekeeping genes used in multilocus sequence typing (MLST), regardless of the typing system used, produces a phylogenetic tree that is not congruent with the WGA phylogeny at deeply branching nodes (21). To test the ability of Phylomark to identify more robust phylogenetic markers from a WGA, a test set of 40 diverse E. coli isolates was selected. The WGA generated an alignment of ∼2.7 Mbp of homologous sequence, which is consistent with previous pangenome calculations (17, 27). This conserved core sequence was split into a range of fragment lengths and processed with Phylomark.
Based on the results of Phylomark, a set of 4 markers was chosen that, when concatenated, returned a phylogeny that was consistent with the WGA phylogeny. In addition to the 40-genome test set, an informatic analysis demonstrated that all 4 markers were present in all recently sequenced DECA genomes (n = 78) (http://www.shigatox.net/stec/cgi-bin/deca); these genomes were not included in the original sequence alignment and represent an independent sample collection that was used to verify the phylogenetic markers identified by Phylomark.
Additionally, to functionally validate these findings, a PCR assay was performed on the ECOR reference collection (n = 72); the assay results demonstrated that three of the markers were broadly amplified from the ECOR reference collection (Table 2). However, the primers designed for the marker associated with a traP gene failed to amplify templates from 16 of the 72 ECOR isolates. An alignment of the complete traP marker with a sequenced draft genome from the ECOR14 isolate (unpublished) demonstrates that the marker appears to be truncated (not shown). As this marker was not broadly conserved in a diverse set of isolates, it was not used in subsequent analysis.
The three remaining markers were amplified and sequenced from the ECOR collection with Sanger sequencing. The phylogeny of the 3-marker system for the 40-genome test set was congruent with the WGA phylogeny (Fig. 3) and did not differ significantly from the 4-marker phylogeny (see Fig. S4 in the supplemental material). Assembled Sanger sequences were trimmed until sequence was present in all isolates; the trimmed length of each marker is shown in Table 2. The sequences were added to those extracted informatically from the 40-genome test set, and a phylogenetic tree was inferred on the complete alignment (Fig. 4); this tree also includes sequences extracted informatically from the DECA genomes.
Fig 3.

Comparison of the phylogenetic trees of commonly used typing schema. Phylogenetic trees inferred from alignments of whole-genome sequences (WGA) or concatenated markers from six MLST systems. All marker sequences were informatically extracted with BLAST from a 40-genome E. coli test set. Marker sequences were concatenated and aligned, and any column with a gap was removed; this removed sequence from genomes that lacked markers from a given MLST system. Trees were inferred with RAxML. The membership of each genome to a given phylotype was assumed from the WGA phylogeny. A color legend for each E. coli phylogroup is shown at the bottom of the figure.
Fig 4.

Phylogeny of the reference collections of Escherichia coli as determined by GIG-EM. A phylogenetic tree containing the reference sets of E. coli, including sequences from the DECA and ECOR sequence collections. The alignment was constructed by concatenating three markers from the GIG-EM system identified with Phylomark. Sequences from DECA and the 40-genome test set were extracted from whole-genome sequences, while those from the ECOR set were PCR amplified and sequenced using Sanger chemistry. Columns with gaps were removed from the alignment, and a tree was inferred with RAxML using 1,000 bootstrap replicates. Circles at nodes indicate bootstrap support values greater than 75%. Letters at nodes indicate E. coli phylogroups.
Comparison of three-marker GIG-EM system to current E. coli MLST schemes.
Multiple MLST systems are currently used for the analysis of E. coli/Shigella isolates: the PubMLST seven-gene system (28), the Pasteur eight-gene system (http://www.pasteur.fr/recherche/genopole/PF8/mlst/EColi.html), and the EcMLST 2-gene (EcMLST-2), EcMLST-7, and EcMLST-15 systems (19). Several of the same markers are used in multiple systems, resulting in a total of 27 unique markers across all systems. Each of the 27 unique markers was informatically extracted from 40 E. coli/Shigella genomes and aligned, and the resulting RF values were compiled. The results exhibit a wide range of RF values depending on the marker (Table 3). When markers for each system were concatenated and the tree was compared to the WGA phylogeny, the PubMLST system produced the lowest RF value of the standard MLST systems (Table 4). However, the GIG-EM system produced a lower RF value and was more robust when resolving deeper nodes, as determined by the WGA phylogeny (Fig. 3).
Table 3.
Comparison of genetic markers from E. coli MLST systemsb
| Marker | System | RF valuea |
|---|---|---|
| gudX | Konstantinidisf | 21 |
| tonB | GIG-EM | 22 |
| dinG | GIG-EM | 23 |
| DPP | GIG-EM | 24 |
| tyrB | Konstantinidis | 25 |
| torC | Konstantinidis | 26 |
| trpb | Pasteur | 27 |
| dprA | panseq | 28 |
| icdA | Pasteurd | 28 |
| uidA | Pasteur | 28 |
| fumC | PubMLSTe | 28 |
| clpX | EcMLST | 29 |
| icd | PubMLST | 29 |
| dnaG | EcMLST | 30 |
| grpE | EcMLST | 30 |
| mutS | EcMLST | 30 |
| trpA | Pasteur | 30 |
| adk | PubMLST | 30 |
| aspC | EcMLST | 31 |
| aroE | EcMLST | 31 |
| cyaA | EcMLST | 31 |
| gyrB | PubMLST | 31 |
| fadD | EcMLST | 32 |
| lysP | EcMLST | 32 |
| recA | PubMLST | 32 |
| pcrf3 | panseq | 33 |
| arcA | EcMLSTc | 33 |
| icdA | EcMLST | 33 |
| mdh | PubMLST | 34 |
| pabB | Pasteur | 35 |
| purA | PubMLST | 35 |
Table 4.
Comparison of MLST systems for E. colic
| System | Concatenated length (nt) | No. of polymorphisms | RF value |
|---|---|---|---|
| GIG-EM | 2,275 | 259 | 18 |
| PubMLST | 3,423 | 229 | 19 |
| Konstantinidis | 3,396 | 310 | 21 |
| STEC-15a | 6,862 | 549 | 22 |
| STEC-7 | 3,734 | 279 | 22 |
| Pasteurb | 2,741 | 265 | 24 |
| STEC-2 | 1,127 | 81 | 24 |
mltD was missing from at least 1 genome and was not used.
Either dinB, polB, or putP was missing from at least 1 genome and was not used.
Entries in bold refer to the system described in this paper.
In addition to common MLST schemes, genes were compiled from a study designed to identify a limited number of phylogenetic markers that still identified/captured intraspecies diversity in E. coli (the Konstantinidis system) (10). However, one of the markers, torC, was truncated in the Shigella boydii CDC 3083-94 genome, and thus columns were filtered for all genomes for the truncated region; this prevented the use of this gene fragment in any direct comparative analysis with GIG-EM. Furthermore, the constraints on the sequence length for the three markers were unclear from the publication, so the entire coding region was used for each marker. The results demonstrate that the GIG-EM system described in our study performed better than this three-marker system in terms of the RF value (Table 4); the phylogeny from the Konstantinidis markers mostly recovered the major phylogenetic groups (Fig. 3).
Two of the three MLST systems tested identified that there was missing sequence from at least 1 genome in the 40-genome set. For example, in the 15-gene EcMLST system, mltD is missing from Shigella dysenteriae 197. In the Pasteur system, at least one gene is missing (including dinB, polB, or putP) from complete E. coli K-12/DH10B and S. boydii 227 genomes and four separate S. flexneri isolates. Phylogenies from all systems were compared, with missing markers filtered out, and still the GIG-EM system recovered a more consistent phylogeny than the WGA phylogeny (Fig. 3). The GIG-EM system also resolved the Shigella phylogeny, most likely due to the inclusion of Shigella genomes during the design phase. The WGA phylogeny clearly shows that S. sonnei and S. boydii isolates form a monophyletic clade. Furthermore, the WGA phylogeny demonstrates the previously identified grouping of S. dysenteriae 197 with O157:H7 enterohemorrhagic E. coli (EHEC) isolates in group E (see Fig. S1 in the supplemental material). In contrast, the Pasteur, EcMLST-7, and PubMLST systems did not show group E as being monophyletic (Fig. 3).
To test the GIG-EM system on an additional set of isolates, the DECA collection was chosen, as it represents a well-studied collection of 78 diarrheagenic E. coli isolates that have MLST and other associated metadata. The genomes from these 78 isolates have recently been sequenced and allow us the opportunity to test the conservation of our genomic markers and the general performance of the Phylomark algorithm. As with the 40-genome test set, the GIG-EM system produced a lower RF value (RF, 48) than the PubMLST markers (RF, 55); however, some inconsistencies in the GIG-EM topology were still identified (see Fig. S5 in the supplemental material). Nonetheless, the topology of the tree is more similar to the WGA phylogeny using the GIG-EM system than the PubMLST system.
Extension of the Phylomark algorithm beyond E. coli.
To test the Phylomark algorithm on a different organism and demonstrate a broad utility, 42 Acinetobacter baumannii genomes were downloaded from GenBank and processed with Phylomark. Three markers were chosen based on low RF values, and a tree was inferred from a concatenation of the marker sequences. The A. baumannii-specific PubMLST sequences were extracted informatically, and a tree was inferred from the concatenation. The results demonstrate that the GIG markers identified by Phylomark (associated with locus tags ACICU_00263, ACICU_03025, and ACICU_00101) outperformed the PubMLST markers in terms of RF values (see Table S2 in the supplemental material) as well as overall topology (see Fig. S6). The WGA phylogeny of A. baumannii shows many deeply branching nodes, which complicates the complete recapitulation of the WGA phylogeny based on the analysis of a limited number of markers. This test demonstrates that the Phylomark algorithm is robust and has utility in examining the phylogeny of multiple species.
Subsample validation of the GIG-EM system.
To determine if the number of genomes included in the phylogeny would affect the efficacy of the marker identification, 20 E. coli genomes were randomly extracted from the 40-genome test set and processed with Phylomark. The GIG-EM system still performed well in this subset analysis, but not as well as other markers (see Fig. S7 in the supplemental material). However, when the best-performing markers in the 20-genome subset, considering individual RF values, were identified in the 40-genome test set, they did not perform as well as GIG-EM markers (see Fig. S7). In the 20-genome subset, the GIG-EM markers, when concatenated, produced a lower RF value (RF, 4) than the 7-marker PubMLST system (RF, 6). This demonstrates that a greater number of genomes provides a more robust phylogeny, resulting in more effective markers.
DISCUSSION
MLST remains a valuable tool in the grouping, screening, and classification of bacterial isolates. MLST markers were selected based on broad conservation across species and relatively slow accumulation of mutations; however, concatenated markers have also been applied to phylogenetic reconstruction in some species (9). With the advent of whole-genome sequencing, the MLST phylogenies have been demonstrated to be inconsistent relative to the whole-genome analyses and most likely represent an incorrect view of bacterial evolution (21). Until whole-genome sequencing is standard practice, rapid typing methods are still required to allow insight into the evolution of a species by sequencing a minimum number of genomic regions.
A Python script, named Phylomark, was developed to help in the identification of representative phylogenetic markers from a WGA of closely related isolates. This script uses published algorithms for alignment, phylogenetic reconstruction, and calculation of Robinson-Foulds (RF) distances compared to a phylogeny inferred from the WGA. Whole-genome phylogenies obtained by concatenated nucleotide alignments (21, 27) or concatenated protein alignments (8) produce comparable phylogenies (see Fig. S8 in the supplemental material); this suggests that the WGA topology is robust. Phylomark was designed for rapidly screening tens to hundreds of thousands of sequences, as this is necessary to find the most representative phylogenetic markers. The output of Phylomark can also be used to identify slowly and rapidly evolving genomic regions. These results can be used to identify evolutionary pressures on genomic regions that have specific biological functions.
To demonstrate the utility of the algorithm, three markers were identified from a WGA created from 40 diverse E. coli genomes deposited in GenBank that recapitulate the diversity of the WGA analysis. The markers were then informatically validated on a recently sequenced set of 78 diarrheagenic E. coli isolates from the DECA collection (http://www.shigatox.net/stec/cgi-bin/deca). The results demonstrate that the GIG-EM system outperformed all other MLST systems in terms of RF values, as well as conservation of E. coli phylotypes identified with the WGA phylogeny. There were, however, inconsistencies between the GIG-EM phylogeny and the WGA phylogeny; this result is not surprising, as the GIG-EM system uses ∼0.08% of the amount of sequence data as WGA and contains only ∼0.09% of the polymorphic positions in the alignment. To functionally test the GIG-EM system, all three loci were PCR amplified and sequenced from 72 isolates from the ECOR collection (http://foodsafe.msu.edu/whittam/ecor/). Sanger sequencing returned reads that were easily assembled into contigs and were combined with the 40-genome test set markers; a phylogenetic tree then showed the placement of these 72 genomes in the broader context of a diverse set of E. coli and Shigella isolates (Fig. 4).
To validate the GIG-EM markers identified by a Phylomark analysis of the 40 E. coli genomes, 20 genomes were randomly selected and processed with Phylomark. The results show that the GIG-EM markers did not perform as well as other markers with this limited data set; however, the GIG-EM markers did remarkably well in the 40-genome set, considering many of the same markers were identified from the 20-genome subset. This shows that phylogenetic markers should be designed from the largest and most diverse set of genomes available for a given species. As the complexity of the WGA tree increases, different markers will provide different kinds of phylogenetic information based on the composition of specific SNPs. These results demonstrate the importance of collating a diverse and complete data set prior to the implementation of Phylomark.
To extend the utility of the Phylomark algorithm, a collection of sequenced A. baumannii isolates was examined. As expected, the Phylomark-generated markers performed better than the MLST system that was previously utilized in this species (http://pubmlst.org/). These studies demonstrated that this methodology is applicable to more than just E. coli and closely related species. Overall, the Phylomark algorithm appears to be a robust and effective method to identify phylogenetically useful markers.
The purpose of this study was not to design yet another typing system for E. coli, or any other well-studied organism, but rather to identify the smallest number of genomic markers that could recover a topology similar to that of a whole-genome alignment. When a novel isolate collection is screened for targeted genome sequencing, markers identified from this algorithm can be used to select representative isolates from specific branches on a phylogenetic tree. Concatenated alignments from housekeeping genes have been used extensively to define phylogenetic relationships of E. coli (26); the results from the current study suggest that these phylogenies are not consistent with the WGA phylogeny (21). If a three-marker system is used, compared to a seven-marker system, up to eight fewer sequencing reactions are needed for each isolate and will still result in a more accurate phylogeny. This is a significant savings in time, effort, money, and reagents.
Other studies have been conducted to identify representative phylogenetic markers from whole-genome alignments. One study identified three phylogenetic markers in E. coli based on average nucleotide identity (10). However, the lengths of these markers (>1 kb) may be impractical for rapid sequencing and analysis. Additionally, these markers do not perform as well as the GIG-EM markers based on RF values identified with Phylomark (Table 4). Another study used the panseq (11) package to identify the representative loci for typing based on SNPs in whole-genome comparisons; only two of the markers identified by panseq in our study were broadly conserved in the 40-genome test set, and they did not perform well compared to the GIG-EM markers (Table 3).
In the next few years, sequencing bacterial genomes will become so financially feasible that it will be routine to sequence clinical bacterial isolates and all isolates in historical culture collections. Until that time, targeted sequencing will still need to be conducted and will be largely based on perceived relationships of closely related isolates. Phylomark is a tool that will aid the identification of isolates for targeted sequencing and for the more accurate identification of phylogenetic relationships through the sequencing of a minimum number of genomic loci.
Supplementary Material
ACKNOWLEDGMENTS
The data utilized in this project were funded in part by federal funds from the National Institute of Allergy and Infectious Diseases, National Institutes of Health, Department of Health and Human Services, under contract number HHSN272200900009C. Analysis of the data was funded by the State of Maryland and NIH grant RAI092828A.
Footnotes
Published ahead of print 11 May 2012
Supplemental material for this article may be found at http://aem.asm.org/.
REFERENCES
- 1.Altschul SF, et al. 1997. Gapped BLAST and PSI-BLAST: a new generation of protein database search programs. Nucleic Acids Res. 25:3389–3402 [DOI] [PMC free article] [PubMed] [Google Scholar]
- 2.Angiuoli SV, Salzberg SL. 2010. Mugsy: fast multiple alignment of closely related whole genomes. Bioinformatics 27:334–342 [DOI] [PMC free article] [PubMed] [Google Scholar]
- 3.Blankenberg D, Taylor J, Nekrutenko A. 2011. Making whole genome multiple alignments usable for biologists. Bioinformatics 27:2426–2428 [DOI] [PMC free article] [PubMed] [Google Scholar]
- 4.Darling AE, Mau B, Perna NT. 2010. Progressive Mauve: multiple genome alignment with gene gain, loss and rearrangement. PLoS One 5:e11147 doi:10.1371/journal.pone.0011147. [DOI] [PMC free article] [PubMed] [Google Scholar]
- 5.Delcher AL, Phillippy A, Carlton J, Salzberg SL. 2002. Fast algorithms for large-scale genome alignment and comparison. Nucleic Acids Res. 30:2478–2483 [DOI] [PMC free article] [PubMed] [Google Scholar]
- 6.Edgar RC. 2004. MUSCLE: a multiple sequence alignment with reduced time and space complexity. BMC Bioinformatics 5:113 doi:10.1186/1471-2105-5-113. [DOI] [PMC free article] [PubMed] [Google Scholar]
- 7.Ewing B, Hillier L, Wendl MC, Green P. 1998. Base-calling of automated sequencer traces using phred. I. Accuracy assessment. Genome Res. 8:175–185 [DOI] [PubMed] [Google Scholar]
- 8.Jaureguy F, et al. 2008. Phylogenetic and genomic diversity of human bacteremic Escherichia coli strains. BMC Genomics 9:560 doi:10.1186/1471-2164-9-560. [DOI] [PMC free article] [PubMed] [Google Scholar]
- 9.Johnson JR, Owens KL, Clabots CR, Weissman SJ, Cannon SB. 2006. Phylogenetic relationships among clonal groups of extraintestinal pathogenic Escherichia coli as assessed by multi-locus sequence analysis. Microb. Infect. Institut Pasteur 8:1702–1713 [DOI] [PubMed] [Google Scholar]
- 10.Konstantinidis KT, Ramette A, Tiedje JM. 2006. Toward a more robust assessment of intraspecies diversity, using fewer genetic markers. Appl. Environ. Microbiol. 72:7286–7293 [DOI] [PMC free article] [PubMed] [Google Scholar]
- 11.Laing C, et al. 2010. Pan-genome sequence analysis using Panseq: an online tool for the rapid analysis of core and accessory genomic regions. BMC Bioinformatics 11:461 doi:10.1186/1471-2105-11-461. [DOI] [PMC free article] [PubMed] [Google Scholar]
- 12.Leopold SR, Sawyer SA, Whittam TS, Tarr PI. 2011. Obscured phylogeny and recombinational dormancy in Escherichia coli. BMC Evol. Biol. 11:183 doi:10.1186/1471-2148-11-183. [DOI] [PMC free article] [PubMed] [Google Scholar]
- 13.Maiden MC, et al. 1998. Multilocus sequence typing: a portable approach to the identification of clones within populations of pathogenic microorganisms. Proc. Natl. Acad. Sci. U. S. A. 95:3140–3145 [DOI] [PMC free article] [PubMed] [Google Scholar]
- 14.Ochman H, Selander RK. 1984. Standard reference strains of Escherichia coli from natural populations. J. Bacteriol. 157:690–693 [DOI] [PMC free article] [PubMed] [Google Scholar]
- 15.Pepe-Ranney C, Berelson WM, Corsetti FA, Treants M, Spear JR. 2012. Cyanobacterial construction of hot spring siliceous stromatolites in Yellowstone National Park. Environ. Microbiol. 14:1182–1197 [DOI] [PubMed] [Google Scholar]
- 16.Price MN, Dehal PS, Arkin AP. 2010. FastTree 2–approximately maximum-likelihood trees for large alignments. PLoS One 5:e9490 doi:10.1371/journal.pone.0009490. [DOI] [PMC free article] [PubMed] [Google Scholar]
- 17.Rasko DA, et al. 2008. The pangenome structure of Escherichia coli: comparative genomic analysis of E. coli commensal and pathogenic isolates. J. Bacteriol. 190:6881–6893 [DOI] [PMC free article] [PubMed] [Google Scholar]
- 18.Rausch T, et al. 2008. Segment-based multiple sequence alignment. Bioinformatics 24:i187–i192 doi:10.1093/bioinformatics/btn281. [DOI] [PubMed] [Google Scholar]
- 19.Reid SD, Herbelin CJ, Bumbaugh AC, Selander RK, Whittam TS. 2000. Parallel evolution of virulence in pathogenic Escherichia coli. Nature 406:64–67 [DOI] [PubMed] [Google Scholar]
- 20.Robinson DF, Foulds LR. 1980. Comparison of phylogenetic trees. Math. Biosci. 53:131–147 [Google Scholar]
- 21.Sahl JW, et al. 2011. A comparative genomic analysis of diverse clonal types of enterotoxigenic Escherichia coli reveals pathovar-specific conservation. Infect. Immun. 79:950–960 [DOI] [PMC free article] [PubMed] [Google Scholar]
- 22.Schloss PD, et al. 2009. Introducing mothur: open-source, platform-independent, community-supported software for describing and comparing microbial communities. Appl. Environ. Microbiol. 75:7537–7541 [DOI] [PMC free article] [PubMed] [Google Scholar]
- 23.Sorokin A, et al. 2006. Multiple-locus sequence typing analysis of Bacillus cereus and Bacillus thuringiensis reveals separate clustering and a distinct population structure of psychrotrophic strains. Appl. Environ. Microbiol. 72:1569–1578 [DOI] [PMC free article] [PubMed] [Google Scholar]
- 24.Stamatakis A. 2006. RAxML-VI-HPC: maximum likelihood-based phylogenetic analyses with thousands of taxa and mixed models. Bioinformatics 22:2688–2690 [DOI] [PubMed] [Google Scholar]
- 25.Sul S-J, Brammer G, Williams TL. 2008. Efficiently computing arbitrarily-sized Robinson-Foulds distance matrices, p 123–134 In Proceedings of the 8th International Workshop on Algorithms in Bioinformatics Springer-Verlag, Karlsruhe, Germany [Google Scholar]
- 26.Tartof SY, Solberg OD, Manges AR, Riley LW. 2005. Analysis of a uropathogenic Escherichia coli clonal group by multilocus sequence typing. J. Clin. Microbiol. 43:5860–5864 [DOI] [PMC free article] [PubMed] [Google Scholar]
- 27.Touchon M, et al. 2009. Organised genome dynamics in the Escherichia coli species results in highly diverse adaptive paths. PLoS Genet. 5:e1000344 doi:10.1371/journal.pgen.1000344. [DOI] [PMC free article] [PubMed] [Google Scholar]
- 28.Wirth T, et al. 2006. Sex and virulence in Escherichia coli: an evolutionary perspective. Mol. Microbiol. 60:1136–1151 [DOI] [PMC free article] [PubMed] [Google Scholar]
Associated Data
This section collects any data citations, data availability statements, or supplementary materials included in this article.