

Abstract
The MAPK cascades are principal kinase transduction pathways in eukaryotic cells. This family includes RAF/ERK, JNK, and p38 pathways. In the MAPK cascade, the signal is transmitted through three layers of sequentially activated kinases, MAP3K, MAP2K, and MAPK. The latter two kinases require dual phosphorylation for activation. The dual phosphorylation requirement has been implicated in bringing about bistability and switch-like responses in the cascade. MAPK signaling has been known to involve scaffolds—multidomain proteins that can assemble protein complexes; in this case the three MAPK components. Scaffolds are thought to increase the specificity of signaling by pairing enzymes and substrates. Scaffolds have been shown to biphasically control the response (the level of activated MAPK) and amplify it at a certain scaffold concentration range. In order to understand the interplay of scaffolding and multisite phosphorylation, in this study we analyze simplified MAPK signaling models in which we assume that either mono- or double phosphorylation of MAP2K and MAPK is required for activation. We demonstrate that the requirement for double phosphorylation directs signaling through scaffolds. In the hypothetical scenario in which mono-phosphorylation suffices for kinase activity, the presence of scaffolds has little effect on the response. This suggests that double phosphorylation in MAPK pathways, although not as efficient as mono-phosphorylation, evolved together with scaffolds to assure the tighter control and higher specificity in signaling, by enabling scaffolds to function as response amplifiers.
Keywords: Kinase cascades, Rule based modeling, Molecular pathways evolution
1. Introduction
The Mitogen Activated Protein Kinase (MAPK) cascades transmit a plethora of various signals in eukaryotic cells eliciting diverse cellular responses such as proliferation, differentiation, and apoptosis (Kholodenko and Birtwistle, 2009; McKay and Morrison, 2007). They transmit signals through typically three layers of sequentially activated kinases, MAP3K, MAP2K and MAPK. The kinases on each tier usually possess isoforms and splice variants. Furthermore, MAP2K and MAPK kinases canonically require double phosphorylation for activation—this property is a hallmark of the MAPK cascade, which is universally conserved and present in organisms ranging from yeast to human. Their dephosphorylation at either residue leads to effective deactivation. The requirement of double phosphorylation of MAP2K and MAPK has important dynamical consequences, particularly if the phosphorylation mechanism is distributive and activation of MAP2K and MAPK each requires two collisions with their upstream kinases (Alessi et al., 1994; Burack and Sturgill, 1997). This introduces fourth order nonlinearity in signal processing in the limit of low signal S, i.e., the response is proportional to S4, as we show in next section.
This nonlinearity likely underlies the observed bistability and switch-like response of the cascade (Levchenko et al., 2000). Furthermore, the dual phosphorylation requirement is also postulated to provide a kinetic proofreading mechanism (Swain and Siggia, 2002) as well as facilitate long-distance signal propagation within cells (Markevich et al., 2006).
The MAPK cascades are known to involve scaffolds—multidomain proteins that can assemble signaling complexes. MAPK scaffold molecules can simultaneously bind kinases from two or three tiers. Examples include KSR in the RAF/ERK cascade and JIP in JNK cascade (Dhanasekaran et al., 2007; Engstrom et al., 2010), which are tripartite and bind all three constituent kinases. Scaffolds have been found to assist signaling and are believed to be one of the determinants of the MAPK pathway specificity. In particular, they enhance the formation of complexes composed of particular kinase isoforms due to their different affinities to a scaffold (Nguyen and Shaw, 2002; Roy et al., 2002; Ohmachi and Sundaram, 2002). Specificity results from cell type-specific expression patterns of scaffolds as well as their differential intracellular localization.
The properties of scaffolds have been the subject of numerous computational studies including (Levchenko et al., 2000; Locasale et al., 2007; Locasale and Chakraborty, 2008; Takahashi et al., 2010). In particular, scaffolds have been found to potentially convert the mode of phosphorylation from distributive to processive, because the long-lived interaction of a substrate with the scaffold complex may allow both residues of MAPK or MAP2K to be phosphorylated in a single encounter with the scaffold. Such a mechanism could convert the highly nonlinear response in the absence of scaffolds to a linear response.
The above observations led us to conjecture that double phosphorylation is required for specific transmission of signals through scaffolds, enabling them to elicit specific and properly localized responses.
We have tested this hypothesis by constructing several simple models of MAPK signaling in the presence or absence of scaffold considering both MAP2K and MAPK activated by double phosphorylation as well as their hypothetical counterparts that require only mono-phosphorylation. We then analyze the behavior and performance of these models in terms of signal amplification and activation dynamics in order to decipher the interplay of scaffolding and the dual phosphorylation requirement.
2. Results
2.1. Idealized MAPK models
We consider four heuristic models of the MAPK cascade:
Cyt-11, in which MAP2K and MAPK are activated by spontaneous collisions in cytoplasm and require only mono-phosphorylation for activation. This model comprises six species. Specifically, all three kinases exist in two different states (active vs. inactive for MAP3K and phosphorylated vs. unphosphorylated for MAP2K and MAPK).
Cyt-22, in which MAP2K and MAPK are activated by spontaneous collisions in cytoplasm but require double phosphorylation. This model comprises 10 species; as in Cyt-11 MAP3K exists in two states while MAP2K and MAPK exist in four states (unphosphorylated, mono-phosphorylated on R1 or R2, double phosphorylated).
Scaff-11, in which MAP2K and MAPK are activated on a scaffold and require only mono-phosphorylation. In addition to the species found in Cyt-11 this model includes the scaffold complexes with the kinases. Specifically, each of three kinase binding sites on scaffold can be either unoccupied or occupied by the corresponding kinase in any of its states—this yields three possibilities for each of kinase binding sites. Therefore, the total number of the complexes is 3 × 3 × 3 = 27, which brings the total number of all species to 33.
Scaff-22, in which MAP2K and MAPK are activated on a scaffold but require double phosphorylation. As in Scaff-11 this model involves the scaffold complexes in addition to the unbound kinases. Since now the MAP2K and MAPK can exist in four different states, the number of scaffold based complexes increases to 3 × 5 × 5 = 75. Thus the total number of species is 85.
The name template for considered models is Scaff/Cyt/Joint-XY, where the first part signifies the location where phosphorylation is allowed to occur with “Joint” indicating that it can occur both on the scaffold and in the cytoplasm. The numbers X and Y represent the numbers of phosphorylations required for the activation of MAP2K and MAPK, respectively. The “Scaff” and “Cyt” models have been graphically represented in Fig. 1, and their parameters are listed in Table 1. The input signal S controls the activation rate of the first kinase in the cascade (MAP3K). The level of the active, unbound MAPK is considered the output or response R.
Fig. 1.

Four MAPK cascade models: (a) Cyt-11, (b) Cyt-22, (c) Scaff-11, (d) Scaff-22. For each model the numbers of BioNetGen rules, generated species and generated reactions are given.
Table 1.
Notation and parameters. The range of parameters for which relation (5) holds is given for three values of signal S. The two groups of parameters marked in bold are varied jointly. In the mammalian cell with a typical volume of 2000 μm3, 106 molecules corresponds to the concentration of approximately 0.8 μM.
| Parameter | Symbol | Value | Range
|
||
|---|---|---|---|---|---|
| S = 1 s−1 | S = 0.1 s−1 | S = 0.01 s−1 | |||
| Association of MAP2K, unphosphorylated MAPK and phosphorylated MAP3K with scaffold | a | 10−6 (molecules × s) −10 | 0–2.2 × 10⁻⁶ | 0–2.45 × 10⁻⁶ | 0–3.6 × 10⁻⁶ |
| Phosphorylation of MAP2K at R1 | p2R1 | 10−6 (molecules × s) −1 | |||
| Phosphorylation of MAP2K at R2 | p2R2 | 10−6 (molecules × s) −1 | |||
| Phosphorylation of MAPK at R1 | p3R1 | 10−6 (molecules × s) −1 | |||
| Phosphorylation of MAPK at R2 | p3R2 | 10−6 (molecules × s) −1 | |||
| Phosphorylation of MAP2K by MAP3K and MAPK by MAP2K (scaffold) | pscaff | 100 s−1 | 1.4–∞ | 0.7–∞ | 0.125–∞ |
| Dissociation of MAP2K, unphosphorylated MAPK and phosphorylated MAP3K from scaffold | d1 | 0.1 s−1 | 0–0.37 | 0–0.7 | 0–5.9 |
| Dissociation of unphosphorylated MAP3K and phosphorylated MAPK from scaffold | d2 | 100 s−1 | 0.3–∞ | 0.1–∞ | 3.2 × 10⁻³–∞ |
| Inactivation of MAP3K | u | 0.1 s−1 | 0.06–0.87 | 0.05–0.82 | 0.033–0.81 |
| Dephosphorylation of MAP2K at R1 | u2R1 | 0.1 s−1 | |||
| Dephosphorylation of MAP2K at R2 | u2R2 | 0.1 s−1 | |||
| Dephosphorylation of MAPK at R1 | u3R1 | 0.1 s−1 | |||
| Dephosphorylation of MAPK at R2 | u3R2 | 0.1 s−1 | |||
| Total number of MAP3K molecules | Atot | 105 molecules | |||
| Total number of MAP2K molecules | Btot | 105 molecules | |||
| Total number of MAPK molecules | Ctot | 5 × 10⁵ molecules | |||
| Total number of scaffold molecules | Stot | 105 molecules | |||
A number of simplifying assumptions have been made. We assume that all the reactions occur in the well-mixed cytoplasmic volume. The models assume that all cytoplasmic enzymes are operating well below saturation. Phosphorylation of unbound MAP2K and MAPK is treated as a second order reaction, whereas for the scaffold-bound kinases it is considered as a first order reaction with the high rate. Dephosphorylation is treated as a first order reaction. In case of double phosphorylation, the phosphorylation and dephosphorylation of both residues, unless otherwise specified, are assumed to proceed in random order. Furthermore, the rates of the phosphorylation in the first residue of MAP2K and MAPK are considered equal to the corresponding phosphorylation rates in the models with mono-phosphorylation only. The activation of MAP3K (e.g., RAF) is often a complex, multistep process; however, since its exact mechanism is not pertinent to this paper, it is modeled as a first order activation due to signal S.
In the two scaffold models, additional reactions are introduced to describe the interactions of the MAPK components with scaffold molecules. In these models it is assumed that the three MAPK components bind non-cooperatively to the scaffold. Furthermore, since the impact of the scaffold on the dephosphorylation of the bound kinases has not been firmly established, we assume that the dephosphorylation rates are independent of the association. In Scaff-11 and Scaff-22 phosphorylation of MAP2K and MAPK is assumed to occur exclusively on the scaffold.
Because the interactions between the scaffold and kinases in the MAPK cascade have been best characterized for the KSR/ERK pathway, additional assumptions have been made based on that system. Specifically, we assume also that activated MAPK dissociates almost immediately from scaffold, as activated ERK exhibits lower affinity to its cytoplasmic anchors, allowing for its translocation to the nucleus (Wolf et al., 2001). Similarly, since RAF association with scaffold is signal-dependent (McKay et al., 2009), we assume that inactive MAP3K cannot bind the scaffold and, if deactivated when bound, MAP3K dissociates almost immediately. These simplifying assumptions render scaffolds an effective platforms for signal transmission.
The models involving scaffold have been implemented and simulated using BioNetGen, which provides a language and software for the specification and simulation of rule-based models (Faeder et al., 2009). In BioNetGen language (BNGL), models are constructed by specifying rules that describe allowed protein–protein interactions, processes, and covalent modifications. Based on the rules, the reaction network is automatically generated along with the system of ODEs. The advantage of this approach is that it often allows for more concise definition of models with large numbers of interactions and protein states. Accordingly, the Scaff-11 model is represented by 12 rules which generate 145 reactions, involving 33 species, while Scaff-22 is represented by 20 BioNetGen rules, which generate 527 reactions, involving 85 species. See Appendix for the BNGL code for the presented models.
The amounts of species are expressed as the number of molecules per cell. These numbers can be easily converted to concentrations. The mammalian cell has the volume of 2000 μm3 (2 × 10⁻¹² L). Thus 1 μM correspond to N = Av × 10−6 M × 2 × 10−12 L ≃ 1.2 × 10⁶ molecules, where Av = 6.022 × 10²³ molecules/mol is the Avogadro number. Correspondingly, 106 molecules/cell corresponds to approximately 0.8 μM. The first order reactions have units s−1, while the second order reactions have units (molecules × s)−1.
Cyt-11 model
Symbols Ap, Bp, Cp, respectively, represent the amounts of phosphorylated MAP3K, MAP2K, and MAPK. S is the rate of activation of MAP3K (signal), while p and u represent the rates of phosphorylation and dephosphorylation.
| (1) |
For all positive values of parameters p and u and signal S the system (1) has the unique steady state, which is always stable.
| (2) |
Amount of phosphorylated MAPK in the steady state, C̄p, is considered response R for Cyt-11 model.
Cyt-22 model
Here, symbols Ap, Bp, Cp, Bpp, Cpp represent, respectively, the amounts of mono- or double phosphorylated MAP3K, MAP2K, and MAPK. Coefficients p and u represent the rate of phosphorylation and dephosphorylation, assumed equal for all residues.
| (3) |
Similarly, the system (3) has unique stable steady state
where
where
| (4) |
The amount of doubly phosphorylated MAPK in the steady state, C̄pp, is considered response R for Cyt-22 model.
For Cyt-11 model, the response R (Eq. (2)) depends linearly on the signal S in the limit of S→0. In contrast, in Cyt-22 model due to the distributive phosphorylation the response R (Eq. (4)) depends on S4 in the limit of S→0. This can give rise to switch-like and ultrasensitive responses (Markevich et al., 2004; Salazar and Hofer, 2009).
Scaffold models: Scaff-11 and Scaff-22
To validate the two scaffold models we analyze the response as a function of the scaffold level, which has previously been shown to be biphasic (Levchenko et al., 2000). As expected, both models display the prozone effect (Fig. 2). In particular, there exists an optimal scaffold concentration for signal transmission, and signal attenuation at high scaffold concentrations occurs (high dose inhibition). The highest signal transmission is reached at scaffold concentrations of 2.0 × 10⁵ and 1.8 × 10⁵ for Scaff-11 and Scaff-22, respectively.
Fig. 2.
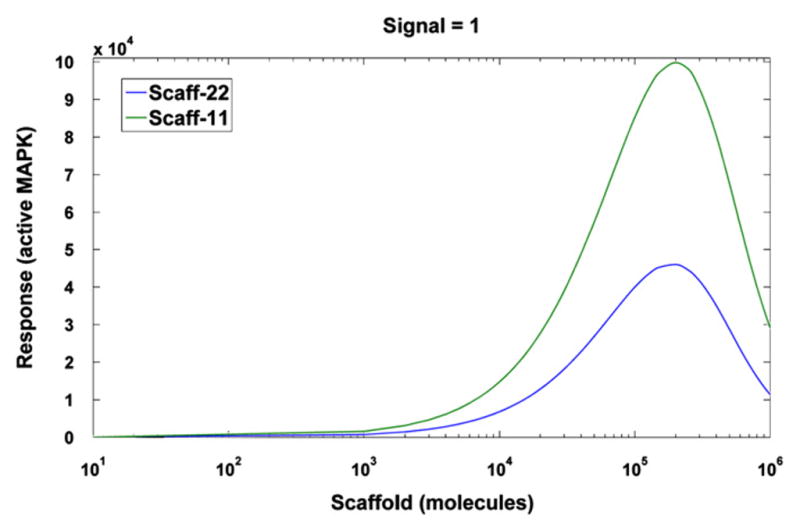
The steady-state level of activated MAPK (response R) for signal S = 1 s−1 as a function of total number of scaffold molecules.
Kortum and Lewis (2004) found that KSR1 levels in mouse are as much as 14 times below the optimal, while Chapman and Asthagiri (2009) determined that the level of Ste5 in yeast is 10-fold below the optimum needed to maximize signal throughput. Such low scaffold levels may provide regulatory flexibility as tuning the scaffold expression up or down directly modulates the downstream phenotypic response. Here, from now on, we will assume the slightly suboptimal scaffold level Stot = 105 molecules, which we expect is characteristic for active signaling. Next, for this suboptimal scaffold level we analyze the steady state responses of the four models as a function of the signal S.
2.2. Model comparison
In Fig. 3A it can be seen that for the chosen parameters (Table 1) and for the entire signal range S ∈ [10−3 s−1, 1 s−1] the following inequalities between responses magnitudes R hold
Fig. 3.

Panel A: The steady-state level of activated MAPK (response R) as function of signal magnitude S for the suboptimal scaffold level of 105 molecules. Panel B: The MAPK half-activation time as function of S.
| (5) |
The inequality (5) implies that signaling through the scaffold is more important than signaling bypassing the scaffold when double phosphorylation is required, but the opposite is true when only mono-phosphorylation is required.
We also considered variants of the Scaff-22 and Cyt-22 models in which the phosphorylation of two residues must proceed in order. Under this assumption the phosphorylation in cytoplasm proceeds at a slower rate yielding a lower steady state (Fig. 3A). The phosphorylation at the scaffold also proceeds at slower rate, but since the overall process is limited not by phosphorylation (which is assumed to be fast at scaffold) but by binding to scaffold—this effect is negligible. As a result, under the ordered phosphorylation assumption, the range of parameters in which inequality Rscaff-22 > Rcyt-22 holds is larger, therefore, also the range of parameters in which inequality (5) is satisfied is also broader.
Parameter sensitivity analysis (see Table 1) indicates that the hierarchy of models described by inequality (5) holds for a broad range of parameters. It is most sensitive to the rate of dephosphorylation, u, but even this coefficient can be changed by an order of magnitude. The range of parameters for which the inequality (5) holds was determined under the assumption that phosphorylation and dephosphorylation coefficients are assumed to be equal, i.e., p2R1 = p2R2 = p3R1 = p3R2 = p, u2R1 = u2R2 = u3R1 = u3R2 = u, and were varied simultaneously. In addition we assumed p = a, i.e., that phosphorylation coefficient in cytoplasm p is equal to the coefficient of MAPK kinase—scaffold binding a. It is obvious that for p ≪ a, signaling is directed via scaffolds, while for p ≫ a signaling bypasses scaffolds. The range of parameters for which the inequality (5) holds increases with decreasing signal S, which suggests that the role of scaffolds is most important at small signals, which is expected on the basis of Eq. (4).
We found that when phosphorylation and dephosphorylation coefficients for each of the MAP2K and MAPK residues are varied separately, the range in which the postulated behavior is observed is much broader. This is due to the “cross-compensation”. In order to promote activation via scaffold it is enough that any of MAPK kinases requires double phosphorylation, see Fig. 4. Therefore, even if one of MAPK residues is phosphorylated with a high rate, or dephosphorylated with a low rate (which results in kinetic equivalent to single phosphorylation requirement) the postulated hierarchy remains unchanged.
Fig. 4.

The joint models. The steady-state level of activated MAPK (response R) as a function of total number of scaffold molecules, for low S = 0.01 s−1 and high signal S = 1 s−1. The data have been scaled to capture the qualitative behavior.
The level of activated MAPK grows monotonically in the response to the signal. The response time, defined as the time at which level of the active MAPK reaches half of its asymptotic value following the turning on of the signal, decreases with increasing S (Fig. 3B). Interestingly, the response time is the shortest for Scaff-22 model.
2.3. Latin hypercube sampling
In addition to the single parameter sensitivity, we analyze robustness of the postulated hierarchy of models based on Latin hypercube sampling (McKay et al., 1979). Specifically, we generate 10,000 13-parameter ensembles. Each of 13 parameters was obtained
| (6) |
where Pbase represents the original parameter value, and x is drawn from [−1,1] using Latin hypercube sampling. The simulations were performed for four values of signal S; 0.001 s−1, 0.01 s−1, 0.1 s−1 and 1 s−1, and two values of fold; 3 and 10 (Table 2). We confirmed that the postulated hierarchy determined by inequality (5) (designated H1), is the most frequent among the 4! = 24 possible hierarchies. Moreover, for the fold = 3 its frequency is more than 45% over the full signal range (0≤S≤1 s−1) while for fold = 10 its frequency is more that 45% for low signals (S≤0.01 s−1). As already expected from single parameter analysis the frequency of occurrence of hierarchy H1 increases with decreasing signal. This confirms that scaffolds play a dominant role for weak signals. Interestingly, we identified four other strongly represented hierarchies, H2 through H5 (Table 2).
Table 2.
Latin hypercube sampling.
| Hierarchy | Signal = 0.001 s−1 | Signal = 0.01 s−1 | Signal = 0.1 s−1 | Signal = 1 s−1 |
|---|---|---|---|---|
| Fold = 3 (10) | Fold = 3 (10) | Fold = 3 (10) | Fold = 3 (10) | |
| (H1) Rcyt–11 > Rscaff –11 > Rscaff –22 > Rcyt–22 | 74 (59)% | 74 (48)% | 59 (38)% | 46 (28)% |
| (H2) Rscaff –11 > Rcyt–11 > Rscaff –22 > Rcyt–22 | 18 (13)% | 16 (16)% | 16 (13)% | 16 (13)% |
| (H3) Rscaff –11 > Rscaff –22 > Rcyt–11 > Rcyt–22 | 8 (25)% | 9 (25)% | 12 (26)% | 11 (28)% |
| (H4) Rcyt–11 > Rscaff –11 > Rcyt–22 > Rscaff –22 | 0 (1)% | 1 (5)% | 8 (8)% | 14 (9)% |
| (H5) Rcyt–11 > Rcyt–22 > Rscaff –11 > Rscaff –22 | 0 (1)% | 0 (5)% | 6 (15)% | 12 (22)% |
To analyze which parameters discriminate between the postulated hierarchy H1 and the four other hierarchies, we calculated the scaled median value of each parameter, median(x) = median(log10 (Prandom/Pbase)), from the random parameter subsets corresponding to the five represented hierarchies (Table 3). The analysis was performed for small signal value S = 0.01 s−1, and fold = 10. The analysis shows that hierarchies H2 and H3 in which phosphorylation via scaffold dominates (with respect to postulated hierarchy H1) are characterized by an elevated scaffold binding rate a, which in the default parameter set is equal to phosphorylation rate in cytoplasm (p = a). The hierarchies H4 and H5, in which the cytoplasmic phosphorylation is dominant, are characterized by the elevated phosphorylation rate at the second MAP2K and MAPK residues, and the attenuated dephosphorylation of MAP2K. In this analysis, in order to compare the Cyt-11 and Cyt-22 models, the phosphorylation rate in the Cyt-11 model is assumed equal to the phosphorylation rate of the first MAP2K and MAPK residues in the Cyt-22 model. Thus, an elevated phosphorylation rate of the second residue promotes activation in the Cyt-22 model without influencing activation in the Cyt-11 model. This explains why the discrimination between hierarchies H2, H3, H4, and H5 is connected with differences in parameters describing phosphorylation of the two MAPK residues.
Table 3.
Scaled median values of x = logfold(Prandom/Pbase), see Eq (6), for parameters subsets corresponding to each of the five hierarchies, S = 0.01 s−1, fold = 10.
| Parameter | Median (x)
|
(H2 – H1) | (H3 – H1) | (H4 – H1) | (H5 – H1) | ||||
|---|---|---|---|---|---|---|---|---|---|
| H1 | H2 | H3 | H4 | H5 | |||||
| a | −0.31 | 0.38 | 0.61 | −0.28 | −0.57 | 0.69 | 0.92 | 0.03 | −0.26 |
| p2R1 | 0.02 | −0.09 | −0.28 | 0.24 | 0.36 | −0.11 | −0.30 | 0.22 | 0.34 |
| p2R2 | −0.20 | −0.04 | 0.02 | 0.22 | 0.35 | 0.16 | 0.22 | 0.42 | 0.55 |
| p3R1 | 0.21 | −0.12 | −0.40 | 0.23 | 0.33 | −0.33 | −0.61 | 0.02 | 0.12 |
| p3R2 | −0.18 | 0.02 | −0.01 | 0.25 | 0.31 | 0.20 | 0.17 | 0.43 | 0.49 |
| pscaff | −0.01 | 0.04 | 0.04 | −0.04 | −0.02 | 0.05 | 0.05 | −0.03 | −0.01 |
| d1 | 0 | −0.10 | −0.17 | 0.13 | 0.37 | −0.10 | −0.17 | 0.13 | 0.37 |
| d2 | 0 | −0.03 | 0 | 0.06 | 0 | −0.03 | 0 | 0.06 | 0 |
| u | 0.15 | 0.01 | −0.03 | −0.10 | −0.24 | −0.14 | −0.18 | −0.25 | −0.39 |
| u2R1 | 0.07 | −0.07 | 0.22 | −0.36 | −0.24 | −0.14 | 0.15 | −0.43 | −0.31 |
| u2R2 | 0.18 | 0.09 | −0.04 | −0.17 | −0.36 | −0.09 | −0.22 | −0.35 | −0.54 |
| u3R1 | 0.06 | −0.36 | 0.18 | −0.41 | 0.07 | −0.42 | 0.12 | −0.47 | 0.01 |
| u3R2 | 0.10 | 0.38 | −0.20 | 0.25 | −0.29 | 0.28 | −0.30 | 0.15 | −0.39 |
The analysis revealed that in real MAPK systems, in which double phosphorylation of MAP2K and MAPK is required, the key parameters promoting activation via scaffold are the scaffold binding rate (which is not surprising) and the kinase dephosphorylation rate.
2.4. Competition between activation on scaffold and in cytoplasm
Now we consider a more realistic representation of the processes taking place in the cell. In models Joint-11 and Joint-22 we assume that phosphorylation occurs both on the scaffold and in the cytoplasm, but it is also assumed that kinases bound to scaffold may not phosphorylate those in cytoplasm and vice versa. Fig. 4 shows how the scaffold level influences the response for each model. For Joint-11 the response decreases monotonically with scaffold concentration above about 104. This is due to high dose inhibition at large scaffold concentrations, in which components of MAPK cascade are bound to different scaffold molecules and thus rendered effectively inactive (this would not be true if scaffold-bound enzymes were allowed to phosphorylate cytoplasmic substrates or vice versa). In contrast, when double phosphorylation is required, the highest response is achieved for scaffold concentrations close to the optimum determined in Scaff-22. It should be noted, however, that the characteristic response for the mono-phosphorylation model is much higher than for the double phosphorylation model. The effect of scaffold on Joint-22 is higher at low signal S = 0.01 s−1 (Fig. 4A) than at high signal S = 1 s−1 (Fig. 4B), respectively, 138-fold and 3-fold. This can be anticipated because cytoplasmic activation is much weaker at low S values than at high S values due to the strong nonlinearity (see Eq. (4)). Overall, these results demonstrate that the scaffold acts as a signal amplifier only when double phosphorylation is required for kinase activation.
We have also considered models in which only one MAPK cascade component (MAPK or MAP2K) required double phosphorylation (Joint-12 and Joint-21, respectively). In those cases, the presence of the scaffold also augments signaling, although the effect is less pronounced (Fig. 4). This result suggests that at least one component of the MAPK cascade requires activation via dual phosphorylation in order for the scaffold to function as an amplifier.
The models also permit us to analyze the location where MAPK phosphorylation and activation take place (Fig. 5). The MAPK species in Joint-11 and Joint-22 have been modified to include state flags that correspond to each site that undergoes phosphorylation in MAPK activation. Upon phosphorylation of a site, the corresponding flag is modified to indicate the location. Upon dephosphorylation, the flag of the dephosphorylated site is reset to a neutral value. In Joint-22 the scaffold (when present at 105 molecules) is the predominant location for MAPK activation (Fig. 5A). At high signal value S = 1 s−1 approximately 75% of all MAPKs are activated solely through scaffold-based phosphorylations, while only 8% are activated exclusively in the cytoplasm. These proportions significantly depend on the signal; with a decreasing signal, the contribution of scaffold-based activation becomes even more dominant up to 100% at small S. In contrast, in Joint-11, scaffold- and cytoplasm-based phosphorylation are approximately equal at all values of S (Fig. 5B). In Joint-11 model the fraction of scaffold-based phosphorylation decreases with the scaffold concentration (data not shown), without any decrease of the total output (Fig. 4).
Fig. 5.

Relative contributions of scaffold and cytoplasm to MAPK activation for the scaffold level of 105. In case of Joint-22 model the Activated MAPK is split into three classes based on where the activating phosphorylations occurred. Similarly, in Joint-11 model the activated MAPK is split into two classes based on the location of the activating phosphorylation.
3. Discussion
In this study we have analyzed regulation of MAPK cascade by scaffolds that can bind three MAPK components. We have considered two phosphorylation paradigms. In the mono-phosphorylation paradigm, which is hypothetical, we have assumed that MAPK and MAP2K are activated by phosphorylation of a single residue. In the double phosphorylation paradigm, which reflects the actual activation mechanism, we have assumed that MAPK and MAP2K activation require phosphorylation of two residues.
We found that the presence of the scaffold has opposing effects on signal amplification in these two paradigms. In particular, the scaffold augments signaling when dual phosphorylation is required for activation. In contrast it diminishes signaling if activation via mono-phosphorylation is assumed. Furthermore, the presence of scaffold reduces the response time only when double phosphorylation is required. In the double phosphorylation paradigm scaffolding can substantially increase the response, and the response is biphasic, as was previously observed by Levchenko et al. (2000), meaning that there is an optimal scaffold concentration above which the response is attenuated. In contrast, in the mono-phosphorylation paradigm the presence of scaffold either has no effect (at low scaffold concentrations) or reduces the response.
In some MAPK systems scaffolds may play a catalytic role. As shown, recently, by Brennan et al. (2011) Raf-induced allosteric transition of KSR stimulates phosphorylation of MEK. It is also possible that binding to scaffolds attenuates MAP2K and MAPK dephosphorylation. These two effects can further promote signaling through scaffolds, although this effect would be independent of the double phosphorylation paradigm.
By performing the single parameter sensitivity analysis (Table 1) and multidimensional Latin hypercube sampling analysis (Table 2) we showed that the range of kinetic parameters in which the hierarchy H1 is satisfied increases with decreasing strength of the signal. Let us recall that the hierarchy H1 implies that signaling through the scaffold is more important than signaling bypassing the scaffold when double phosphorylation is required, but the opposite is true when mono-phosphorylation is sufficient. Therefore, we may expect that coexistence of scaffolds and the double phosphorylation requirement allows for propagation of weak signals ubiquitously in various MAPK cascades.
Since the kinases of the MAPK cascade are often promiscuous, scaffolds are believed to generate specific responses by assembling signaling complexes of appropriate composition in appropriate subcellular locations in a cell-type specific manner. The amplification effect they confer over non-scaffolded activation is crucial to this function. Our observations indicate that this amplification tends to occur only when activation is based on dual phosphorylation.
These observations support a novel hypothesis about the role of double phosphorylation in MAPK signaling. It is commonly believed that the principal role of this requirement is to introduce the nonlinearity that establishes switch-like response dynamics and activation thresholds, emphasizing high signals (Levchenko et al., 2000). Our observation suggests that the nonlinearity can also be important in attenuating cytoplasmic signaling, especially at lower signals. This attenuation in the presence of significant scaffold concentrations, which amplify the response in a scaffold-specific manner, gives rise to a scaffold-specific signaling regime. Thus dual phosphorylation is required to enable scaffolds to fulfill their function as specificity determinants, and affords a cell much greater control over the location and specificity of the response.
This hypothesis is consistent with the fact that the coexistence of scaffolds and of the dual phosphorylation requirement of MAP2K and MAPK is conserved in all eukaryotes. To our knowledge, there is no known MAPK cascade that does not utilize scaffolds. The dual phosphorylation requirement is essentially a defining characteristic of MAPK cascades. As for scaffolds, their critical role in MAPK signaling has been validated in a number of studies. Disruption of a scaffold leads to diminished response at best and is lethal when other scaffolds cannot compensate for this loss (Ohmachi and Sundaram, 2002; Nguyen and Shaw, 2002). This suggests coevolution of the MAPK cascade kinases and scaffolds to yield an integrated scaffold-based signaling regime.
In conclusion, our results indicate that while seemingly less efficient, the double-phosphorylation requirement enables MAPK cascade to cooperate with scaffolds leading to the higher specificity of responses to general signaling cues.
Supplementary Material
Acknowledgments
We thank Professor Lewis Jacobson and Dr. Piotr Szopa for helpful discussions. This work was supported by the Foundation for Polish Science Grant TEAM/2009-3/6 and Polish Ministry of Science and Higher Education Grant NN501 132936. JRF also acknowledges support from the National Institutes of Health Grant 1R01AI080799-01.
Appendix A. BioNetGen rules for Scaff-11 model
A.1. Species definition
1. MAP3K, Molecular type definition: MAP3K(s,S ~ I ~ A)
2. MAP2K, Molecular type definition: MAP2K(s,R1~ Y ~ Yp)
3. MAPK, Molecular type definition: MAPK(s,R1~ Y ~ Yp)
4. Scaffold, Molecular type definition: Scaff(map3k,map2k,mapk)
A.2. Seed species
MAP3K(s,S~I) = Atot
MAP2K(s,R1~ Y) = Btot
MAPK(s,R1~ Y) = Ctot
Scaff(map3k,map2k,mapk) = Stot
A.3. Rules
For the parameter definitions and values refer to Table 1.
1. MAP3K(s,S~ I) → MAP3K(s,S~ A) S
2. MAP3K(s,S~ A) + Scaff(map3k) ↔ MAP3K(s!1,S~ A).Scaff(map3k!1) a, d1
3. MAP3K(s!1,S~I).Scaff(map3k!1) → MAP3K(s,S~I) + Scaff(map3k) d2
4. MAP2K(s,R1~ Y) + Scaff(map2k) ↔ MAP2K(s!1,R1~ Y).Scaff(map2k!1) a, d1
5. MAP2K(s,R1~ Yp) + Scaff(map2k) ↔ MAP2K(s!1,R1~ Yp).Scaff(map2k!1) a, d1
6. MAPK(s,R1~ Y) + Scaff(mapk) ↔ MAPK(s!1,R1~ Y).Scaff(mapk!1) a, d1
7. MAPK(s!1,R1~ Y).Scaff(mapk!1) → MAPK(s,R1~ Yp) + Scaff(mapk) d2
8. MAP3K(s!1,S~A).Scaff(map3k!1,map2k!2).MAP2K(s!2,R1~ Y) → MAP3K(s!1,S~ A).Scaff(map3k!1,map2k!2).MAP2K(s!2,R1~ Yp) pscaff
9. MAPK(s!1,R1~ Y).Scaff(mapk!1,map2k!2).MAP2K(s!2,R1~ Yp) → MAPK(s!1,R1~ Yp).Scaff(mapk!1,map2k!2).MAP2K(s!2,R1~ Yp) pscaff
10. MAP3K(S~ A) → MAP3K(S~I) u
11. MAP2K(R1~ Yp) → MAP2K(R1~ Y) u
12. MAPK(R1~ Yp) → MAPK(R1~ Y) u
Appendix B. BioNetGen rules for Scaff-22 model
B.1. Species definition
1. MAP3K, Molecular type definition: MAP3K(s,S~ I~ A)
2. MAP2K, Molecular type definition: MAP2K(s,R1~ Y ~ Yp,R2~ Y~Yp)
3. MAPK, Molecular type definition: MAPK(s,R1~ Y~ Yp,R2~ Y~ Yp)
4. Scaffold, Molecular type definition: Scaff(map3k,map2k,mapk)
B.2. Seed species
MAP3K(s,S~ I) = Atot
MAP2K(s,R1~ Y,R2~ Y) = Btot
MAPK(s,R1~ Y,R2~ Y) = Ctot
Scaff(map3k,map2k,mapk) = Stot
B.3. Rules
For the parameter definitions and values refer to Table 1
1. MAP3K(s,S~ I) → MAP3K(s,S~ A) S
2. MAP3K(s,S~ A) + Scaff(map3k) ↔ MAP3K(s!1,S~ A).Scaff(map3k!1) a, d1
3. MAP3K(s!1,S~ I).Scaff(map3k!1) → MAP3K(s,S~ I) + Scaff(map3k) d2
4. MAP2K(s,R1~ Y,R2~ Y) + Scaff(map2k) ↔ MAP2K(s!1,R1~ Y,R2~ Y).Scaff(map2k!1) a, d1
5. MAP2K(s,R1~ Yp,R2~ Y) + Scaff(map2k) ↔ MAP2K(s!1,R1~ Yp,R2~Y).Scaff(map2k!1) a, d1
6. MAP2K(s,R1~ Y,R2~ Yp) + Scaff(map2k) ↔ MAP2K(s!1,R1~ Y,R2~ Yp).Scaff(map2k!1) a, d1
7. MAP2K(s,R1~ Yp,R2~ Yp) + Scaff(map2k) ↔ MAP2K(s!1,R1~ Yp,R2~ Yp).Scaff(map2k!1) a, d1
8. MAPK(s,R1~ Y,R2~ Y) + Scaff(mapk) ↔ MAPK(s!1,R1~ Y,R2~ Y).Scaff(mapk!1) a, d1
9. MAPK(s,R1~ Yp,R2~ Y) + Scaff(mapk) ↔ MAPK(s!1,R1~ Yp,R2~ Y).Scaff(mapk!1) a, d1
10. MAPK(s,R1~ Y,R2~ Yp) + Scaff(mapk) ↔ MAPK(s!1,R1~ Y,R2~ Yp).Scaff(mapk!1) a, d1
11. MAPK(s!1,R1~ Yp,R2~ Yp).Scaff(mapk!1) → MAPK(s,R1~ Yp,R2~ Yp) + Scaff(mapk) d2
12. MAP3K(s!1,S~ A).Scaff(map3k!1,map2k!2).MAP2K(s!2,R1~ Y) → MAP3K(s!1,S~ A).Scaff(map3k!1,map2k!2).MAP2K(s!2,R1~ Yp) pscaff
13. MAP3K(s!1,S~ A).Scaff(map3k!1,map2k!2).MAP2K(s!2,R2~ Y) → MAP3K(s!1,S~ A).Scaff(map3k!1,map2k!2).MAP2K(s!2,R2~ Yp) pscaff
14. MAPK(s!1,R1~ Y).Scaff(mapk!1,map2k!2).MAP2K(s!2,R1~ Yp,R2~ Yp) → MAPK(s!1,R1~ Yp).Scaff(mapk!1,map2k!2).MAP2K(s!2,R1~ Yp,R2~ Yp) pscaff
15. MAPK(s!1,R2~ Y).Scaff(mapk!1,map2k!2).MAP2K(s!2,R1~ Yp,R2~ Yp) → MAPK(s!1,R2~ Yp).Scaff(mapk!1,map2k!2).MAP2K(s!2,R1~ Yp,R2~ Yp) pscaff
16. MAP3K(S~ A) → MAP3K(S~ I) u
17. MAP2K(R1~ Yp) → MAP2K(R1~ Y) u
18. MAP2K(R2~ Yp) → MAP2K(R2~ Y) u
19. MAPK(R1~ Yp) → MAPK(R1~ Y) u
20. MAPK(R2~ Yp) → MAPK(R2~ Y) u
Appendix C. Supplementary data
Supplementary data associated with this article can be found in the online version at doi:10.1016/j.jtbi.2011.11.014.
References
- Alessi DR, Saito Y, Campbell DG, Cohen P, Sithanandam G, Rapp U, Ashworth A, Marshall CJ, Cowley S. Identification of the sites in MAP kinase kinase-1 phosphorylated by p74raf-1. EMBO J. 1994;13:1610–1619. doi: 10.1002/j.1460-2075.1994.tb06424.x. [DOI] [PMC free article] [PubMed] [Google Scholar]
- Brennan DF, Dar AC, Hertz NT, Chao WCH, Burlingame AL, Shokat KM, Barford D. A Raf-induced allosteric transition of KSR stimulates phosphorylation of MEK. Nature. 2011;472:366–369. doi: 10.1038/nature09860. [DOI] [PubMed] [Google Scholar]
- Burack WR, Sturgill TW. The activating dual phosphorylation of MAPK by MEK is nonprocessive. Biochemistry. 1997;36:5929–5933. doi: 10.1021/bi970535d. [DOI] [PubMed] [Google Scholar]
- Chapman SA, Asthagiri AR. Quantitative effect of scaffold abundance on signal propagation. Mol Syst Biol. 2009;5:313. doi: 10.1038/msb.2009.73. [DOI] [PMC free article] [PubMed] [Google Scholar]
- Dhanasekaran DN, Kashef K, Lee CM, Xu H, Reddy EP. Scaffold proteins of MAP-kinase modules. Oncogene. 2007;26:3185–3202. doi: 10.1038/sj.onc.1210411. [DOI] [PubMed] [Google Scholar]
- Engstrom W, Ward A, Moorwood K. The role of scaffold proteins in JNK signalling. Cell Prolif. 2010;43:56–66. doi: 10.1111/j.1365-2184.2009.00654.x. [DOI] [PMC free article] [PubMed] [Google Scholar]
- Faeder JR, Blinov ML, Hlavacek WS. Rule-based modeling of biochemical systems with BioNetGen. Methods Mol Biol. 2009;500:113–167. doi: 10.1007/978-1-59745-525-1_5. [DOI] [PubMed] [Google Scholar]
- Kholodenko BN, Birtwistle MR. Four-dimensional dynamics of MAPK information processing systems. Interdiscip Rev Syst Biol Med. 2009;1:28–44. doi: 10.1002/wsbm.16. [DOI] [PMC free article] [PubMed] [Google Scholar]
- Kortum RL, Lewis RE. The molecular scaffold KSR1 regulates the proliferative and oncogenic potential of cells. Mol Cell Biol. 2004;24:4407–4416. doi: 10.1128/MCB.24.10.4407-4416.2004. [DOI] [PMC free article] [PubMed] [Google Scholar]
- Levchenko A, Bruck J, Sternberg PW. Scaffold proteins may biphasically affect the levels of mitogen-activated protein kinase signaling and reduce its threshold properties. Proc Natl Acad Sci USA. 2000;97:5818–5823. doi: 10.1073/pnas.97.11.5818. [DOI] [PMC free article] [PubMed] [Google Scholar]
- Locasale JW, Shaw AS, Chakraborty AK. Scaffold proteins confer diverse regulatory properties to protein kinase cascades. Proc Natl Acad Sci USA. 2007;104:13307–13312. doi: 10.1073/pnas.0706311104. [DOI] [PMC free article] [PubMed] [Google Scholar]
- Locasale JW, Chakraborty AK. Regulation of signal duration and the statistical dynamics of kinase activation by scaffold proteins. PLoS Comput Biol. 2008;4:1000099e. doi: 10.1371/journal.pcbi.1000099. [DOI] [PMC free article] [PubMed] [Google Scholar]
- Markevich NI, Hoek JB, Kholodenko BN. Signaling switches and bistability arising from multisite phosphorylation in protein kinase cascades. J Cell Biol. 2004;164:353–359. doi: 10.1083/jcb.200308060. [DOI] [PMC free article] [PubMed] [Google Scholar]
- Markevich NI, Tsyganov MA, Hoek JB, Kholodenko BN. Long-range signaling by phosphoprotein waves arising from bistability in protein kinase cascades. Mol Syst Biol. 2006;2:61. doi: 10.1038/msb4100108. [DOI] [PMC free article] [PubMed] [Google Scholar]
- McKay MD, Beckman RJ, Conover WJ. A comparison of three methods for selecting values of input variables in the analysis of output from a computer code. Technometrics. 1979;21:239–245. [Google Scholar]
- McKay MM, Morrison DK. Integrating signals from RTKs to ERK/MAPK. Oncogene. 2007;26:3113–3121. doi: 10.1038/sj.onc.1210394. [DOI] [PubMed] [Google Scholar]
- McKay MM, Ritt DA, Morrison DK. Signaling dynamics of the KSR1 scaffold complex. Proc Natl Acad Sci USA. 2009;106:11022–11027. doi: 10.1073/pnas.0901590106. [DOI] [PMC free article] [PubMed] [Google Scholar]
- Nguyen A, Shaw AS. Kinase suppressor of Ras (KSR) is a scaffold which facilitates mitogen-activated protein kinase activation in vivo. Mol Cell Biol. 2002;22:3035–3045. doi: 10.1128/MCB.22.9.3035-3045.2002. [DOI] [PMC free article] [PubMed] [Google Scholar]
- Ohmachi M, Sundaram MV. C. elegans ksr-1 and ksr-2 have both unique and redundant functions and are required for MPK-1 ERK phosphorylation. Curr Biol. 2002;12:427–433. doi: 10.1016/s0960-9822(02)00690-5. [DOI] [PubMed] [Google Scholar]
- Roy F, Laberge G, Douziech M, Ferland-McCollough D, Therrien M. KSR is a scaffold required for activation of the ERK/MAPK module. Genes Dev. 2002;16:427–438. doi: 10.1101/gad.962902. [DOI] [PMC free article] [PubMed] [Google Scholar]
- Salazar C, Hofer T. Multisite protein phosphorylation—from molecular mechanisms to kinetic models. FEBS J. 2009;276:3177–3198. doi: 10.1111/j.1742-4658.2009.07027.x. [DOI] [PubMed] [Google Scholar]
- Swain PS, Siggia ED. The role of proofreading in signal transduction specificity. Biophys J. 2002;82:2928–2933. doi: 10.1016/S0006-3495(02)75633-6. [DOI] [PMC free article] [PubMed] [Google Scholar]
- Takahashi K, Tanase-Nicola S, ten Wolde PR. Spatio-temporal correlations can drastically change the response of a MAPK pathway. Proc Natl Acad Sci USA. 2010;107:2473–2478. doi: 10.1073/pnas.0906885107. [DOI] [PMC free article] [PubMed] [Google Scholar]
- Wolf I, Rubinfeld H, Yoon S, Marmor G, Hanoch T, Seger R. Involvement of the activation loop of ERK in the detachment from cytosolic anchoring. J Biol Chem. 2001;276:24490–24497. doi: 10.1074/jbc.M103352200. [DOI] [PubMed] [Google Scholar]
Associated Data
This section collects any data citations, data availability statements, or supplementary materials included in this article.