

Abstract
Growth plates are spatially polarized and structured into three histologically and functionally distinct layers – the resting zone (RZ), proliferative zone (PZ), and hypertrophic zone (HZ). With age, growth plates undergo functional and structural senescent changes including declines of growth rate, proliferation rate, growth plate height and cell number. To explore the mechanisms responsible for spatially-associated differentiation and temporally-associated senescence of growth plate in an unbiased manner, we used microdissection to collect individual growth plate zones from proximal tibiae of 1-wk rats and the PZ and early hypertrophic zones of growth plates from 3-, 6-, 9-, and 12-wk rats and analyzed gene expression using microarray. We then used bioinformatic approaches to identify significant changes in biological functions, molecular pathways, transcription factors and also to identify specific gene products that can be used as molecular markers for individual zones or for temporal development.
Keywords: Growth plate, chondrocytes, gene expression, longitudinal bone growth, differentiation, senescence
Introduction
Longitudinal bone growth in mammals occurs at the growth plates. These cartilaginous structures are located toward the ends of bones, including the vertebral bodies and tubular bones of the appendicular skeleton. The growth plate shows a high degree of spatial organization, including spatial polarity along the long axis of the bone. Thus, the surface of the growth plate located closest to the end of the bone, which by convention is often termed the top of the growth plate, is biologically distinct from the surface located closest to the center of the bone. Along this axis, the growth plate can be divided into three histologically distinct layers – the resting zone, the proliferative zone, and the hypertrophic zone. The topmost layer, the resting zone, contains chondrocytes that are scattered in a bed of cartilage matrix and, in postnatal life, divide infrequently [1]. We have previously shown evidence that resting zone chondrocytes serve as stem-like cells for the growth plate in that they can generate clones of rapidly proliferating chondrocytes, which are located in the second layer of the growth plate, the proliferative zone [2]. In the proliferative zone, these clones of chondrocytes are arranged in columns parallel to the long axis of the bone. Over time, as longitudinal growth proceeds, proliferative cells close to the hypertrophic zone undergo terminal differentiation. During this process, they stop proliferating and physically enlarge to become hypertrophic chondrocytes, which compose the third layer of the growth plate, the hypertrophic zone. Simultaneously, the bottom of the hypertrophic zone is invaded by blood vessels, osteoclasts and differentiating osteoblasts which remodel the newly formed cartilage into bone tissue.
Thus, longitudinal bone growth requires that growth plate chondrocytes undergo sequential differentiation from the resting to the proliferative to the hypertrophic state as their spatial position shifts. The mechanisms responsible for this two-step differentiation program and hence for the spatial polarity of the growth plate have begun to be elucidated. We have shown evidence that the polarity of postnatal growth plate cartilage is not governed by outside spatial cues but rather by intrinsic factors. Studies by Kronenberg and others, focusing on the embryonic growth plate, have demonstrated that parathyroid hormone-related protein (Pthrp) and Indian hedgehog (Ihh) participate in a negative feedback loop that plays a critical role in the differentiation of growth plate chondrocytes, with Pthrp negatively regulating hypertrophic differentiation and Ihh positively regulating the entry of chondrocytes into the proliferative zone [3]. Bone morphogenetic protein (BMP) signaling positively regulates hypertrophic differentiation [4]. Wnt signaling has complex effects on growth plate chondrocytes including stimulatory effects on hypertrophic differentiation. Fibroblast growth factors (FGFs) also appear to regulate hypertrophic differentiation [5]. Roles for these specific regulatory systems have often been first suggested by the phenotypes of mice with targeted mutations in related genes.
In addition to spatial regulation, the growth plate also undergoes important temporal regulation. Over time, proliferation slows in the growth plate [6], causing the rate of longitudinal bone growth to decrease and approach zero as the organism approaches its adult size. This decline in proliferation is accompanied by structural changes that occur in the growth plate with increasing age, including a decrease in the number of resting, proliferative, and hypertrophic chondrocytes, a decrease in the final size attained by the hypertrophic chondrocytes, and an increase in the spacing between adjacent chondrocyte columns [7]. There is evidence that this programmed senescence of the growth plate is not due to hormonal or other systemic mechanism but rather to local mechanisms [7]. The changes in gene expression associated with growth plate senescence and the regulatory pathways driving these temporal changes have received less attention than those related to spatial organization. However, declines in chondrocyte Igf2 mRNA expression and other temporal changes in the IGF and FGF systems have been reported [8, 9]. There is also evidence that these changes in gene expression may in fact be driven not by time per se but rather by progressive growth [10].
To explore the mechanisms responsible for spatial and temporal regulation in the growth plate in an unbiased manner, we microdissected postnatal rat growth plates into their constituent zones and then used microarray analysis to characterize the changes in gene expression that occur as chondrocytes undergo spatially-associated differentiation and temporally-associated senescence. We then used bioinformatic approaches to identify functional pathways that may regulate these processes and to identify specific gene products that may be used as molecular markers for the spatial zones and for temporal development.
Methods
Animal procedures
Sprague-Dawley rats (Harlan, Indianapolis, IN) were maintained and used in accordance with the Guide for the Care and Use of Laboratory Animals [11] and received standard rodent chow (Zeigler Bros, Gardners, PA) and water ad libitum. The protocol was approved by the Animal Care and Use Committee, National Institutes of Child and Human Development, National Institutes of Health. Male rats (n = 5 per time point) were killed by carbon dioxide inhalation at ages 1, 3, 6, 9, 12 weeks. To study growth plate senescence without the complicating effects of sex steroids, 3-, 6-, 9-, and 12-week-old rats were castrated at 18 days of age. Proximal tibial epiphyses were excised, embedded in optimum cutting temperature (O.C.T.) compound (Electron Microscopy Sciences, Hatfield, PA) and stored at −80 C.
Growth plate microdissection
Microdissection of rat growth plates was performed as previously described [12]. Briefly, frozen longitudinal sections of 60 μm thickness were obtained from the proximal tibial epiphyses. Slides were thawed, fixed in methanol, and stained with eosin. Stained slides were dehydrated and placed in xylene. Using an inverted microscope, razor blades, and hypodermic needles, growth plate sections were separated according to zone based on histological hallmarks. Perichondrium, metaphyseal bone, and epiphyseal bone were excluded from the dissected samples. The growth plate from 1-wk rats were divided into: epiphyseal cartilage, resting zone, proliferative zone, proliferative-hypertrophic transition zone, and hypertrophic zone. To minimize cross-contamination between resting zone and proliferative zone, the uppermost part of the proliferative columns and the lowest part of resting zone was discarded. Due to decreasing growth plate height, the growth plates from older animals could not be microdissected into four individual zones, and therefore only the central portion of the growth plate, including the proliferative and the proliferative-hypertrophic transition zone, was collected from 3-, 6-, 9-, and 12-week-old animals. For each zone, tissue dissected from both proximal tibias of one animal (approximately 25 sections) was pooled prior to RNA isolation. RNA isolation was performed as previously described except that one tenth of every volume was used [13]. Approximately 30–200 ng of total RNA was extracted from each zone of the growth plate in individual 1-week-old rats and at least 200 ng of total RNA per animal was extracted from the central portion of growth plate cartilage dissected from 3-, 6-, 9-, and 12-week-old rats. The 28S/18S ratio was assessed using a Bioanalyzer 2100 (Agilent Biotechnologies, Inc., Palo Alto, CA), and only high quality RNA (28S/18S > 1.8) was used.
Microarray Analysis
Microarray analysis was performed as previously described [12]. Briefly, total RNA extracted from resting zone (n = 5), proliferative zone (n = 5), hypertrophic zone (n = 5) from 1-week-old rats and from growth plate cartilage of of 3-, 6-, 9-, and 12-week-old rats (n = 5 each) was amplified and labeled using the Two-Cycle Target Labeling and Control Reagents (Affymetrix, P/N 900494) according to Expression Analysis Technical Manual, version 701021 Rev.5 (Affymetrix). Rat Genome 230 2.0 GeneChip Arrays (Affymetrix) were hybridized with a hybridization cocktail containing 15 μg of fragmented, labeled cRNA. After hybridization, the arrays were washed and stained using a Fluidics Station FS-400 (Affymetrix) following the EukGE-WS2v5 protocol and scanned using a GeneChip Scanner 3000.
Statistical and Bioinformatic analysis of microarray data
Affymetrix CEL files were imported into Partek Genomics Suite™ 6.3 (Partek Inc., St. Louis, MO) using the default Partek normalization parameters. Probe-level data were pre-processed, including background correction, normalization, and summarization, using robust multi-array average (RMA) analysis. RMA adjusts for background noise on each array using only the PM probe intensities; and subsequently normalizes data across all arrays using quantile normalization[14, 15] followed by median polish summarization to generate a single measure of expression [15]. These expression measures were then log transformed, base 2. ANOVA analysis was performed for spatial and temporal comparisons using Partek Pro software (Partek Inc.). The data have been deposited in NCBI’s Gene Expression Omnibus [16] and are accessible through GEO Series accession number GSE16981(http://www.ncbi.nlm.nih.gov/geo/query/acc.cgi?acc=GSE16981).
To identify useful molecular markers for each major zone of the growth plate (resting, proliferative, and hypertrophic), we used an empirical formula that gave high rank to genes that were expressed at high levels in a particular zone and at low levels in both of the other two major zones. Using the resting zone as an example, the formula was: score = (P + H + MR)/R, where R = expression level in resting zone, P = expression level in proliferative zone, H = expression level in hypertrophic zone, and MR = geometric mean expression of all genes in the resting zone. This formula was applied to each probe set, and then genes were ranked from lowest to highest score.
To identify useful molecular markers for growth plate senescence, we used analogous empirical formulas that gave high rank to genes that were expressed at high levels only in either the young growth plate cartilage (3 wk) or the old growth plate cartilage (12 wk). The formula to identify markers for young growth plate cartilage was: score = (L + MY)/Y, where L = expression level at 12 wk, Y = expression level at 3 wk, MY = geometric mean expression of all genes at 3 wk. Similarly, the formula to identify markers for old growth plate cartilage was: score = (Y + ML)/L, where ML = geometric mean expression of all genes at 12 wk.
Ingenuity Pathways Analysis Software 7.0 (Ingenuity Systems Inc, Redwood City, CA) was used to identify functional pathways that were regulated spatially or temporally. These pathways represent sets of genes that participate in a common well-defined biological function. The analysis included genes that showed either an increase or decrease in expression with P < 0.01 by ANOVA. To avoid systems that were not likely to be biologically relevant, we did not include functional pathways that are organ-specific or disease-specific in our analysis. Heat maps were then constructed using JMP 7 software (SAS Institute Inc., Cary, NC) to visualize changes in expression of genes participating in specific functional pathways. In addition, we looked specifically for significant changes in expression of transcription factors that have been reported to be involved in chondrocyte regulation.
Quantitative real-time PCR
Total RNA (50–100 ng) were reverse-transcribed into complementary DNA using Superscript III Reverse Transcriptase (Invitrogen) and primed by random hexamers according to manufacturer’s instructions. Expression levels of selected mRNAs were quantified by real-time PCR using an ABI Prism 7500 Fast sequence detector (Applied Biosystems), according to manufacturer’s instructions. The following pre-designed assays (Applied Biosystems) were used: Pcp4, Rn00564515_m1; Sfrp5, Rn01766277_m1; Efemp1, Rn01434325_m1; Lrrc17, Rn01442518_m1; Pcdh17, Rn0166237_m1; Prelp, Rn00584526_m1; c-Fos, Rn02396759_m1; Hif1a, Rn01472834_m1; Atf3, Rn00563784_m1; Frzb, Rn01746979_m1; Fgl2, Rn00584935_m1; Matn1, Rn01519781_m1; Irx4, Rn01537358_m1; Syt8, Rn00584120_m1; Tm4sf1, Rn01494890_m1; and 18S ribosomal RNA (18S rRNA): 18S-4319413E. Each assay contains primer and specific intron-spanning FAM or VIC-labeled (18S ribosomal RNA) TaqMan probes. Quantitative PCR conditions were as follows: 1 cycle at 50°C for 2 min and 95°C for 10 min, followed by 40 cycles of 15 s at 95°C and 1 min at 60°C. Each sample, which represents a single skeletal region from a single animal, was run in triplicate for every assay along with 18S rRNA as a reference gene. 18S rRNA reportedly shows similar expression levels in different tissues and is therefore useful as an internal standard for quantitative comparison of mRNA levels[17, 18]. Triplicate threshold cycle (Ct) values were averaged and then normalized to that of 18S rRNA from the same sample to account for variability in cDNA loading. The quantity of each transcript was calculated relative to the amount of starting cDNA, taking into account the efficiency of the respective PCRs, using the formula: Relative Expressioni = [(Er) CTr/(Ei)CTi] × 107, where “r” represents 18S rRNA, and “i” represents the gene of interest. “E” represents efficiency of the respective PCR reaction, and CT represents the threshold cycle [12]. Relative expression values were multiplied by 107 to produce convenient numbers.
Generation of riboprobes for in situ hybridization
In situ hybridization was performed for Sfrp5, Gdf10, and Prelp in growth plate cartilage of 1-week-old rats. To generate templates for transcription of RNA probes, cDNA from 1-week-old rat growth plate was amplified using platinum taq (Invitrogen) and primers that contained either a T7 promoter or an SP6 promoter [19]:
Sfrp5 forward: TAATACGACTCACTATAGGGAGTGGGTGTCATGGCTAAGCA
Sfrp5 reverse: TGGATTTAGGTGACACTATAGAGCTGAGCCTGCACTCCAGTC
Gdf10 forward: TAATACGACTCACTATAGGGAGACCTGTGCCTGTCGGTAAGGT
Gdf10 reverse: TGGATTTAGGTGACACTATAGAGGCTCGGTGGACAGATCTTG
Prelp forward: TAATACGACTCACTATAGGGAGCCTGGACAACAACCGCATT
Prelp reverse: TGGATTTAGGTGACACTATAGACGGGATCCTGGAGATGAGGT
The cDNA was PCR amplified using 2720 Thermal Cycler (Applied Biosystems) at the following thermal cycling conditions: 94°C for 2 min, followed by 35 cycles of 94°C for 30 s, 55°C for 30 s, 72°C for 45 s, followed by a final hold of 72°C for 7 min. A second amplification was performed with the same parameters using 30 instead of 35 cycles. The PCR product was confirmed by a single band of the expected size by agarose gel electrophoresis and DNA sequencing. Single stranded riboprobes for in situ hybridization were transcribed using In Vitro Transcription Systems (Promega, Madison, WI) incorporating α-35S UTP and α-35S ATP (1250 Ci/mmol, MP Biomedicals). T7 polymerase was used for sense probes and Sp6 polymerase for antisense probes. Riboprobes were purified by Micro Bio-Spin Columns P-30 Tris RNase free (BioRad.). 35S incorporation was assessed by comparing radioactivity before and after the column purification, by liquid scintillation counting.
In situ hybridization
In situ hybridization was performed using frozen sections hybridized to 35S-labeled riboprobes as described by Zhou et al [20]. The sections were counterstained with hematoxylin and eosin. Silver grains were visualized by scanning the slides with ScanScope CS digital scanner (Aperio Technologies, Inc) under bright field microscopy. The corresponding sense riboprobe was used as a negative control for each antisense probe.
Statistical analysis
Data are presented as mean ± SEM. Comparison of expression levels in cartilage samples collected from rats of different ages was performed by one-way ANOVA using log-transformed relative expression data with age as the independent variable, followed by pair-wise comparisons corrected for multiple comparisons using the Holm-Sidak method. All three growth plate zones were collected from each 1-week-old animal. Therefore, individual growth plate zones of 1-week-old rats do not represent independent samples. Pair-wise comparisons of mRNA expression levels between individual growth plate zones of 1-week-old animals were therefore analyzed using paired t-tests. SigmaStat 3.1 statistical program was used to perform all statistical measures. All P-values were two-tailed, and significance was recognized at P < 0.05.
Results
The resting to proliferative transition
In the transition from the resting to the proliferative zone, expression of 677 genes was upregulated and expression of 631 genes was downregulated (with P < 0.01 by ANOVA, Table 1). Biological functions most strongly implicated in this step of differentiation included: skeletal and muscular system development and function, tissue development, cellular development, and cellular growth and proliferation, (all P < 10−5, Table 1). Functional pathways that were implicated in the resting to proliferative transition included: vitamin D receptor/retinoid x receptor (VDR/RXR) activation, platelet-derived growth factor (PDGF) signaling, BMP signaling, and notch signaling (all P < 0.05, Table 1).
Table 1. Resting Zone to Proliferative Zone.
Bioinformatic analysis of the genes changing from resting zone to proliferative zone in the growth plate cartilage of 1 wk old rats using the computer program Ingenuity Pathway Analysis 7.1.
| Upregulated Genes | No of genes |
|---|---|
| P <0.01 | 677 |
| P <0.01, ≥ 2.0 fold | 153 |
| Biological Functions | P value | No of genes |
|---|---|---|
| Cellular Development | 6.74E-06 | 29 |
| Cellular Growth and Proliferation | 6.74E-06 | 45 |
| Cell Morphology | 1.02E-04 | 14 |
| Cellular Compromise | 3.71E-04 | 13 |
| Cell Cycle | 6.06E-04 | 14 |
| Downregulated Genes | No of genes |
|---|---|
| P <0.01 | 631 |
| P <0.01, ≥ 2.0 fold | 241 |
| Biological Functions | P value | No of genes |
|---|---|---|
| Skeletal and Muscular System Development and Function | 8.68E-09 | 81 |
| Tissue Development | 8.27E-08 | 100 |
| Small Molecule Biochemistry | 2.31E-05 | 43 |
| DNA Replication, Recombination, and Repair | 2.31E-05 | 29 |
| Nucleic Acid Metabolism | 2.31E-05 | 16 |
| Functional Pathways | P value | Ratio* |
|---|---|---|
| VDR/RXR Activation | 1.710E-02 | 8/80 (10.0%) |
| PDGF Signaling | 3.027E-02 | 7/77 (9.1%) |
| BMP Signaling | 3.155E-02 | 7/80 (8.8%) |
| Notch Signaling | 3.184E-02 | 4/41 (9.8%) |
Ratio = number of molecules with P > 0.05/total number of molecules in the pathway
The proliferative to hypertrophic transition
In the transition from the proliferative to the hypertrophic zone, expression of 1717 genes was upregulated and expression of 1625 genes was downregulated (with P < 0.01 by ANOVA, Table 2). Biological functions most strongly implicated in hypertrophic differentiation included: cell cycle, cellular growth and proliferation, cellular movement, and cell death (all P < 10−7, Table 2). Functional pathways that were implicated in the proliferative to hypertrophic transition included: p53 signaling, cell cycle: G2/M regulation, cell cycle: G1/S regulation, ephrin receptor signaling, oncostatin M signaling, and BMP signaling (all P < 0.05, Table 2).
Table 2. Proliferative Zone to Hypertrophic Zone.
Bioinformatic analysis of the genes changing from proliferative zone to hypertrophic zone in the growth plate cartilage of 1 wk old rats using the computer program Ingenuity Pathway Analysis 7.1.
| Upregulated Genes | No of genes |
|---|---|
| P <0.01 | 1717 |
| P <0.01, ≥ 2.0 fold | 794 |
| Biological Functions | P value | No of genes |
|---|---|---|
| Cellular Growth and Proliferation | 6.41E-10 | 234 |
| Cellular Movement | 1.26E-09 | 152 |
| Cell Death | 1.87E-09 | 213 |
| Cell Morphology | 3.28E-08 | 133 |
| Cellular Development | 3.44E-08 | 181 |
| Downregulated Genes | No of genes |
|---|---|
| P <0.01 | 1625 |
| P <0.01, ≥ 2.0 fold | 635 |
| Biological Functions | P value | No of genes |
|---|---|---|
| Cell Cycle | 5.79E-10 | 224 |
| Cellular Growth and Proliferation | 2.25E-09 | 427 |
| Cell Death | 3.86E-08 | 396 |
| Skeletal and Muscular System Development and Function | 4.74E-07 | 98 |
| Cellular Movement | 1.93E-06 | 252 |
| Functional Pathways | P value | Ratio* |
|---|---|---|
| p53 Signaling | 1.726E-03 | 19/87 (21.8%) |
| Cell Cycle: G2/M Regulation | 5.140E-03 | 10/43 (23.3%) |
| Cell Cycle: G1/S Regulation | 1.832E-02 | 12/59 (20.3%) |
| Ephrin Receptor Signaling | 3.311E-02 | 28/193 (14.5%) |
| Oncostatin M Signaling | 3.698E-02 | 8/38 (21.1%) |
| BMP Signaling | 4.385E-02 | 15/80 (18.8%) |
Ratio = number of molecules with P > 0.05/total number of molecules in the pathway
Identification of molecular markers for each growth plate zone
To identify useful molecular markers for each zone of the growth plate, we used an empirical formula that gave high rank to genes that were expressed at high levels in a particular zone and at low levels in both of the other two major zones. For the resting zone, the highest-ranking marker was secreted frizzled-related sequence protein 5 (Sfrp5) which showed mRNA levels in the resting zone that were 15-fold higher than in the proliferative zone and 60-fold higher than in the hypertrophic zone (Fig. 1A; Table S1). Other candidate markers for the resting zone included bone morphogenetic protein 3 (Bmp3) and gremlin 1 (Grem1) two genes involved in BMP signaling, epidermal growth factor-containing fibulin-like extracellular matrix protein 1 (Efemp1), and collagen type 14 alpha 1 (Col14a).
Figure 1. Changes in gene expression (mean ± SEM) of spatial markers across the tibial growth plate of 1 wk old rats.

Different zones of the growth plate cartilage were micro-dissected. (A) The relative expression of mRNA in each zone was measured by expression microarray (Affymetrix Rat Genome Array 230 2.0). The data was background corrected and normalized using the MAS5 statistical algorithm. (B) The relative expression of Sfrp5, Pcp4, Efemp1, Lrrc17, Pcdh17, and Prelp was verified using quantitative real-time PCR. RZ, resting zone; PZ, proliferative zone; HZ, hypertrophic zone.
For the proliferative zone, the highest-ranking marker was growth differentiation factor 10 (Gdf10), which is a member of the BMP family and which showed mRNA levels in the proliferative zone that were 16-fold higher than in the resting zone and 110-fold higher than in the hypertrophic zone (Fig. 1A; Table S1). Other candidate markers for the proliferative zone included: Prelp, which is a cartilage extracellular matrix proteoglycan, and protocadherin 17 (Pcdh17).
For the hypertrophic zone, interestingly, the two highest-ranking markers were tissue non-specific alkaline phosphatase (Alp1) and collagen X (Col10a1), two widely used markers for hypertrophic chondrocytes (Fig. 1A; Table S1). Other candidate markers for the hypertrophic zone included Indian hedgehog (Ihh) and integrin binding sialoprotein (Ibsp).
To validate some of our microarray findings, the expression of 3 marker genes in resting zone (Sfrp5, Pcp4, Efemp1) and proliferative zone (Lrrc17, Pcdh17, Prelp) were corroborated using quantitative real-time PCR (Fig. 1B). In general, the expression pattern and fold changes observed in real-time PCR agreed with our microarray data. To further confirm our findings, the localization of several spatial markers in 1 week old growth plate was studied by in situ hybridization (Fig. 2). Signals for Sfrp5 were primarily present in the resting zone, whereas Gdf10 and Prelp were present exclusively in the proliferative zone, thus confirmed our microarray findings and justified the use of these genes as markers in the corresponding zones.
Figure 2. mRNA expression of Sfrp5, Gdf10, and Prelp in growth plate cartilage of 1-week-old rats by in situ hybridization.

Frozen sections were hybridized to 35S -labeled riboprobes. The corresponding sense riboprobe was used as a negative control for each antisense probe. Silver grains were visualized by scanning the slides with ScanScope CS digital scanner (Aperio Technologies, Inc) under bright field microscopy. The left hand panel in each row shows the proximal tibial at low magnification. The other panels show high magnification views of resting zone (RZ), proliferative zone (PZ), and hypertrophic zone (HZ) taken from within the rectanglar area indicated in the corresponding left hand panels. Scale bar, 500μm for low magnification; 50μm for high magnification.
Growth plate senescence - bioinformatic analysis
Changes associated with growth plate senescence were assessed by comparing gene expression in growth plate cartilage of 3-week-old versus 12-week-old rats. With age, expression of 1221 genes was upregulated and expression of 1046 genes was downregulated (with P < 0.01 by ANOVA, Table 3). Biological functions most strongly implicated in growth plate senescence included: skeletal and muscular system development and function, organ development, small molecule biochemistry, and cell death (all P < 10−5, Table 3). Functional pathways that were implicated in growth plate senescence included: eicosanoid signaling, VDR/RXR activation, p38 mitogen-activated protein kinase (MAPK) signaling, and Wnt/β-catenin signaling (all P < 0.05, Table 3).
Table 3. Senescence (3 wk to 12 wk).
Bioinformatic analysis of the genes changing in the proliferative zone from 3 wk to 12 wk old rats using the computer program Ingenuity Pathway Analysis 7.1.
| Upregulated Genes | No of genes |
|---|---|
| P <0.01 | 1221 |
| P <0.01, ≥ 2.0 fold | 173 |
| Biological Functions | P value | No of genes |
|---|---|---|
| Small Molecule Biochemistry | 6.29E-06 | 25 |
| Cell Death | 6.84E-06 | 38 |
| Cell Morphology | 8.75E-06 | 46 |
| Cellular Growth and Proliferation | 2.24E-05 | 57 |
| Cellular Function and Maintenance | 4.79E-05 | 9 |
| Downregulated Genes | No of genes |
|---|---|
| P <0.01 | 1046 |
| P <0.01, ≥ 2.0 fold, | 131 |
| Biological Functions | P value | No of genes |
|---|---|---|
| Skeletal and Muscular System Development and Function | 6.91E-09 | 52 |
| Organ Development | 3.74E-06 | 24 |
| Cellular Growth and Proliferation | 1.70E-05 | 106 |
| Cardiovascular System Development and Function | 1.70E-05 | 36 |
| Tissue Development | 2.97E-05 | 72 |
| Functional Pathways | P value | Ratio* |
|---|---|---|
| Eicosanoid Signaling | 7.063E-03 | 5/84 (6.0%) |
| VDR/RXR Activation | 1.033E-02 | 7/80 (8.8%) |
| p38 MAPK Signaling | 2.301E-02 | 6/95 (6.3%) |
| Wnt/β-catenin Signaling | 3.846E-02 | 9/165 (5.5%) |
Ratio = number of molecules with P > 0.05/total number of molecules in the pathway
Identification of molecular markers for growth plate senescence
To identify useful molecular markers for growth plate senescence, we used an empirical formula that is analogous to the formulas used for the spatial data but gave high rank to genes that were expressed at high levels in either 3-wks (youth markers) or 12-wks (aged markers). For the young growth plate, the highest-ranking marker was insulin-like growth factor 2 (Igf2), which showed mRNA levels 82-fold higher at 3-wks than at 12-wks (Fig. 3; Table S2). Other candidate youth markers included matrilin 1 (Matn1), frizzled-related protein (Frzb) and Wnt4. For the old growth plate, the highest-ranking marker was Pycard (PYD and CARD domain containing), which showed mRNA levels increased 9-fold from 3-wks to 12-wks of age (Fig. 2A: Table S2). Other candidate aged markers included Reelin (Reln), chondroadherin (Chad) and Igf binding protein 7 (Igfbp7). Similar to the spatial markers, the expression pattern of senescence markers observed in microarray was confirmed using real-time PCR (Fig. 2B; youth markers: Frzb, Fgl2, Matn1; aged markers: Irx4, Syt8, Tm4sf1).
Figure 3. Changes in gene expression (mean ± SEM) of senescence markers in the proliferative zone of 3, 6, 9, and 12 wk old rats.
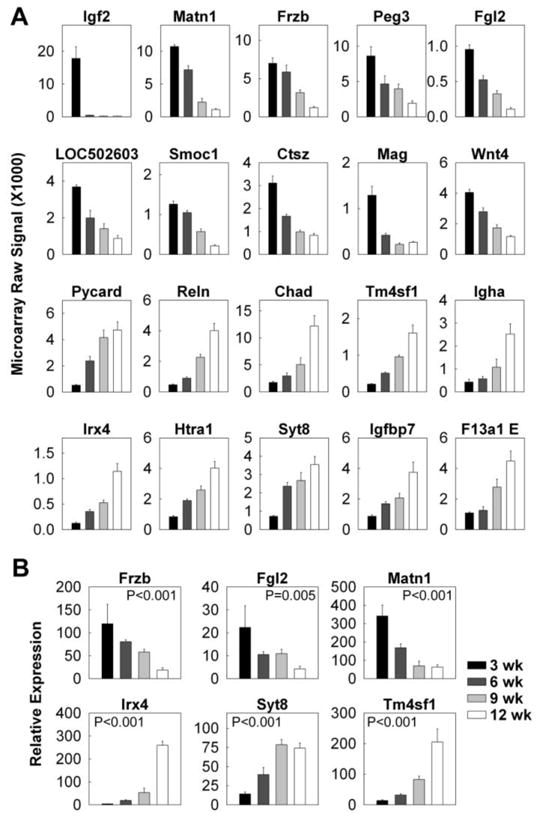
Proliferative zones of the growth plate cartilage were micro-dissected. (A) The relative expression of mRNA at different ages was measured by expression microarray (Affymetrix Rat Genome Array 230 2.0). The data was background corrected and normalized using the MAS5 statistical algorithm. (B) The relative expression of Frzb, Fgl2, Matn1, Irx4, Syt8, and Tm4sf1 was verified using quantitative real-time PCR.
Transcription factors implicated in regulation of growth plate chondrocyte functions
We also analyzed the spatial and temporal regulation of transcription factors that have previously been implicated in regulation of growth plate chondrocytes in our microarray (Fig. 4; Table 4). Some important transcription factors were being significantly regulated between the resting and proliferative zones (Dlx5, c-Fos, c-Maf, Nrf2, Runx2, Runx3, Sox6, upregulation; Hif1α, Shox2, downregulation), or between the proliferative and hypertrophic zones (Atf3, c-Fos, c-Maf, MafB, Mef2c, Mef2d, Runx2, Sox6, upregulation; Hif1α, Runx3, Shox2, downregulation) Some of these changes (c-Fos, Hif1α, Atf3) were confirmed using real-time PCR (Fig. 3B). Similarly, several transcription factors showed significant upregulation (Hif1α, Jun) or downregulation (Mef2c, Runx2, Runx3, Sox9) with age.
Figure 4. Spatial and Temporal changes in gene expression (mean ± SEM) of transcription factors implicated in growth plate cartilage.

(A) Relative expression of mRNA was measured by expression microarray (Affymetrix Rat Genome Array 230 2.0). Spatially, mRNA in different zones of growth plate of 1 wk old rats was compared. Temporally, mRNA in proliferative zone at 3, 6, 9 and 12 wk old rats was compared. The data was background corrected and normalized using the MAS5 statistical algorithm. *, P < 0.05 compared with the preceding zone; NS, not significant (B) For significant spatial changes, the relative expression of c-Fos, Hif1a, and Atf3 was verified using quantitative real-time PCR. RZ, resting zone; PZ, proliferative zone; HZ, hypertrophic zone.
Table 4. Transcription Factors Implicated in Chondrocyte Proliferation and Differentiation.
Summary of transcription factors implicated in chondrocyte proliferation and differentiation. Previously reported functions, and the temporal and spatial regulation observed in our microarray were tabulated.
| Our Observations | |||||
|---|---|---|---|---|---|
| Gene | Function in Growth Plate | RZ | PZ | HZ | Temporal |
| Atf2 | Promotes chondrocyte proliferation [49] | N.S. | N.S. | ||
| Atf3 | Upregulated during hypertrophic differentiation [50] | Low | Low | High | N.S. |
| Dlx5 | Promotes chondrocyte hypertrophy [51–53] | Low | High | High | N.S. |
| c-Fos | Suppresses chondrocyte differentiation in vitro [54] | Low | Middle | High | N.S. |
| Fra2 | Promotes chondrocyte hypertrophy [55] | N.S. | N.S. | ||
| Hif1 α | Mediates hypoxia-induced chondrocyte proliferation (suppresses proliferation) [56] | High | Middle | Low | Increased with age |
| Jun | Suppresses chondrocyte differentiation in vitro [54] | N.S. | Increased with age | ||
| c-Maf | Upregulated during chondrocyte differentiation [57] | Low | Middle | High | N.S. |
| MafB | Upregulated in degenerating cartilage [58] | Low | Low | High | N.S. |
| Mef2c | Promotes chondrocyte hypertrophy [59] | Low | Low | High | Decreased with age |
| Mef2d | Promotes chondrocyte hypertrophy [59] | Low | Low | High | N.S. |
| Nfat1 | Acts as a repressor of chondrocyte differentiation [60] | N.S. | N.S. | ||
| Nrf2 | Inhibits chondrocyte differentiation in vitro [61] | Low | High | High | N.S. |
| Runx2 | Promotes hypertrophic chondrocytes differentiation [62] | Low | Middle | High | Decreased with age |
| Runx3 | Promotes hypertrophic chondrocytes differentiation [62] | Low | High | Low | Decreased with age |
| Shox2 | Promotes cell-cycle exit and hypertrophic chondrocyte differentiation [63] | High | Middle | Low | N.S. |
| Sox6 | Promotes chondrocytes differentiation [64, 65] | Low | Middle | High | N.S. |
| Sox9 | Essential for cartilage formation and promotes early stages of chondrocyte differentiation [66] | N.S. | Decreased with age | ||
Relationship between spatial and temporal changes in growth plate chondrocytes
We hypothesized that the changes occurring during senescence in the proliferative zone might be similar to those occurring as resting chondrocytes differentitate into proliferative chondrocytes i.e. that with age growth plate chondrocytes become less like chondrocytic stem cells. We also considered the alternative hypothesis that the changes occurring during senescence in the proliferative zone might be similar to those occurring as proliferative chondrocytes differentitate into hypertrophic chondrocytes i.e. that with age growth plate chondrocytes move closer to the terminally-differentiated state. To test the likelihood of these hypotheses, we examined the 100 genes that were most up-regulated and 100 genes that were most down-regulated with age (3- vs. 12-weeks with P < 0.01). For these genes, we assessed the correlation, between their temporal regulation (change in expression with age) and their spatial regulation (change in expression between adjacent zones) (by Pearson pairwise correlation, Table 5). Temporal changes correlated significantly with proliferative-to-hypertrophic (r=0.1561, P=0.0273), but not the resting-to-proliferative changes (r=0.0160, P=0.8226). Consistent results were obtained when the correlation analysis was performed using significant genes in proliferative-to-hypertrophic comparison (r=0.1999, P=0.0045). Our data suggested that age-driven changes may share some similarities with the proliferative-to-hypertrophic transition, but the overlap appears to be modest.
Table 5. Correlation Between Spatial and Temporal Changes in the Growth Plate.
Correlation between temporal and spatial regulation of gene expression in the growth plate cartilage. The top 200 genes (P < 0.01, ranked by geometric fold change) that changed significantly either with age, resting to proliferative zone, or proliferative to hypertrophic were analyzed. Changes in mRNA levels were compared by correlation analysis. The correlation coefficients (r values) and P values were shown.
| Top 200 genes changing from 3 wk to 12 wk | ||
| Comparison between: | Pearson’s r value | P value |
| 3 to 12wk vs RZ to PZ | 0.0160 | 0.8226 |
| 3 to 12wk vs PZ to HZ | 0.1561 | 0.0273 |
| Top 200 genes changing from resting to proliferative zone: | ||
| Comparison between: | Pearson’s r value | P value |
| RZ to PZ vs 3 to 12wk | −0.1411 | 0.0462 |
| Top 200 genes changing from proliferative to hypertrophic zone: | ||
| Comparison between: | Pearson’s r value | P value |
| PZ to HZ vs 3 to 12wk | 0.1999 | 0.0045 |
Discussion
We used microdissection of growth plate tissue combined with microarray analysis to obtain an overall, unbiased assessment of how gene expression is regulated spatially and temporally in growth plate cartilage. We previously presented evidence supporting the validity of this approach [12]; we found strong agreement between relative gene expression levels in different zones of the growth plate evaluated using microarray and levels evaluated using real-time PCR. This agreement was confirmed for collagen type X, alkaline phosphatase, and multiple genes functionally related to BMP signaling. Because the microarray analysis and the real-time PCR analysis in that study were performed on different sets of samples, the findings also demonstrate the reproducibility of the microdissection. Furthermore, the strong localization of collagen X and alkaline phosphatase to the hypertrophic zone, which matched previous studies using in situ hybridization, suggesting that the microdissection into component zones is not just reproducible but also accurate. In that previous study, we focused only on the expression of BMP-related genes in the different zones of the growth plate. Here we report the overall results of the microarray study, including both spatial and temporal comparisons, using bioinformatic approaches to explore large-scale patterns in gene expression.
We first explored the spatial regulation of gene expression in the growth plate by comparing expression between different zones of the growth plates of 1-week-old rats. These differences in expression between zones represent the shifts in expression that occur as chondrocytes differentiate from the resting to the proliferative and then to the hypertrophic state. In the transition from the resting to the proliferative zone, the microarray analysis implicated several functional pathways: VDR/RXR activation, PDGF signaling, BMP signaling, and notch signaling. BMPs have already been shown to play an important regulatory role in the growth plate [12, 21, 22], including a role in differentiation of mesenchymal cells into chondrocytes [23], of proliferative chondrocytes into hypertrophic chondrocytes [4, 21, 23] and proliferation of resting zone chondrocytes [24]. PDGFs have been shown to stimulate proliferation of cultured growth plate chondrocytes [4, 25–28], but there is less information about their role in vivo. Members of the notch family and their receptors are expressed by hypertrophic chondrocytes [29], and was recently reported to play critical role in chondrocyte proliferation and differentiation [30]. Vitamin D receptor ablation in mice causes important growth plate abnormalities but this appears to be related to the resulting abnormal mineral homeostasis[31], and at least some of the direct effects of vitamin D on the growth plate appear not to be mediated by the nuclear vitamin D receptor.
In the transition from the proliferative to the hypertrophic zone, the microarray analysis implicated other functional pathways: p53 signaling, cell cycle: G2/M regulation, cell cycle: G1/S regulation, ephrin receptor signaling, oncostatin M signaling, and BMP signaling (all P < 0.05, Table 1, Figure 2). P53 may play a role in apoptosis of growth plate chondrocytes [32]. Ephrin receptors, which interact with membrane-bound ligands causing bidirectional signaling, have been implicated in bone remodeling [33] but not, to our knowledge, in growth plate biology previously. Similarly, Oncostatin M, a pleiotropic member of the interleukin-6 cytokine family [34], has not, to our knowledge, previously been implicated in growth plate biology.
We also used the microarray findings to identify potential molecular markers for each zone of the growth plate. We employed an empirical formula that allowed us to rank the genes based on their pattern of gene expression. Genes received a high rank only if they were well-expressed in the zone of interest and if the expression ratio between the zone of interest and both other zones was high. For the hypertrophic zone, two of the most frequently used markers, collagen type X, and tissue-nonspecific alkaline phosphatase emerged as the two best-ranked genes, which supports the validity of our approach. For resting zone and proliferative zone, equally well-established molecular markers have not previously been available. We identified potential markers that show greater than 10-fold specificity for each of these zones. Some but not all of these potential markers have known or suspected roles in chondrocyte biology. The identified mRNAs are likely to prove useful as markers for the resting and proliferative zones in studies using RNA-based methods, as we showed using in situ hybridization and real-time RT-PCR. Whether the proteins encoded by these mRNAs will prove useful as markers using immunohistochemistry or western blot analysis remains to be determined.
Our analysis implicated several functional pathways in the developmental program of growth plate senescence: eicosanoid signaling, VDR/RXR activation, p38 MAPK signaling, and Wnt/β-catenin signaling. Each of these pathways have previously been implicated in growth plate chondrocyte regulation [35–44] generally but not specifically in the programmed loss of function and other senescent changes that occur during postnatal life. Similar to identifying spatial markers, we used an empirical formula to identify molecular markers for growth plate senescence. This approach identified multiple genes that showed large increases in expression with age and other genes that showed large decreases. The expression level of these genes may be useful indicators of the maturational state and residual proliferative capacity of the growth plate chondrocytes, and therefore can be employed to study processes that delay [10] or accelerate [45] growth plate senescence.
Transcription factors that have previously been implicated in the regulation of growth plate chondrocyte proliferation and differentiation showed complex spatial and temporal expression patterns. Some of the transcription factors that have been previously implicated in hypertrophic differentiation such as Atf3, Mef2c, Mef2d, and Runx2, were upregulated in the proliferative to hypertrophic transition of the 1-week postnatal rat growth plate. Koziel et al. reported that Gli3 represses the transition from round into columnar chondrocytes [46]. Except for that finding, transcription factors that regulate the resting to proliferative transition and the progression of senescence have not been well studied. Consequently, the current findings regarding the spatial and temporal expression patterns of transcription factors suggest new roles for these factors in switching gene expression to induce the resting to proliferative and proliferative to hypertrophic transition, as well as the complex changes associated with growth plate senescence.
Although bioinformatic analysis of expression microarray findings can identify important functional pathways involved in a physiological, pathological, or pharmacological process, this approach is neither completely sensitive nor specific. For example, downregulated expression of a single key gene in a signal transduction pathway might abrogate signaling, and yet the pathway as a whole might not be identified by a bioinformatic analysis. Conversely, significantly downregulated expression of multiple genes within a pathway does not prove a functional role for that pathway. Therefore, the findings in the current study can only be considered as hypothesis generating. For each of the novel pathways implicated, additional studies are needed to confirm the expression findings using independent methods and to investigate the functional role.
There have been other studies recently published that used microarray analysis to investigate gene expression within the mammalian growth plate. There are important differences between the current study and these previous studies, and therefore our study complements rather than replicates previous findings. Wang et al. [47] compared gene expression in the proliferative zone and hypertrophic zone of 6–7 week-old rats and identified genes that were highly expressed in both zones and genes that were differentially expressed. Their analysis implicated BMP signaling as important in the proliferative to hypertrophic transition, a finding supported by our data. Similarly, Belluoccio et al. [48] used microarray analysis to investigate genes that were differentially expressed in the proliferative, prehypertrophic and hypertrophic zones of 14-day-old mice. Our study differs in that it included resting zone, analyzed temporal as well as zonal effects on gene expression, used a larger number of samples per zone, and involved younger animals (1-week-old). We then used bioinformatic algorithms that implicated multiple functional pathways in the resting-proliferative transition, proliferative-hypertrophic transition, and senescence of growth plate chondrocytes with statistical significance.
In summary, we have used microdissection to collect individual growth plate zones from proximal tibiae of 1-wk rats and the PZ and early hypertrophic zones of growth plates from 3-, 6-, 9-, and 12-wk rats and used microarray to analyze global gene expression. Bioinformatic analyses of the gene expression data confirmed previously known and implicated novel biological functions, molecular pathways, transcription factors and markers for spatially-associated chondrocyte differentiation and temporally-associated senescence. In addition, comparison of gene expression changes during chondrocyte differentiation and senescence did not reveal a substantial overlap, thus suggesting that the mechanisms that block proliferation as chondrocytes hypertrophy is different from those that restrict proliferation with increasing age.
Supplementary Material
Acknowledgments
This research was supported by the Intramural Research Program of the Eunice Kennedy Shriver National Institute of Child Health and Human Development, NIH. Ola Nilsson was supported by grants from the Swedish Research Council (K2007-52X-20316-01-4), the Swedish Society of Medical Research, HKH kronprinsessan Lovisas Förening för Barnasjukvård, Sällskapet Barnavård, and Stiftelsen Frimurare Barnhuset i Stockholm.
Footnotes
Disclosure statement: The authors of this manuscript have nothing to declare.
Publisher's Disclaimer: This is a PDF file of an unedited manuscript that has been accepted for publication. As a service to our customers we are providing this early version of the manuscript. The manuscript will undergo copyediting, typesetting, and review of the resulting proof before it is published in its final citable form. Please note that during the production process errors may be discovered which could affect the content, and all legal disclaimers that apply to the journal pertain.
Reference List
- 1.Schrier L, Ferns SP, Barnes KM, Emons JA, Newman EI, Nilsson O, Baron J. Depletion of resting zone chondrocytes during growth plate senescence. J Endocrinol. 2006;189:27–36. doi: 10.1677/joe.1.06489. [DOI] [PubMed] [Google Scholar]
- 2.Abad V, Meyers JL, Weise M, Gafni RI, Barnes KM, Nilsson O, Bacher JD, Baron J. The role of the resting zone in growth plate chondrogenesis. Endocrinology. 2002;143:1851–7. doi: 10.1210/endo.143.5.8776. [DOI] [PubMed] [Google Scholar]
- 3.Kobayashi T, Soegiarto DW, Yang Y, Lanske B, Schipani E, McMahon AP, Kronenberg HM. Indian hedgehog stimulates periarticular chondrocyte differentiation to regulate growth plate length independently of PTHrP. J Clin Invest. 2005;115:1734–42. doi: 10.1172/JCI24397. [DOI] [PMC free article] [PubMed] [Google Scholar]
- 4.Kobayashi T, Lyons KM, McMahon AP, Kronenberg HM. BMP signaling stimulates cellular differentiation at multiple steps during cartilage development. Proc Natl Acad Sci U S A. 2005;102:18023–7. doi: 10.1073/pnas.0503617102. [DOI] [PMC free article] [PubMed] [Google Scholar]
- 5.Ornitz DM, Marie PJ. FGF signaling pathways in endochondral and intramembranous bone development and human genetic disease. Genes Dev. 2002;16:1446–65. doi: 10.1101/gad.990702. [DOI] [PubMed] [Google Scholar]
- 6.Walker KV, Kember NF. Cell kinetics of growth cartilage in the rat tibia. II. Measurements during ageing. Cell Tissue Kinet. 1972;5:409–19. doi: 10.1111/j.1365-2184.1972.tb00379.x. [DOI] [PubMed] [Google Scholar]
- 7.Nilsson O, Baron J. Fundamental limits on longitudinal bone growth: growth plate senescence and epiphyseal fusion. Trends Endocrinol Metab. 2004;15:370–4. doi: 10.1016/j.tem.2004.08.004. [DOI] [PubMed] [Google Scholar]
- 8.Lazarus JE, Hegde A, Andrade AC, Nilsson O, Baron J. Fibroblast growth factor expression in the postnatal growth plate. Bone. 2007;40:577–86. doi: 10.1016/j.bone.2006.10.013. [DOI] [PubMed] [Google Scholar]
- 9.Parker EA, Hegde A, Buckley M, Barnes KM, Baron J, Nilsson O. Spatial and temporal regulation of GH-IGF-related gene expression in growth plate cartilage. J Endocrinol. 2007;194:31–40. doi: 10.1677/JOE-07-0012. [DOI] [PubMed] [Google Scholar]
- 10.Marino R, Hegde A, Barnes KM, Schrier L, Emons JA, Nilsson O, Baron J. Catch-up growth after hypothyroidism is caused by delayed growth plate senescence. Endocrinology. 2008;149:1820–8. doi: 10.1210/en.2007-0993. [DOI] [PMC free article] [PubMed] [Google Scholar]
- 11.National Research Council. Guide for the Care and Use of Laboratory Animals. National Academy Press; Washington, DC: 2003. [Google Scholar]
- 12.Nilsson O, Parker EA, Hegde A, Chau M, Barnes KM, Baron J. Gradients in bone morphogenetic protein-related gene expression across the growth plate. J Endocrinol. 2007;193:75–84. doi: 10.1677/joe.1.07099. [DOI] [PubMed] [Google Scholar]
- 13.Heinrichs C, Yanovski JA, Roth AH, Yu YM, Domene HM, Yano K, Cutler GB, Jr, Baron J. Dexamethasone increases growth hormone receptor messenger ribonucleic acid levels in liver and growth plate. Endocrinology. 1994;135:1113–8. doi: 10.1210/endo.135.3.8070354. [DOI] [PubMed] [Google Scholar]
- 14.Bolstad BM, Irizarry RA, Astrand M, Speed TP. A comparison of normalization methods for high density oligonucleotide array data based on variance and bias. Bioinformatics. 2003;19:185–93. doi: 10.1093/bioinformatics/19.2.185. [DOI] [PubMed] [Google Scholar]
- 15.Irizarry RA, Hobbs B, Collin F, Beazer-Barclay YD, Antonellis KJ, Scherf U, Speed TP. Exploration, normalization, and summaries of high density oligonucleotide array probe level data. Biostatistics. 2003;4:249–64. doi: 10.1093/biostatistics/4.2.249. [DOI] [PubMed] [Google Scholar]
- 16.Edgar R, Domrachev M, Lash AE. Gene Expression Omnibus: NCBI gene expression and hybridization array data repository. Nucleic Acids Res. 2002;30:207–10. doi: 10.1093/nar/30.1.207. [DOI] [PMC free article] [PubMed] [Google Scholar]
- 17.Goidin D, Mamessier A, Staquet MJ, Schmitt D, Berthier-Vergnes O. Ribosomal 18S RNA prevails over glyceraldehyde-3-phosphate dehydrogenase and beta-actin genes as internal standard for quantitative comparison of mRNA levels in invasive and noninvasive human melanoma cell subpopulations. Anal Biochem. 2001;295:17–21. doi: 10.1006/abio.2001.5171. [DOI] [PubMed] [Google Scholar]
- 18.Tsuji N, Kamagata C, Furuya M, Kobayashi D, Yagihashi A, Morita T, Horita S, Watanabe N. Selection of an internal control gene for quantitation of mRNA in colonic tissues. Anticancer Res. 2002;22:4173–8. [PubMed] [Google Scholar]
- 19.Divjak M, Glare EM, Walters EH. Improvement of non-radioactive in situ hybridization in human airway tissues: use of PCR-generated templates for synthesis of probes and an antibody sandwich technique for detection of hybridization. J Histochem Cytochem. 2002;50:541–8. doi: 10.1177/002215540205000411. [DOI] [PubMed] [Google Scholar]
- 20.Zhou J, Chin E, Bondy C. Cellular pattern of insulin-like growth factor-I (IGF-I) and IGF-I receptor gene expression in the developing and mature ovarian follicle. Endocrinology. 1991;129:3281–8. doi: 10.1210/endo-129-6-3281. [DOI] [PubMed] [Google Scholar]
- 21.Pogue R, Lyons K. BMP signaling in the cartilage growth plate. Curr Top Dev Biol. 2006;76:1–48. doi: 10.1016/S0070-2153(06)76001-X. [DOI] [PubMed] [Google Scholar]
- 22.De Luca F, Barnes KM, Uyeda JA, De-Levi S, Abad V, Palese T, Mericq V, Baron J. Regulation of growth plate chondrogenesis by bone morphogenetic protein-2. Endocrinology. 2001;142:430–6. doi: 10.1210/endo.142.1.7901. [DOI] [PubMed] [Google Scholar]
- 23.Solomon LA, Berube NG, Beier F. Transcriptional regulators of chondrocyte hypertrophy. Birth Defects Res C Embryo Today. 2008;84:123–30. doi: 10.1002/bdrc.20124. [DOI] [PubMed] [Google Scholar]
- 24.De Luca F, Barnes KM, Uyeda JA, De-Levi S, Abad V, Palese T, Mericq V, Baron J. Regulation of growth plate chondrogenesis by bone morphogenetic protein-2. Endocrinology. 2001;142:430–6. doi: 10.1210/endo.142.1.7901. [DOI] [PubMed] [Google Scholar]
- 25.Olney RC, Wang J, Sylvester JE, Mougey EB. Growth factor regulation of human growth plate chondrocyte proliferation in vitro. Biochem Biophys Res Commun. 2004;317:1171–82. doi: 10.1016/j.bbrc.2004.03.170. [DOI] [PubMed] [Google Scholar]
- 26.Bulman WA, Iannotti JP, Glowacki K, Bleuit J, Clark CC. Serum fractions and related agonists with calcium-mobilizing activity in the bovine growth plate chondrocyte. J Orthop Res. 1995;13:220–9. doi: 10.1002/jor.1100130210. [DOI] [PubMed] [Google Scholar]
- 27.Hiraki Y, Inoue H, Hirai R, Kato Y, Suzuki F. Effect of transforming growth factor beta on cell proliferation and glycosaminoglycan synthesis by rabbit growth-plate chondrocytes in culture. Biochim Biophys Acta. 1988;969:91–9. doi: 10.1016/0167-4889(88)90092-4. [DOI] [PubMed] [Google Scholar]
- 28.Wroblewski J, Edwall C. PDGF BB stimulates proliferation and differentiation in cultured chondrocytes from rat rib growth plate. Cell Biol Int Rep. 1992;16:133–44. doi: 10.1016/s0309-1651(06)80107-4. [DOI] [PubMed] [Google Scholar]
- 29.Hayes AJ, Dowthwaite GP, Webster SV, Archer CW. The distribution of Notch receptors and their ligands during articular cartilage development. J Anat. 2003;202:495–502. doi: 10.1046/j.1469-7580.2003.00185.x. [DOI] [PMC free article] [PubMed] [Google Scholar]
- 30.Mead TJ, Yutzey KE. Notch pathway regulation of chondrocyte differentiation and proliferation during appendicular and axial skeleton development. Proc Natl Acad Sci U S A. 2009;106:14420–5. doi: 10.1073/pnas.0902306106. [DOI] [PMC free article] [PubMed] [Google Scholar]
- 31.Demay MB. Mechanism of vitamin D receptor action. Ann N Y Acad Sci. 2006;1068:204–13. doi: 10.1196/annals.1346.026. [DOI] [PubMed] [Google Scholar]
- 32.Ohyama K, Chung CH, Chen E, Gibson CW, Misof K, Fratzl P, Shapiro IM. p53 influences mice skeletal development. J Craniofac Genet Dev Biol. 1997;17:161–71. [PubMed] [Google Scholar]
- 33.Edwards CM, Mundy GR. Eph receptors and ephrin signaling pathways: a role in bone homeostasis. Int J Med Sci. 2008;5:263–72. doi: 10.7150/ijms.5.263. [DOI] [PMC free article] [PubMed] [Google Scholar]
- 34.Chen SH, Benveniste EN. Oncostatin M: a pleiotropic cytokine in the central nervous system. Cytokine Growth Factor Rev. 2004;15:379–91. doi: 10.1016/j.cytogfr.2004.06.002. [DOI] [PubMed] [Google Scholar]
- 35.Andrade AC, Nilsson O, Barnes KM, Baron J. Wnt gene expression in the post-natal growth plate: regulation with chondrocyte differentiation. Bone. 2007;40:1361–9. doi: 10.1016/j.bone.2007.01.005. [DOI] [PMC free article] [PubMed] [Google Scholar]
- 36.Li TF, Zuscik MJ, Ionescu AM, Zhang X, Rosier RN, Schwarz EM, Drissi H, O’Keefe RJ. PGE2 inhibits chondrocyte differentiation through PKA and PKC signaling. Exp Cell Res. 2004;300:159–69. doi: 10.1016/j.yexcr.2004.06.019. [DOI] [PubMed] [Google Scholar]
- 37.Rosado E, Schwartz Z, Sylvia VL, Dean DD, Boyan BD. Transforming growth factor-beta1 regulation of growth zone chondrocytes is mediated by multiple interacting pathways. Biochim Biophys Acta. 2002;1590:1–15. doi: 10.1016/s0167-4889(02)00194-5. [DOI] [PubMed] [Google Scholar]
- 38.Sylvia VL, Del TF, Jr, Hardin RR, Dean DD, Boyan BD, Schwartz Z. Characterization of PGE(2) receptors (EP) and their role as mediators of 1alpha,25-(OH)(2)D(3) effects on growth zone chondrocytes. J Steroid Biochem Mol Biol. 2001;78:261–74. doi: 10.1016/s0960-0760(01)00099-1. [DOI] [PubMed] [Google Scholar]
- 39.Agoston H, Khan S, James CG, Gillespie JR, Serra R, Stanton LA, Beier F. C-type natriuretic peptide regulates endochondral bone growth through p38 MAP kinase-dependent and -independent pathways. BMC Dev Biol. 2007;7:18. doi: 10.1186/1471-213X-7-18. [DOI] [PMC free article] [PubMed] [Google Scholar]
- 40.Lai LP, DaSilva KA, Mitchell J. Regulation of Indian hedgehog mRNA levels in chondrocytic cells by ERK1/2 and p38 mitogen-activated protein kinases. J Cell Physiol. 2005;203:177–85. doi: 10.1002/jcp.20208. [DOI] [PubMed] [Google Scholar]
- 41.Stanton LA, Sabari S, Sampaio AV, Underhill TM, Beier F. p38 MAP kinase signalling is required for hypertrophic chondrocyte differentiation. Biochem J. 2004;378:53–62. doi: 10.1042/BJ20030874. [DOI] [PMC free article] [PubMed] [Google Scholar]
- 42.Chen M, Zhu M, Awad H, Li TF, Sheu TJ, Boyce BF, Chen D, O’Keefe RJ. Inhibition of beta-catenin signaling causes defects in postnatal cartilage development. J Cell Sci. 2008;121:1455–65. doi: 10.1242/jcs.020362. [DOI] [PMC free article] [PubMed] [Google Scholar]
- 43.Wang L, Shao YY, Ballock RT. Thyroid hormone interacts with the Wnt/beta-catenin signaling pathway in the terminal differentiation of growth plate chondrocytes. J Bone Miner Res. 2007;22:1988–95. doi: 10.1359/jbmr.070806. [DOI] [PubMed] [Google Scholar]
- 44.Dong YF, Soung DY, Chang Y, Enomoto-Iwamoto M, Paris M, O’Keefe RJ, Schwarz EM, Drissi H. Transforming growth factor-beta and Wnt signals regulate chondrocyte differentiation through Twist1 in a stage-specific manner. Mol Endocrinol. 2007;21:2805–20. doi: 10.1210/me.2007-0199. [DOI] [PubMed] [Google Scholar]
- 45.Weise M, De-Levi S, Barnes KM, Gafni RI, Abad V, Baron J. Effects of estrogen on growth plate senescence and epiphyseal fusion. Proc Natl Acad Sci U S A. 2001;98:6871–6. doi: 10.1073/pnas.121180498. [DOI] [PMC free article] [PubMed] [Google Scholar]
- 46.Koziel L, Wuelling M, Schneider S, Vortkamp A. Gli3 acts as a repressor downstream of Ihh in regulating two distinct steps of chondrocyte differentiation. Development. 2005;132:5249–60. doi: 10.1242/dev.02097. [DOI] [PubMed] [Google Scholar]
- 47.Wang Y, Middleton F, Horton JA, Reichel L, Farnum CE, Damron TA. Microarray analysis of proliferative and hypertrophic growth plate zones identifies differentiation markers and signal pathways. Bone. 2004;35:1273–93. doi: 10.1016/j.bone.2004.09.009. [DOI] [PubMed] [Google Scholar]
- 48.Belluoccio D, Bernardo BC, Rowley L, Bateman JF. A microarray approach for comparative expression profiling of the discrete maturation zones of mouse growth plate cartilage. Biochim Biophys Acta. 2008;1779:330–40. doi: 10.1016/j.bbagrm.2008.02.010. [DOI] [PubMed] [Google Scholar]
- 49.Reimold AM, Grusby MJ, Kosaras B, Fries JW, Mori R, Maniwa S, Clauss IM, Collins T, Sidman RL, Glimcher MJ, Glimcher LH. Chondrodysplasia and neurological abnormalities in ATF-2-deficient mice. Nature. 1996;379:262–5. doi: 10.1038/379262a0. [DOI] [PubMed] [Google Scholar]
- 50.James CG, Woods A, Underhill TM, Beier F. The transcription factor ATF3 is upregulated during chondrocyte differentiation and represses cyclin D1 and A gene transcription. BMC Mol Biol. 2006;7:30. doi: 10.1186/1471-2199-7-30. [DOI] [PMC free article] [PubMed] [Google Scholar]
- 51.Robledo RF, Rajan L, Li X, Lufkin T. The Dlx5 and Dlx6 homeobox genes are essential for craniofacial, axial, and appendicular skeletal development. Genes Dev. 2002;16:1089–101. doi: 10.1101/gad.988402. [DOI] [PMC free article] [PubMed] [Google Scholar]
- 52.Chin HJ, Fisher MC, Li Y, Ferrari D, Wang CK, Lichtler AC, Dealy CN, Kosher RA. Studies on the role of Dlx5 in regulation of chondrocyte differentiation during endochondral ossification in the developing mouse limb. Dev Growth Differ. 2007;49:515–21. doi: 10.1111/j.1440-169X.2007.00940.x. [DOI] [PubMed] [Google Scholar]
- 53.Bendall AJ, Hu G, Levi G, Bate-Shen C. Dlx5 regulates chondrocyte differentiation at multiple stages. Int J Dev Biol. 2003;47:335–44. [PubMed] [Google Scholar]
- 54.Kameda T, Watanabe H, Iba H. C-Jun and JunD suppress maturation of chondrocytes. Cell Growth Differ. 1997;8:495–503. [PubMed] [Google Scholar]
- 55.Karreth F, Hoebertz A, Scheuch H, Eferl R, Wagner EF. The AP1 transcription factor Fra2 is required for efficient cartilage development. Development. 2004;131:5717–25. doi: 10.1242/dev.01414. [DOI] [PubMed] [Google Scholar]
- 56.Schipani E. Hypoxia and HIF-1alpha in chondrogenesis. Ann N Y Acad Sci. 2006;1068:66–73. doi: 10.1196/annals.1346.009. [DOI] [PubMed] [Google Scholar]
- 57.Sakai M, Imaki J, Yoshida K, Ogata A, Matsushima-Hibaya Y, Kuboki Y, Nishizawa M, Nishi S. Rat maf related genes: specific expression in chondrocytes, lens and spinal cord. Oncogene. 1997;14:745–50. doi: 10.1038/sj.onc.1200869. [DOI] [PubMed] [Google Scholar]
- 58.Appleton CT, Pitelka V, Henry J, Beier F. Global analyses of gene expression in early experimental osteoarthritis. Arthritis Rheum. 2007;56:1854–68. doi: 10.1002/art.22711. [DOI] [PubMed] [Google Scholar]
- 59.Arnold MA, Kim Y, Czubryt MP, Phan D, McAnally J, Qi X, Shelton JM, Richardson JA, Bassel-Duby R, Olson EN. MEF2C transcription factor controls chondrocyte hypertrophy and bone development. Dev Cell. 2007;12:377–89. doi: 10.1016/j.devcel.2007.02.004. [DOI] [PubMed] [Google Scholar]
- 60.Ranger AM, Gerstenfeld LC, Wang J, Kon T, Bae H, Gravallese EM, Glimcher MJ, Glimcher LH. The nuclear factor of activated T cells (NFAT) transcription factor NFATp (NFATc2) is a repressor of chondrogenesis. J Exp Med. 2000;191:9–22. doi: 10.1084/jem.191.1.9. [DOI] [PMC free article] [PubMed] [Google Scholar]
- 61.Hinoi E, Takarada T, Fujimori S, Wang L, Iemata M, Uno K, Yoneda Y. Nuclear factor E2 p45-related factor 2 negatively regulates chondrogenesis. Bone. 2007;40:337–44. doi: 10.1016/j.bone.2006.08.016. [DOI] [PubMed] [Google Scholar]
- 62.Yoshida CA, Komori T. Role of Runx proteins in chondrogenesis. Crit Rev Eukaryot Gene Expr. 2005;15:243–54. doi: 10.1615/critreveukargeneexpr.v15.i3.60. [DOI] [PubMed] [Google Scholar]
- 63.Marchini A, Marttila T, Winter A, Caldeira S, Malanchi I, Blaschke RJ, Hacker B, Rao E, Karperien M, Wit JM, Richter W, Tommasino M, Rappold GA. The short stature homeodomain protein SHOX induces cellular growth arrest and apoptosis and is expressed in human growth plate chondrocytes. J Biol Chem. 2004;279:37103–14. doi: 10.1074/jbc.M307006200. [DOI] [PubMed] [Google Scholar]
- 64.Smits P, Dy P, Mitra S, Lefebvre V. Sox5 and Sox6 are needed to develop and maintain source, columnar, and hypertrophic chondrocytes in the cartilage growth plate. J Cell Biol. 2004;164:747–58. doi: 10.1083/jcb.200312045. [DOI] [PMC free article] [PubMed] [Google Scholar]
- 65.Smits P, Li P, Mandel J, Zhang Z, Deng JM, Behringer RR, de CB, Lefebvre V. The transcription factors L-Sox5 and Sox6 are essential for cartilage formation. Dev Cell. 2001;1:277–90. doi: 10.1016/s1534-5807(01)00003-x. [DOI] [PubMed] [Google Scholar]
- 66.Wright E, Hargrave MR, Christiansen J, Cooper L, Kun J, Evans T, Gangadharan U, Greenfield A, Koopman P. The Sry-related gene Sox9 is expressed during chondrogenesis in mouse embryos. Nat Genet. 1995;9:15–20. doi: 10.1038/ng0195-15. [DOI] [PubMed] [Google Scholar]
Associated Data
This section collects any data citations, data availability statements, or supplementary materials included in this article.