

Abstract
Viral proteins can have multiple effects on host cell biology. Human respiratory syncytial virus (HRSV) nonstructural protein 1 (NS1) is a good example of this. During the virus life cycle, NS1 can act as an antagonist of host type I and III interferon production and signaling, inhibit apoptosis, suppress dendritic cell maturation, control protein stability, and regulate transcription of host cell mRNAs, among other functions. It is likely that NS1 performs these different roles through interactions with multiple host cell proteins. To investigate this and identify cellular proteins that could interact with NS1, we used quantitative proteomics in combination with green fluorescent protein (GFP)-trap immunoprecipitation and bioinformatic analysis. This analysis identified 221 proteins that were potentially part of complexes that could interact with NS1, with many of these associated with transcriptional regulation as part of the mediator complex, cell cycle regulation, and other functions previously assigned to NS1. Specific immunoprecipitation using the GFP trap was used to confirm the ability of selected cellular proteins to interact individually with NS1. Infection of A549 cells with recombinant viruses deficient in the expression of NS1 and overexpression analysis both demonstrated that NS1 was necessary and sufficient for the enrichment of cells in the G1 phase of the cell cycle.
INTRODUCTION
Human respiratory syncytial virus (HRSV) is a negative-sense RNA virus belonging to the order Mononegavirales. HRSV is a leading cause of serious lower respiratory tract infections in infants and young children (23) and causes repeated infections throughout life, in part due to the heterogeneity of the virus (9). The severity of illness varies from bronchiolitis and pneumonia to common cold-like symptoms. Particular individuals at higher risk of disease include preterm infants, the immunocompromised, and elderly patients. One of the pathologies of the disease is an innate inflammatory response to infection in the lung, which could explain possible links between HRSV and asthma (31, 40). The pathogenesis of HRSV is not well understood, and to date, the development of a vaccine has been unsuccessful (11). Understanding the interaction between HRSV proteins and host cell proteins may aid in the design of effective antiviral therapy and the development of possible vaccine strategies (10).
The genome of HRSV encodes 11 proteins. Many of these have more than one function as part of the virus life cycle, and some directly interact with host cell signaling cascades, which may account for the changes in the host cell proteome induced by virus infection (8, 35, 36, 50). Two virus-encoded proteins that have an obvious function in this regard are the NS1 and NS2 proteins, as has been comprehensively demonstrated in a recent proteomic comparison of cells infected with wild-type and recombinant viruses deficient in the expression of NS1/NS2 (24). Extensive studies have shown that both NS1 and NS2 play a role in modulating the host response to infection, acting as antagonists of the alpha/beta interferon (IFN-α/β)-mediated antiviral state (5, 6, 24, 38, 42, 46), and suppress maturation of dendritic cells and the T lymphocyte response (38, 39).
The genes encoding these proteins are located at the 3′ end of the genome and given their positions would be predicted to generate the most abundant proteins in HRSV-infected cells. In fact, NS1 has been shown to be the most abundantly produced protein of those viral proteins detected in a quantitative liquid chromatography-tandem mass spectrometry (LC-MS/MS) analysis of A549 cells infected with either HRSV subgroup A or HRSV subgroup B isolates (35, 36), whereas NS2 was not detected. The stability of NS1 and NS2 may also be linked to viral pathogenesis (44), with NS2 being reported to be more rapidly degraded than NS1 (17, 21).
NS1 can inhibit the phosphorylation of IRF-3 and disrupt its binding to interferon gene promoter or decrease STAT2 through proteasomal degradation (17, 41, 46), whereas NS2 causes the degradation of STAT2 but can also interact with RIG-I to suppress the synthesis of interferon (30, 45). In addition, NS2 has been reported to activate NF-κB (43). Both NS1 and NS2 also play an essential role in suppressing apoptosis and facilitating virus growth through the inhibition of interferon responses through a phosphatidylinositol 3-kinase (PI3K)-AKT- and NF-κB-dependent pathway to activate antiapoptotic genes (3). NS1 has been proposed to be a target for therapeutic strategies against HRSV. For example, treatment of HRSV-infected mice with small interfering NS1 (siNS1) nanoparticles showed a decrease in viral titers in the lung compared to those in the lungs of controls (58). Likewise, recombinant HRSV that did not express the NS1 was shown to be highly attenuated and immunogenic in chimpanzees (47).
Three cellular proteins, including cullin-2, elongin C (17), and microtubule-associated protein 1B (MAP1B) (45), have been identified to directly interact with NS1, and two proteins, including RIG-I (30) and MAP1B (45), have been identified to directly bind to NS2. NS1 has also been reported to interact with other HRSV proteins, including NS2 (45), matrix protein (21), and phosphoprotein (25). To determine whether other cellular proteins or complexes could interact with NS1 to predict function, a high-affinity purification approach coupled to a mass spectrometry-based approach was used. This utilized green fluorescent protein (GFP) trapping and stable isotope labeling with amino acids in cell culture (SILAC). SILAC is used to differentially label proteins under different experimental conditions, e.g., with the isotopes 12C and 14N, in which the amino acids arginine and lysine are replaced with the heavy isotope 13C and/or 15N. Heavy isotope substitution is made on these basic amino acids because they are the sites of trypsin cleavage, thereby generating a set of tryptic peptides, each with increased mass, that is identified, detected, and quantified by mass spectrometry. This approach has been used to study the interaction of viruses with the host cell proteome, including human respiratory syncytial virus (35, 36), coronaviruses (18, 19, 53, 57), influenza virus (13, 16, 20), and adenovirus (28), and also between viral proteins (porcine reproductive and respiratory syndrome nucleocapsid protein) and the host cell proteome (26). SILAC can therefore be used in pull-downs to help distinguish background and allow less stringent conditions to be used during the pull-down, potentially enabling the identification of low-affinity interactions (7, 48, 49).
The data indicated that multiple cellular proteins interacted with NS1. This included components of the mediator complex, which functions as a transcriptional coactivator and underpins the potential role of NS1 in transcriptional regulation of cellular mRNAs (41). Several mitochondrial proteins were associated with NS1, which correlates with the presence of NS1 in mitochondria (45). NS1 also interacted with components involved in cell cycle regulation and DNA damage repair. In the context of recombinant HRSV defective in the expression of NS1 and overexpression analysis, this protein was shown to be necessary and sufficient in promoting a G1-phase arrest in the cell cycle. This is in agreement with a number of studies reporting a G1-phase arrest in HRSV-infected A549 cells (22, 56).
MATERIALS AND METHODS
EGFP-NS1 and EGFP-NS2 expression.
HRSV NS1 and NS2 cDNA sequences were cloned into the pEGFP-C2 vector (Clontech) downstream of the enhanced GFP (EGFP)-coding sequence, to allow mammalian cell expression of either NS1 or NS2 fused to the C terminus of EGFP. The plasmid sequences were confirmed by sequence analysis. Expression of both fusion proteins was confirmed by live cell immunofluorescence and Western blot analysis of transfected 293T cells using an anti-GFP antibody (sc8334; Santa Cruz Biotechnology), as described below.
Cell culture and transfections.
293T cells were grown in stable isotope-labeled Dulbecco's modified Eagle's medium (DMEM; Dundee Cell Products) supplemented with 10% dialyzed fetal bovine serum (Dundee Cell Products) and 1% penicillin-streptomycin and incubated at 37°C in the presence of 5% CO2. Cells were grown in DMEM growth medium containing light (R0K0), medium (R6K4), or heavy (R10K8) arginine and lysine isotopes for a period of 2 weeks (>5 cell divisions) prior to transfection. For light, medium, and heavy labeled cells, four 10-cm2 dishes were seeded with 1.25 × 10⁶ cells each 24 h prior to calcium phosphate transfection of the dishes with 10 μg plasmid DNA coding for EGFP, EGFP-NS1, and EGFP-NS2, respectively. At 24 h posttransfection, cells were harvested and lysed, and EGFP (light label), EGFP-NS1 (medium label), and EGFP-NS2 (heavy label) were immunoprecipitated using a GFP trap.
EGFP immunoprecipitations.
EGFP, EGFP-NS1, and EGFP-NS2 immunoprecipitations were performed using a GFP trap (Chromotek), which consists of a single-domain anti-GFP antibody conjugated to an agarose bead matrix. Cell pellets were incubated for 30 min with 200 μl lysis buffer: 10 mM Tris-HCl, pH 7.5, 150 mM NaCl, 0.5 mM EDTA, 0.5% NP-40, 1× EDTA-free protease inhibitor (Roche). The lysate was cleared by centrifugation and diluted 5-fold with dilution buffer comprising 10 mM Tris-HCl, pH 7.5, 150 mM NaCl, 0.5 mM EDTA, and 1× EDTA-free protease inhibitor (Roche). The GFP-trap beads were equilibrated with ice-cold dilution buffer and then incubated with diluted cell lysate for 2 h at 4°C on a rotary mixer, followed by centrifugation at 2,700 × g for 2 min. The bead pellet was washed once with dilution buffer, followed by a single wash stage in buffer comprising 10 mM Tris HCl, pH 7.5, 250 mM NaCl, 0.5 mM EDTA, and 1× EDTA-free protease inhibitor (Roche). After centrifugation of the GFP-trap beads at 2,700 × g and removal of the wash buffer, the beads were resuspended in 2× SDS-sample buffer and boiled for 10 min to elute bound proteins. Immunoprecipitated samples were combined and analyzed by LC-MS/MS.
LC-MS/MS.
Immunoprecipitated samples were separated by running ∼3 cm into a 10% SDS-polyacrylamide gel. The gel lane was cut into 3 slices, and each slice was subjected to in-gel tryptic digestion using a ProGest automated digestion unit (Digilab, United Kingdom). The resulting peptides were fractionated using a Dionex Ultimate 3000 nano-high-pressure liquid chromatography system in line with an LTQ-Orbitrap Velos mass spectrometer (Thermo Scientific). In brief, peptides in 1% (vol/vol) formic acid were injected onto an Acclaim PepMap C18 nanotrap column (Dionex). After washing with 0.5% (vol/vol) acetonitrile and 0.1% (vol/vol) formic acid, peptides were resolved on an Acclaim PepMap C18 reverse-phase analytical column (250 mm by 75 μm; Dionex) over a 150-min organic gradient, using 7 gradient segments (1 to 6% solvent B over 1 min, 6 to 15% B over 58 min, 15 to 32% B over 58 min, 32 to 40% B over 3 min, 40 to 90% B over 1 min, held at 90% B for 6 min, and then reduced to 1% B over 1 min) with a flow rate of 300 nl min−1. Solvent A was 0.1% formic acid, and solvent B was aqueous 80% acetonitrile in 0.1% formic acid. Eluting peptides were ionized by nano-electrospray ionization at 2.3 kV using a stainless steel emitter with an internal diameter of 30 μm (Proxeon) and a capillary temperature of 250°C. Tandem mass spectra were acquired using an LTQ-Orbitrap Velos mass spectrometer controlled by Xcalibur (version 2.0) software (Thermo Scientific) and operated in the data-dependent acquisition mode. The Orbitrap mass spectrometer was set to analyze the survey scans at 60,000 resolution (at m/z 400) in the mass range m/z 300 to 2,000, and the top six multiply charged ions in each duty cycle were selected for MS/MS in the LTQ linear ion trap. Charge state filtering, where unassigned precursor ions were not selected for fragmentation, and dynamic exclusion (repeat count, 1; repeat duration, 30 s; exclusion list size, 500) were used. Fragmentation conditions in the LTQ linear ion trap were as follows: normalized collision energy, 35%; activation q, 0.25; activation time, 30 ms; and minimum ion selection intensity, 500 counts.
The raw data files were processed and quantified using Proteome Discoverer software (version 1.2; Thermo Scientific) and searched against the UniProt/Swiss-Prot Human database, release version 57.3 (20,326 entries), using the SEQUEST (version 28, revision 13) algorithm. Peptide precursor mass tolerance was set at 10 ppm, and MS/MS tolerance was set at 0.8 Da. Search criteria included carbamidomethylation of cysteine (+57.0214) as a fixed modification and oxidation of methionine (+15.9949) and appropriate SILAC labels as variable modifications. Searches were performed with full tryptic digestion, and a maximum of 1 missed cleavage was allowed. The reverse database search option was enabled, and all peptide data were filtered to satisfy a false discovery rate (FDR) of 5%. The Proteome Discoverer software generates a reverse decoy database from the selected protein database, and any peptides that were derived from this decoy database passing the initial filtering parameters are defined as false-positive identifications. The minimum cross-correlation factor (Xcorr) filter was readjusted for each individual charge state separately to optimally meet the predetermined target FDR of 5% based on the number of random false-positive matches from the reverse decoy database. Thus, each data set has its own passing parameters. Quantification was done using a mass precision of 2 ppm. After extracting each ion chromatogram, the Proteome Discoverer software runs several filters to check for, among other things, interfering peaks and the presence of the expected isotope pattern. Peptides which did not pass these filters were not used in calculating the final ratio for each protein. Quantification values (e.g., the ratio of a cellular protein identified as binding to EGFP, EGFP-NS1, and EGFP-NS2) outside the range from 0.01 to 100 were recorded as 0.01 (if below this ratio) and 100 (if above this ratio).
Data deposition.
LC-MS/MS data from this project were deposited in the Proteomics IDEntifications database (PRIDE) using the PRIDE converter tool, and also, the data on EGFP-NS1 were deposited into the IntAct database and through this deposited into the IMEx data resource and assigned the identifier IM-15828.
Bioinformatic analysis.
Ingenuity Pathway Analysis (IPA) software (Ingenuity Systems) was used to analyze the cellular protein data sets and to group proteins into similar functional classes. Networks were generated using data sets containing gene identifiers and corresponding expression values, which were uploaded into the application. Each gene identifier was mapped to its corresponding gene object in the Ingenuity Pathways Knowledge Base (IPKB). An enrichment ratio was set to identify the genes of proteins that associated with EGFP-NS1 compared to those that associated with EGFP. These genes, called focus genes, were overlaid onto a global molecular network developed from information contained in the IPKB. Networks of these focus genes were then algorithmically generated on the basis of their connectivity. Graphical representations of the molecular relationships between genes/gene products were generated. Genes or gene products are represented as nodes, and the biological relationship between two nodes is represented as an edge (line). All edges are supported by at least one reference from the literature or from canonical information stored in the IPKB. Human, mouse, and rat orthologs of a gene are stored as separate objects in the IPKB but are represented as a single node in the network. The intensity of the node color indicates the relative association with EGFP-NS1.
Cell cycle analysis.
Subconfluent monolayers of A549 cells were mock infected or infected with wild-type recombinant RSV A2 (rA2) or recombinant RSV with an NS deletion (ΔNS1, ΔNS2, or ΔNS1/2) at a multiplicity of infection of 3. At 24 h postinfection, cells were harvested, washed twice with phosphate-buffered saline (PBS), and fixed in 80% ethanol on ice for 30 min. Cells were stained with DAPI (4′,6-diamidino-2-phenylindole) to allow the quantitative assessment of DNA content (1 μg/ml) in PBS–0.1% Triton X-100 for 30 min and then examined using a Becton Dickinson LSR II flow cytometer. Cell cycle analysis was performed using ModFit (version 3.2.1) software.
RESULTS
Identification of potential interacting partners of HRSV NS1.
To obtain a more complete picture of the potential interacting partners of NS1, we used quantitative proteomics coupled to an immunoprecipitation strategy based on expression of NS1 as an EGFP fusion in human 293T cells and utilizing a GFP trap to selectively precipitate the EGFP-NS1 fusion protein and interacting partners. 293T cells were chosen for a number of reasons. These included their high transfection efficiencies using calcium phosphate, the well-annotated human databases that aid with protein identification and function assignment, and use of this cell type and tagged proteins in similar studies to investigate the interaction between HRSV NS1 and NS2 and host cell proteins (17). In order to identify potential cellular interacting partners specific for NS1, a SILAC labeling approach was used in cells expressing either EGFP-NS1 or, as binding controls, EGFP or EGFP-NS2. Subsequent comparison of the immunoprecipitated interacting partners from these three transfected cell cultures allowed the identification of cellular components that specifically bound to the NS1 moiety within the EGFP-NS1 fusion protein (Fig. 1A).
Fig 1.

GFP trap-mediated immunoprecipitation of a fused EGFP-NS1 in combination with SILAC and LC-MS/MS to distinguish specific and nonspecific cellular interacting partners of the HRSV NS1. (A) Schematic representation of the SILAC and LC-MS/MS methodology used in this study. 293T cells were grown in either light (R0K0), medium (R6K4), or heavy (R10K8) SILAC medium, such that each cellular protein incorporated isotopically distinguishable arginine and lysine prior to cellular transfection with EGFP, EGFP-NS1, and EGFP-NS2, respectively. At 24 h after transfection, cells were lysed and EGFP, EGFP-NS1, and EGFP-NS2 and their interacting partners were immunoprecipitated using a GFP trap. Equal volumes of immunoprecipitates were combined, and coimmunoprecipitated proteins were identified and quantified using LC-MS/MS and Proteome Discoverer software. (B) Cells were transfected with plasmids expressing EGFP, EGFP-NS1, or EGFP-NS2, and their expression was confirmed using confocal microscopy. In each image, the nucleus was stained blue using DAPI, 7and EGFP-labeled proteins were detected as green. (C) Following immunoprecipitation using the GFP trap, immunoprecipitates from EGFP-, EGFP-NS1-, and EGFP-NS2-expressing cells were resolved through SDS-PAGE on 12% gels and Coomassie stained to confirm the immunoprecipitation of sufficient quantities of protein (left); and following transfer to polyvinylidene difluoride membranes, they were probed with an anti-GFP antibody to confirm expression of EGFP, EGFP-NS1, or EGFP-NS2 of the correct molecular mass prior to analysis by LC-MS/MS.
The NS1- and NS2-encoding cDNAs were amplified by PCR and inserted into an expression plasmid downstream of the EGFP-coding sequence such that, when expressed, the NS1 or NS2 open reading frame was fused to the C terminus of EGFP. Expression of EGFP, EGFP-NS1, and EGFP-NS2 in 293T cells was confirmed by indirect immunofluorescence confocal microscopy (Fig. 1B). This analysis showed that EGFP, EGFP-NS1, and EGFP-NS2 localized to both the cytoplasm and the nucleus. For EGFP-NS1, this finding was similar to that reported for native NS1 in a quantitative proteomic analysis of nuclear and cytoplasmic extracts purified from HRSV-infected cells (35, 36). Separation and analysis of the pull-down products by one-dimensional (1D) SDS-PAGE revealed EGFP, EGFP-NS1, or EGFP-NS2 with the expected molecular mass, confirming the expression of these proteins in 293T cells (Fig. 1C).
The cellular binding partners of EGFP, EGFP-NS1, and EGFP-NS2 were immunoprecipitated from cells expressing the respective proteins and were identified using LC-MS/MS analysis. The total numbers of proteins identified and quantified in raw data format are individually listed in Table S1 in the supplemental material. Note that this study specifically focused on NS1, but for interest, the binding data for EGFP-NS2 are also listed in Table S1 in the supplemental material. The raw data for the entire study (including peptide identification and corresponding mass spectra) were uploaded onto the PRIDE repository (52) using the PRIDE convertor tool (2). However, because the EGFP-NS1 data sets were validated using independent approaches, described below, only this database was deposited with the protein interactome repository IntAct (27) and IMEx ID IM-15828.
For any potential protein interacting partner, the ratio of its abundance coimmunoprecipitated with EGFP-NS1 compared to that coimmunoprecipitated with EGFP can be used as a guide to the specificity of its interaction. Examination of this ratio for EGFP-NS1 (Fig. 2) indicated that the modal ratio was approximately 2-fold for EGFP-NS1 (excluding ratio hits set at 100). Work by ourselves and others has suggested that this modal value can represent a threshold for nonspecific interactions that arise due to binding to either the agarose bead matrix or the single-chain GFP-antibody component of the GFP trap (26, 49). Also, unless a cellular protein was bound to both EGFP-NS1 and EGFP-NS2 but not EGFP, then the EGFP-NS2 also acted as an additional control.
Fig 2.
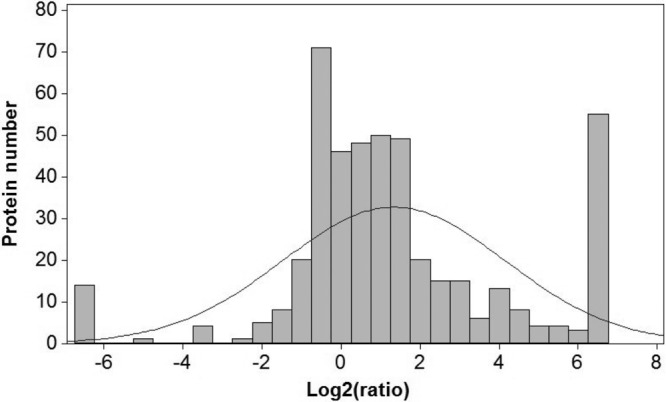
Protein ratio frequency graph illustrating the numbers of cellular proteins with each SILAC ratio (EGFP-NS1/EGFP) in GFP-trap immunoprecipitates. In immunoprecipitation experiments of this type, many of the proteins identified in the immunoprecipitate likely represent experimental contaminants, and an increased abundance ratio indicates an increased likelihood of involvement in a specific interaction. In this study, the majority of the proteins were described by a normal distribution centered around a ratio of 1 log2 unit (2-fold).
Cellular interacting proteins exhibiting ratios of a value of 2-fold or greater were therefore considered to potentially represent specific interacting partners of EGFP-NS1 compared to EGFP (and, additionally, compared to EGFP-NS2), and this value was used to select proteins for bioinformatic analysis and further validation of nonspecific and specific interactions using nonlabeled biological replicates (these 221 proteins are listed in Table 1).
Table 1.
Proteins with medium labeling from the EGFP-NS1 protein immunoprecipitated sample identified by LC-MS/MS showing a ratio of relative expression level more than 1 log2-fold compared to identical proteins with light labeling from the EGFP immunoprecipitated samplea
| Protein identifier | Protein name | Ratio | Peptides | SC (%) | Variability (%) | Abundance (ppm) |
|---|---|---|---|---|---|---|
| Q9NVJ2 | ARL8B | 100.00 | 3 | 18.3 | 31.0 (top 25) | |
| Q9Y679 | AUP1 | 100.00 | 2 | 6.9 | 0.0 | 2.67 |
| Q9P0K7 | RAI14 | 100.00 | 8 | 9.9 | 0.0 | 1.94 |
| Q96TA2 | YMEL1 | 100.00 | 6 | 10.2 | 0.0 | 4.72 |
| Q9Y6D6 | BIG1 | 100.00 | 17 | 10.6 | 0.0 | 0.94 |
| Q9Y6D5 | BIG2 | 100.00 | 14 | 10.1 | 0.0 | 0.68 |
| Q9BWU1 | CD2L6 | 100.00 | 3 | 8.4 | 0.23 (btm 25) | |
| Q05048 | CSTF1 | 100.00 | 2 | 7.9 | 0.0 | 18.3 (top 25) |
| P24863 | CCNC | 100.00 | 2 | 9.9 | 0.49 | |
| Q14204 | DYHC1 | 100.00 | 69 | 15.2 | 0.0 | 24.9 (top 25) |
| Q13409 | DC1I2 | 100.00 | 5 | 9.9 | 0.0 | 30.8 (top 25) |
| Q9Y6G9 | DC1L1 | 100.00 | 7 | 18.9 | 0.0 | 27.5 (top 25) |
| O43237 | DC1L2 | 100.00 | 5 | 15.0 | 18.2 (top 25) | |
| Q6IAN0 | DRS7B | 100.00 | 5 | 16.6 | 3.03 | |
| P24928 | RPB1 | 100.00 | 7 | 4.6 | 0.0 | 3.51 |
| Q9NXW2 | DJB12 | 100.00 | 6 | 22.1 | 0.36 | |
| Q9HAV4 | XPO5 | 100.00 | 2 | 2.2 | 11.2 (top 25) | |
| P51648 | AL3A2 | 100.00 | 12 | 29.5 | 0.0 | 22.8 (top 25) |
| Q9Y2I7 | FYV1 | 100.00 | 8 | 5.3 | 0.0 | 0.14 (btm 25) |
| Q8N9F7 | GDPD1 | 100.00 | 3 | 14.7 | 0.15 (btm 25) | |
| Q9H583 | HEAT1 | 100.00 | 13 | 7.0 | 0.0 | 0.58 |
| O15397 | IPO8 | 100.00 | 2 | 2.4 | 0.94 | |
| Q9Y2U9 | KLDC2 | 100.00 | 2 | 5.2 | NA | |
| P27544 | LASS1 | 100.00 | 3 | 10.0 | NA | |
| Q16850 | CP51A | 100.00 | 3 | 7.8 | 0.0 | 3.90 |
| Q8WVP7 | LMBR1 | 100.00 | 3 | 4.7 | 0.0 | NA |
| P33121 | ACSL1 | 100.00 | 15 | 23.5 | 0.0 | 25.3 (top 25) |
| O95573 | ACSL3 | 100.00 | 17 | 24.7 | 0.0 | 21.2 (top 25) |
| Q93074 | MED12 | 100.00 | 17 | 9.8 | 0.0 | 0.42 |
| Q71F56 | MD13L | 100.00 | 4 | 2.1 | 0.0 | 0.02 (btm 5) |
| O60244 | MED14 | 100.00 | 9 | 7.2 | 0.0 | 0.97 |
| Q9Y2X0 | MED16 | 100.00 | 7 | 8.7 | 0.0 | 0.04 (btm 5) |
| Q9NVC6 | MED17 | 100.00 | 10 | 16.3 | 0.0 | 1.17 |
| Q9H944 | MED20 | 100.00 | 5 | 26.9 | 0.0 | 5.44 |
| Q9ULK4 | MED23 | 100.00 | 9 | 7.9 | 0.56 | |
| O75448 | MED24 | 100.00 | 10 | 11.6 | 0.0 | 0.31 |
| Q6P2C8 | MED27 | 100.00 | 10 | 41.8 | 1.17 | |
| Q9NX70 | MED29 | 100.00 | 3 | 23.5 | 5.66 | |
| Q96G25 | MED8 | 100.00 | 6 | 31.3 | 3.83 | |
| Q9NWA0 | MED9 | 100.00 | 3 | 28.1 | 4.60 | |
| Q86UT6 | NLRX1 | 100.00 | 7 | 7.9 | 0.09 (btm 25) | |
| Q9BZF1 | OSBL8 | 100.00 | 2 | 3.3 | 1.97 | |
| P50897 | PPT1 | 100.00 | 2 | 10.8 | 54.1 (top 25) | |
| Q9H7Z7 | PGES2 | 100.00 | 5 | 20.7 | 0.0 | 4.58 |
| Q86YD1 | PTOV1 | 100.00 | 6 | 20.2 | NA | |
| Q8TCG1 | CIP2A | 100.00 | 26 | 27.5 | 0.0 | 0.40 |
| Q08AM6 | VAC14 | 100.00 | 6 | 7.4 | 0.0 | 0.66 |
| Q13535 | ATR | 100.00 | 4 | 1.8 | 0.0 | 1.10 |
| Q9NX61 | T161A | 100.00 | 2 | 4.4 | NA | |
| O43156 | K0406 | 100.00 | 2 | 2.5 | 0.0 | 0.62 |
| Q9NPJ6 | MED4 | 96.91 | 9 | 41.9 | 4.6 | 1.64 |
| P00387 | NB5R3 | 96.37 | 2 | 10.3 | 5.5 | 112 (top 10) |
| Q96RN5 | MED15 | 92.52 | 8 | 9.3 | 11.6 | 2.88 |
| O15270 | SPTC2 | 86.19 | 3 | 6.2 | 22.3 | 3.24 |
| Q8NBX0 | SCPDH | 81.62 | 7 | 16.8 | 30.8 | 8.96 (top 25) |
| P53618 | COPB | 68.14 | 3 | 3.5 | 28.6 | 33.4 (top 25) |
| Q9NU22 | MDN1 | 61.05 | 2 | 0.4 | 1.81 | |
| P61619 | S61A1 | 57.64 | 9 | 18.3 | 97.4 | 21.5 (top 25) |
| Q9UHV7 | MED13 | 46.44 | 8 | 4.4 | 0.20 (btm 25) | |
| Q71SY5 | MED25 | 43.02 | 7 | 11.7 | 0.85 | |
| O95402 | MED26 | 38.61 | 6 | 15.0 | 1.97 | |
| Q5T9A4 | ATD3B | 38.34 | 6 | 10.3 | 255.7 | 6.97 |
| Q9NVI7 | ATD3A | 34.71 | 5 | 8.7 | 327.3 | 25.9 (top 25) |
| Q8NBN7 | RDH13 | 32.24 | 3 | 12.1 | 396.5 | 11.1 (top 25) |
| P00367 | DHE3 | 29.19 | 9 | 22.6 | 520.0 | 122 (top 10) |
| Q8NF37 | PCAT1 | 26.92 | 2 | 4.1 | 655.9 | 9.41 (top 25) |
| Q8WVX9 | FACR1 | 25.26 | 8 | 20.8 | 61.2 | 0.72 |
| P37268 | FDFT | 24.55 | 11 | 31.4 | 179.5 | 8.18 (top 25) |
| P62988 | UBIQ | 24.24 | 7 | 77.6 | 216.2 | 827 (top 5) |
| Q7Z3U7 | MON2 | 22.04 | 3 | 1.8 | 750.0 | 0.48 |
| P30508 | 1C12 | 21.11 | 4 | 16.9 | 1,425.4 | 3.41 |
| Q15645 | TRP13 | 20.30 | 5 | 12.0 | 575.4 | 3.23 |
| Q86UE4 | LYRIC | 19.97 | 3 | 6.5 | 1,729.9 | 6.96 |
| Q14444 | CAPR1 | 19.78 | 2 | 3.1 | 1,789.1 | 70.0 (top 10) |
| Q9P2R7 | SUCB1 | 18.92 | 3 | 6.7 | 2,103.5 | 13.0 (top 25) |
| P54727 | RD23B | 18.56 | 3 | 13.0 | 135 (top 10) | |
| P20338 | RAB4A | 17.41 | 4 | 23.5 | 2,875.1 | 2.07 |
| O60488 | ACSL4 | 17.32 | 5 | 8.6 | 944.5 | 7.70 |
| Q86UL3 | GPAT4 | 17.29 | 2 | 5.9 | 48.2 | NA |
| Q9P035 | PTAD1 | 16.51 | 2 | 6.6 | 3,537.2 | 36.9 (top 25) |
| O75306 | NDUS2 | 16.16 | 2 | 5.0 | 3,845.8 | 22.5 (top 25) |
| P13861 | KAP2 | 15.77 | 2 | 6.2 | 4,244.2 | 16.3 (top 25) |
| Q00325 | MPCP | 15.52 | 3 | 12.2 | 1,279.9 | 79.0 (top 10) |
| Q96R06 | SPAG5 | 15.39 | 2 | 2.4 | 2,004.9 | 4.23 |
| P30876 | RPB2 | 15.12 | 5 | 5.6 | 22.7 | 7.22 |
| Q8TCT9 | HM13 | 14.28 | 2 | 9.6 | 6,421.4 | 5.79 |
| Q15386 | UBE3C | 13.88 | 2 | 2.0 | 1.14 | |
| P62333 | PRS10 | 12.95 | 2 | 5.7 | 9,886.8 | 63.3 (top 10) |
| Q13724 | MOGS | 12.79 | 3 | 4.1 | 39.2 | 30.8 (top 25) |
| Q01650 | LAT1 | 12.21 | 3 | 9.5 | 12.4 | 0.64 |
| O14545 | TRAD1 | 12.04 | 2 | 3.8 | 39.6 | 5.47 |
| Q92544 | TM9S4 | 10.67 | 2 | 3.6 | 7,266.0 | 31.0 (top 25) |
| Q7Z6Z7 | HUWE1 | 10.00 | 13 | 3.9 | 69.4 | 7.41 |
| P08195 | 4F2 | 9.33 | 11 | 23.8 | 26.0 | 52.9 (top 25) |
| Q9BTW9 | TBCD | 9.20 | 3 | 3.0 | 107.2 | 8.70 (top 25) |
| O43819 | SCO2 | 8.18 | 2 | 10.5 | 0.54 | |
| Q92621 | NU205 | 8.17 | 6 | 3.6 | 3.1 | 5.23 |
| Q9Y4W6 | AFG32 | 7.92 | 4 | 4.4 | 12.3 | 12.4 (top 25) |
| P31946 | 1433B | 7.90 | 6 | 28.1 | 38.2 | 361 (top 5) |
| P27348 | 1433T | 7.69 | 9 | 35.5 | 11.9 | 379 (top 5) |
| Q9Y5M8 | SRPRB | 7.55 | 10 | 47.2 | 44.4 | 16.3 (top 25) |
| P63104 | 1433Z | 7.34 | 8 | 36.3 | 10.7 | 997 (top 5) |
| O15269 | SPTC1 | 7.29 | 5 | 15.0 | 46.2 | 8.23 (top 25) |
| Q96S55 | WRIP1 | 7.27 | 5 | 9.6 | 39.2 | 2.22 |
| P61981 | 1433G | 7.24 | 6 | 24.7 | 39.7 | 372 (top 5) |
| O15228 | GNPAT | 7.20 | 2 | 2.8 | 1.02 | |
| P62258 | 1433E | 6.96 | 8 | 34.1 | 20.4 | 1,662 (top 5) |
| Q8TEM1 | PO210 | 6.89 | 3 | 1.9 | 44.1 | 6.00 |
| Q5JTV8 | TOIP1 | 6.53 | 6 | 13.9 | 33.0 | 14.6 (top 25) |
| Q3ZCQ8 | TIM50 | 6.40 | 4 | 15.6 | 47.1 | 39.4 (top 25) |
| A0FGR8 | ESYT2 | 6.13 | 5 | 6.4 | 152.7 | 6.02 |
| Q9BXW9 | FACD2 | 6.02 | 3 | 2.5 | 0.42 | |
| P50402 | EMD | 5.86 | 2 | 10.6 | 41.9 (top 25) | |
| P78527 | PRKDC | 5.85 | 25 | 7.2 | 29.5 | 65.6 (top 10) |
| P35606 | COPB2 | 5.52 | 6 | 7.4 | 20.4 | 40.4 (top 25) |
| Q9ULX6 | AKP8L | 5.44 | 2 | 3.6 | 34.6 | 1.74 |
| Q9Y394 | DHRS7 | 5.11 | 3 | 13.0 | 5.2 | 14.8 (top 25) |
| Q9HDC9 | APMAP | 4.99 | 4 | 11.3 | 22.0 | 34.8 (top 25) |
| O00743 | PPP6 | 4.96 | 2 | 8.9 | 15.9 | 5.81 |
| Q96CS3 | FAF2 | 4.89 | 5 | 16.2 | 41.7 | 20.3 (top 25) |
| O00165 | HAX1 | 4.89 | 2 | 12.9 | 10.4 | 3.45 |
| O43505 | B3GN1 | 4.88 | 2 | 5.8 | 82.1 | 0.15 (btm 25) |
| P31689 | DNJA1 | 4.77 | 8 | 26.7 | 14.8 | 60.5 (top 10) |
| Q9UHI6 | DDX20 | 4.74 | 2 | 2.7 | 48.8 | 1.79 |
| Q99536 | VAT1 | 4.58 | 5 | 17.3 | 1,966.4 | 67.7 (top 10) |
| Q92616 | GCN1L | 4.56 | 26 | 10.2 | 17.4 | 22.7 (top 25) |
| P16615 | AT2A2 | 4.38 | 13 | 14.5 | 14.9 | 37.8 (top 25) |
| O75396 | SC22B | 4.33 | 3 | 16.7 | 3.1 | 43.8 (top 25) |
| O95202 | LETM1 | 4.21 | 5 | 6.4 | 7.0 | 15.9 (top 25) |
| Q9H078 | CLPB | 4.04 | 2 | 3.7 | 4.02 | |
| Q9NTJ5 | SAC1 | 4.02 | 5 | 8.7 | 14.2 | 9.48 (top 25) |
| P36542 | ATPG | 3.96 | 6 | 20.8 | 6.9 | 125 (top 10) |
| Q9BQE3 | TBA1C | 3.92 | 16 | 41.9 | 28.8 | 627 (top 5) |
| O60884 | DNJA2 | 3.84 | 2 | 5.6 | 26.6 | 26.7 (top 25) |
| Q13505 | MTX1 | 3.82 | 3 | 8.6 | 9.0 | 12.9 (top 25) |
| Q8TC12 | RDH11 | 3.78 | 8 | 33.7 | 16.6 | 35.0 (top 25) |
| P53621 | COPA | 3.75 | 8 | 7.8 | 50.5 | 58.0 (top 10) |
| Q08379 | GOGA2 | 3.73 | 2 | 2.3 | 26.2 | 1.73 |
| P61019 | RAB2A | 3.69 | 3 | 20.3 | 17.5 | 23.4 (top 25) |
| Q9H3U1 | UN45A | 3.62 | 2 | 2.2 | 11.6 | 27.2 (top 25) |
| P27708 | PYR1 | 3.55 | 11 | 5.6 | 17.5 | 14.8 (top 25) |
| Q9BPW8 | NIPS1 | 3.47 | 3 | 15.1 | 11.2 | 14.4 (top 25) |
| P07099 | HYEP | 3.45 | 5 | 13.4 | 37.4 | 41.0 (top 25) |
| P25705 | ATPA | 3.36 | 14 | 27.9 | 24.1 | 566 (top 5) |
| Q9NQC3 | RTN4 | 3.35 | 2 | 2.4 | 27.3 | 54.3 (top 25) |
| Q53GQ0 | DHB12 | 3.34 | 4 | 18.9 | 3.1 | 24.2 (top 25) |
| O15173 | PGRC2 | 3.31 | 4 | 18.8 | 40.3 | 76.9 (top 10) |
| Q8WVM8 | SCFD1 | 3.31 | 2 | 3.6 | 5.94 | |
| P51149 | RAB7A | 3.30 | 3 | 17.9 | 37.7 | 85.7 (top 10) |
| P62491 | RB11A | 3.19 | 4 | 20.4 | 12.4 | 40.4 (top 25) |
| O95831 | AIFM1 | 3.14 | 8 | 15.0 | 12.7 | 22.8 (top 25) |
| P05023 | AT1A1 | 3.13 | 15 | 15.5 | 9.4 | 71.9 (top 10) |
| Q9Y2X3 | NOP58 | 3.13 | 3 | 6.6 | 40.2 (top 25) | |
| O60762 | DPM1 | 3.12 | 4 | 15.4 | 28.0 | 6.78 |
| P49411 | EFTU | 3.11 | 13 | 35.2 | 14.3 | 165 (top 5) |
| Q96S66 | CLCC1 | 3.10 | 2 | 7.6 | 0.65 | |
| Q96C36 | P5CR2 | 3.10 | 3 | 13.1 | 4.7 | 33.9 (top 25) |
| Q12907 | LMAN2 | 3.09 | 4 | 10.7 | 20.6 | 51.7 (top 25) |
| Q8N1F7 | NUP93 | 3.07 | 3 | 4.0 | 2.3 | 4.77 |
| Q9BSJ8 | ESYT1 | 3.04 | 3 | 3.2 | 5.6 | 18.9 (top 25) |
| P20340 | RAB6A | 3.03 | 4 | 20.7 | 26.7 | 2.92 |
| P61106 | RAB14 | 3.03 | 7 | 44.7 | 20.2 | 78.5 (top 10) |
| Q13263 | TIF1B | 2.98 | 4 | 7.1 | 26.0 | 211 (top 5) |
| O43175 | SERA | 2.95 | 10 | 21.6 | 18.0 | 185 (top 5) |
| O00116 | ADAS | 2.92 | 5 | 8.7 | 38.4 | 12.4 (top 25) |
| Q8TC07 | TBC15 | 2.91 | 2 | 3.9 | 63.2 | 1.69 |
| P10809 | CH60 | 2.88 | 21 | 39.8 | 17.4 | 1,644 (top 5) |
| Q9UBM7 | DHCR7 | 2.88 | 2 | 7.4 | 48.2 | 18.5 (top 25) |
| P24539 | AT5F1 | 2.87 | 4 | 15.6 | 1.7 | 69.3 (top 10) |
| O76094 | SRP72 | 2.85 | 2 | 4.2 | 4.9 | 18.3 (top 25) |
| P06576 | ATPB | 2.80 | 17 | 44.4 | 20.6 | 533 (top 5) |
| Q9UHB9 | SRP68 | 2.79 | 3 | 5.1 | 75.6 | 20.0 (top 25) |
| O00264 | PGRC1 | 2.78 | 6 | 34.4 | 45.5 | 62.8 (top 10) |
| Q96AG4 | LRC59 | 2.76 | 4 | 15.6 | 14.6 | 88.0 (top 10) |
| P42704 | LPPRC | 2.74 | 15 | 11.3 | 17.9 | 73.4 (top 10) |
| P50914 | RL14 | 2.71 | 3 | 15.4 | 15.1 | 205 (top 5) |
| Q9H3N1 | TXND1 | 2.66 | 6 | 24.6 | 13.6 | 31.9 (top 25) |
| P18031 | PTN1 | 2.65 | 3 | 8.1 | 13.4 | 24.6 (top 25) |
| Q15738 | NSDHL | 2.63 | 4 | 14.2 | 5.4 | 15.4 (top 25) |
| P48047 | ATPO | 2.63 | 5 | 31.5 | 18.2 | 180 (top 5) |
| P04843 | RPN1 | 2.56 | 9 | 17.1 | 8.9 | 116 (top 10) |
| P27824 | CALX | 2.55 | 8 | 14.5 | 15.9 | 314 (top 5) |
| Q8TCJ2 | STT3B | 2.53 | 2 | 2.5 | 12.7 | 7.41 |
| Q15155 | NOMO1 | 2.50 | 3 | 3.0 | 6.0 | 2.76 |
| P40939 | ECHA | 2.46 | 7 | 9.4 | 26.2 | 146 (top 10) |
| P68363 | TBA1B | 2.44 | 17 | 41.9 | 29.4 | 777 (top 5) |
| P51148 | RAB5C | 2.42 | 4 | 22.7 | 10.6 | 20.0 (top 25) |
| O94826 | TOM70 | 2.42 | 4 | 7.9 | 12.4 | 61.7 (top 10) |
| Q9UQE7 | SMC3 | 2.41 | 3 | 3.6 | 3.9 | 11.1 (top 25) |
| O76031 | CLPX | 2.40 | 4 | 7.4 | 7.6 | 1.78 |
| P21964 | COMT | 2.39 | 3 | 19.2 | 7.7 | 137 (top 10) |
| O96005 | CLPT1 | 2.39 | 2 | 3.6 | 10.7 | 9.64 (top 25) |
| Q969V3 | NCLN | 2.37 | 3 | 7.6 | 12.1 | 9.61 (top 25) |
| O75489 | NDUS3 | 2.35 | 3 | 15.5 | 16.8 | 36.4 (top 25) |
| P61006 | RAB8A | 2.32 | 6 | 24.6 | 41.9 | 32.5 (top 25) |
| Q16531 | DDB1 | 2.31 | 4 | 4.0 | 0.8 | 26.9 (top 25) |
| Q9BVK6 | TMED9 | 2.31 | 2 | 7.9 | 17.0 | 60.6 (top 10) |
| P46977 | STT3A | 2.30 | 3 | 4.5 | 6.7 | 2.13 |
| P08107 | HSP71 | 2.29 | 27 | 39.9 | 16.7 | 139 (top 10) |
| P11142 | HSP7C | 2.28 | 24 | 35.0 | 15.0 | 1,304 (top 5) |
| P23634 | AT2B4 | 2.27 | 2 | 2.3 | 15.2 | 14.2 (top 25) |
| P54709 | AT1B3 | 2.26 | 4 | 17.9 | 6.2 | 73.9 (top 10) |
| O95373 | IPO7 | 2.22 | 4 | 4.8 | 9.4 | 22.5 (top 25) |
| P68371 | TBB2C | 2.21 | 22 | 56.2 | 31.5 | 550 (top 5) |
| Q14683 | SMC1A | 2.20 | 7 | 5.3 | 8.6 | 16.9 (top 25) |
| P40938 | RFC3 | 2.19 | 2 | 7.9 | 9.0 | 11.2 (top 25) |
| P39656 | OST48 | 2.18 | 4 | 9.6 | 8.7 | 65.3 (top 10) |
| P51572 | BAP31 | 2.18 | 4 | 19.9 | 36.0 | 15.9 (top 25) |
| P05141 | ADT2 | 2.15 | 6 | 21.8 | 6.2 | 340 (top 5) |
| P61020 | RAB5B | 2.11 | 3 | 17.2 | 22.6 | 6.57 |
| Q12931 | TRAP1 | 2.10 | 5 | 9.2 | 17.7 | 41.7 (top 25) |
| P52292 | IMA2 | 2.10 | 5 | 14.6 | 51.2 | 133 (top 10) |
| P02786 | TFR1 | 2.09 | 5 | 8.4 | 11.9 | 55.4 (top 10) |
| O14980 | XPO1 | 2.06 | 3 | 3.2 | 9.3 | 35.3 (top 25) |
| Q9Y265 | RUVB1 | 2.05 | 7 | 27.4 | 18.0 | 64.7 (top 10) |
| Q92973 | TNPO1 | 2.04 | 2 | 2.6 | 10.3 | 28.1 (top 25) |
| P39023 | RL3 | 2.03 | 3 | 9.7 | 43.9 | 359 (top 5) |
| Q9ULT8 | HECD1 | 2.01 | 2 | 0.9 | 44.0 | 0.89 |
| Q96HS1 | PGAM5 | 2.01 | 2 | 4.8 | 15.7 (top 25) | |
| O14828 | SCAM3 | 2.01 | 3 | 16.7 | 5.8 | 11.9 (top 25) |
| P55072 | TERA | 2.01 | 13 | 23.8 | 22.9 | 444 (top 5) |
This table is derived from a more comprehensive presentation of the data sets (including the EGFP-NS protein immunoprecipitated sample) presented in Table S1 in the supplemental material, which includes heavy/light counts. Peptides, the number of peptides identified belonging to each protein; SC, the percentage of the protein sequence covered by the identified peptides; Variability, the variability from the median of the peptide ratios that were used to calculate a particular protein ratio; Abundance (ppm), the relative abundance of a protein in a human cell (if known), as listed in the PAXDb: Protein Abundance Across Organisms (version 2.0) database, with values in parentheses representing the rank (in percent). btm, bottom; NA, not applicable. The maximum fold change was set at 100, and proteins with a 100-fold ratio are highlighted in gray.
If the rank order of binding interactions of cellular proteins with EGFP-NS1 was made purely on the basis of the amount of protein inside a cell randomly binding to EGFP-NS1, then the most abundant cellular proteins would be predicted to be the most represented in terms of binding to EGFP-NS1. To assess this, the interactome data set was interrogated using PAXDb: Protein Abundance across Organisms (version 2.0), selected for Homo sapiens. (Note that our data sets are from 293T cells, which may display protein abundance different from that used for PAXDb.) In general, there was no correlation between protein abundance in the cell and increased binding efficiency to EGFP-NS1 (Table 1, right-hand-most column), indicating that binding was specific and not just related to the abundance of the cellular protein.
Bioinformatic analysis.
The SILAC LC-MS/MS data were further analyzed using Ingenuity Pathway Analysis software (Ingenuity Systems), which helped to build the relationships of identified proteins and provide an understanding of the potential functions of these proteins. These proteins were classified in terms of protein type (Table 2) or subcellular localization (Table 3). Most of the potential EGFP-NS1-interacting proteins were distinguished as belonging to enzyme, cellular transporter, and transcription regulators (∼30%, 16%, and 10% of total identified proteins, respectively). These proteins were further defined using the core analysis function of IPA software and categorized into 20 main functional groups (Fig. 3). Combined with the network analyses, which overlapped the identified interactomes with the pathways (Fig. 4), NS1 was highlighted as playing a potential role in modulating host cell transcription through interaction with the mediator complex and the RNA polymerase II (Pol II) holoenzyme (RPB1). NS1 was also shown to interact with ATR (ataxia telangiectasia- and Rad3-related protein), involved in activating the DNA damage checkpoint, thus leading to cell cycle arrest, and other proteins involved in cell cycle regulation.
Table 2.
Type of proteins identified in the EGFP-NS1 samples showing a 1-log2-fold or greater relative increase in abundance
| Protein typea | No. of proteins in EGFP-NS1 sample |
|---|---|
| Enzyme | 67 |
| Transporter | 35 |
| Transcription regulator | 21 |
| Peptidase | 8 |
| Kinase | 6 |
| Phosphatase | 4 |
| Transmembrane receptor | 3 |
| Translation regulator | 2 |
| Ion channel | 1 |
| Ligand-dependent nuclear receptor | 1 |
| Other | 73 |
The protein types were determined using Ingenuity Pathway Analysis software.
Table 3.
Subcellular localization of proteins identified in the EGFP-NS1 sample showing a 1-log2-fold or greater relative increase in abundance
| Subcellular localizationa | No. of proteins |
|---|---|
| Cytoplasm | 125 |
| Nucleus | 65 |
| Plasma membrane | 19 |
| Other | 12 |
The protein localization information was determined using Ingenuity Pathway Analysis software.
Fig 3.

Bioinformatics analysis of identified proteins. Classification was based on the cellular function of all proteins identified and quantified with an abundance ratio greater than 1 log2 unit in the GFP-trap immunoprecipitates from cells expressing the EGFP-NS1.
Fig 4.

Ingenuity Pathway Analysis network for transcription- and cell cycle-related proteins illustrating interacting networks for proteins identified as having a 1-log2-unit or more increase in abundance in immunoprecipitates from cells expressing EGFP-NS1 compared to immunoprecipitates from cells expressing EGFP. Shading reflects an increase in the SILAC ratio between EGFP-NS1 and EGFP.
Validation of EGFP-NS1 interactions.
Bioinformatic analysis of the interactome data suggested a number of different cellular functions of NS1, including transcriptional regulation and cell cycle arrest. These were further investigated using functional assays. Validation of the interaction between EGFP-NS1 and various different cellular proteins involved in the transcription complex as well as ATR was performed by Western blot analysis (Fig. 5) using antibodies against selected cellular proteins identified by the LC-MS/MS analysis (Table 1; see Table S1 in the supplemental material). The selected proteins were chosen in part due to their identification in the LC-MS/MS analysis by multiple peptides and due to their value relative to the modal ratio in immunoprecipitates from EGFP-NS1 compared to control cells expressing EGFP or EGFP-NS2. To investigate whether these selected cellular components represented nonspecific interactions with components of the GFP trap, control immunoprecipitations using both uncoupled agarose beads and a red fluorescent protein (RFP) trap that comprised a single-domain anti-RFP antibody conjugated to the same agarose bead matrix used in the GFP trap were performed. These focused on cyclin C, Med8, Pol II (RPB1), and ATR as potential positive interactions and Hsp70 and vimentin as potential background interactions. As expected, Western blot analysis showed that the GFP trap specifically immunoprecipitated cyclin C, Med8, Pol II, and ATR, whereas the RFP trap and the agarose bead controls did not (Fig. 5). Hsp70 and vimentin were not selectively immunoprecipitated by the GFP trap, thus confirming the effectiveness of the GFP trap methodology for the specific precipitation of the EGFP-NS1 (Fig. 5). Cyclin C, Med8, Pol II, and ATR did not bind to EGFP-NS2, suggesting a specific association with EGFP-NS1.
Fig 5.
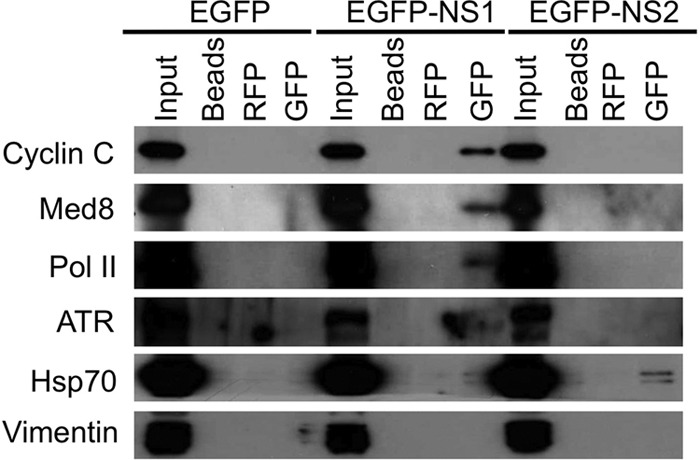
Confirmation of coimmunoprecipitation of specific cellular proteins with EGFP-NS1. Unlabeled cells were transfected with plasmids expressing EGFP, EGFP-NS1, and EGFP-NS2, and 24 h later, cell lysate components were immunoprecipitated using unconjugated agarose beads, an RFP trap, or a GFP trap. Immunoprecipitates were probed with an anti-EGFP antibody, confirming the immunoprecipitation of EGFP-NS1 using a GFP trap and the absence of EGFP-NS1 from immunoprecipitates from the RFP trap and unconjugated agarose beads. These immunoprecipitates were then probed for the presence of the cellular proteins cyclin C, MED8, Pol II, ATR, Hsp70, and vimentin. Cell lysate from EGFP-NS2-expressing cells was included as a control to demonstrate the specificity of cyclin C, MED8, Pol II, and ATR for EGFP-NS1.
NS1 as a potential inhibitor of the cell cycle.
EGFP-NS1 was found with complexes containing 19 proteins associated with cell cycle regulation, including ATR, structural maintenance of chromosomes 3 (SMC3), mediator complex subunit 29 (MED29), and damage-specific DNA binding protein 1 (DDBA), suggesting that NS1 may be able to induce cell cycle arrest. ATR and ataxia telangiectasia mutated protein (ATM) are DNA damage sensors, which activate the DNA damage checkpoint, thus leading to cell cycle arrest through either p53-p21WAF1/CIP1 signaling or Chk1-cdc25c signaling, for example, through inhibitory effects on CDK4. Previous work has shown that HRSV infection can induce enrichment of cells in the G1 phase of the cell cycle (56). Therefore, we hypothesized that the interaction between EGFP-NS1 and cell cycle regulatory factors could lead to a delay/arrest in the cell cycle.
To investigate whether NS1 could cause cell cycle perturbations, cell cycle profiles were analyzed by flow cytometry using DAPI to stain DNA at 48 h posttransfection of 293T cells expressing EGFP-NS1 or, as controls, EGFP or EGFP-NS2 (Fig. 6A and C). There was an increase in the proportion of cells in the G0/G1 phase in cells expressing EGFP-NS1 compared to that for the controls (Fig. 6A and C). To further validate this observation, cells were treated with nocodazole, a mitotic inhibitor, to deplete the proportion of cells in the G1 phase and highlight any specific G1-phase-arrest cells (which would be unable to progress through the cell cycle to the G2/M phase) induced by EGFP-NS1. Again, only cells expressing EGFP-NS1 accumulated in the G0/G1 phase, whereas mock-transfected cells or cells expressing EGFP or EGFP-NS2 cells were enriched in the G2/M phase of the cell cycle with the addition of nocodazole (Fig. 6B and C). Taken together, these results indicated that expression of EGFP-NS1 resulted in a cell cycle arrest at G0/G1 phase in 293T cells.
Fig 6.

Cell cycle profiles of A549 cells either mock transfected or expressing EGFP, EGFP-NS1, or EGFP-NS2 in the absence (A) or presence (B) of nocodozole. (C) Histograms of the data presented in panels A and B, upper and lower panels, respectively. Data from three replicate experiments were analyzed using Student's t test (*, P < 0.05). (D) Cell cycle profiles of A549 cells either mock infected or infected with recombinant HRSV (rA2) or recombinant virus in which the NS1 gene (ΔNS1), the NS2 gene (ΔNS2), or both the NS1 and NS2 genes (ΔNS1/2) were deleted. Data from three replicate experiments were analyzed using Student's t test (*, P < 0.05).
To investigate this further, cell cycle profiles were analyzed in A549 cells either mock infected or infected with either recombinant wild-type HRSV (rA2) or recombinant viruses in which either the NS1 gene (ΔNS1), the NS2 gene (ΔNS2), or both the NS1 and NS2 genes (ΔNS1/2) had been deleted (43). The data indicated that similar G0/G1 cell cycle profiles were obtained for mock-infected cells and cells infected with the ΔNS1 and ΔNS1/2 recombinant viruses. However, similar to studies with wild-type virus (56), there was an increase in the G1-phase population in cells infected with either rA2 or ΔNS2 (Fig. 6D), again indicating a possible role for NS1 in G1-phase enrichment.
DISCUSSION
RNA viruses have limited coding capacity, and their proteins often possess multiple functional domains and the ability to interact with both viral and cellular proteins. This is the case with HRSV NS1. To derive a more complete listing of the potential cellular interacting partners of NS1, a GFP trap coupled to SILAC and LC-MS/MS was utilized. This approach can be used to identify stable components of protein-protein and multiple-protein complexes (37).
A total of 221 unique cellular proteins were identified as being enriched 2-fold or more in binding to EGFP-NS1 over EGFP. The potential accuracy of this data set could be further improved using SILAC-based approaches optimized for identifying low-affinity and transient interactions (55). Western blot analysis of samples derived from nonlabeled biological replicates was used to investigate the coimmunoprecipitation of selected cellular proteins that had abundance ratios above and below a 2-fold ratio and included an analysis of binding to different matrices. The data confirmed that the LC-MS/MS ratio between EGFP-NS1 and EGFP was a reliable indicator of specific and nonspecific interactions, similar to findings where this technology has been used to probe the porcine reproductive and respiratory syndrome virus nucleocapsid protein interactome (26). Many of these cellular proteins could be grouped into functional complexes, and therefore, it is unlikely that NS1 could interact with all 221 proteins and more likely that NS1 formed an interaction with several cellular proteins that then resulted in an association with other cellular proteins via indirect interactions. The list of potential interacting proteins should not be considered exhaustive, as proteins with very low abundance or unstable proteins may not be represented. As NS1 and NS2 are not thought to be stable proteins and interact with many components of the protein degradation pathway and other transient proteins (17), potential further work would be to determine the interactome in the presence of proteasome inhibitors (as has been done to study the interaction of NS1 and NS2 with cellular proteins [17]) that may allow some of these interactions to be captured.
Nevertheless, NS1 was found to interact with cellular proteins involved in the transcription of class II genes, including cyclin C, mediator complex, and RNA polymerase II. Mediator complex functions as a transcriptional coactivator which binds to the C-terminal domain of RNA polymerase II holoenzyme and acts as a bridge between transcription factors and Pol II (4, 12). Cyclin C is also a component of the mediator complex. It binds to and activates CDK8, resulting in the phosphorylation of the C-terminal domain (CTD) of the Pol II large subunit, required for the initiation of transcription and mRNA elongation. Previous studies have shown that bunyamwera virus NS protein prevents the phosphorylation of serine 2 of the RNA Pol II CTD through interaction with MED8 (29) and La Crosse virus NS protein induces a DNA damage-like response triggering the degradation of RPB1 (51). The herpesvirus protein 16 also forms a very tight association with MED23 for transcriptional activation (32, 54). Therefore, HRSV NS1 may also potentially interfere with the host RNA transcription via mediator complex. NS1 has been reported to have inhibitory effects on HRSV minigenome transcription and RNA replication through an unknown mechanism (1) and can interact with transcriptional coactivators to disrupt interactions with host cell promoter elements (41).
One of the surprising findings was the association of NS1 with factors involved in cell cycle regulation and DNA repair pathways. Cell cycle regulation and arrest/enrichment of cells in the G0/G1 phase and other phases of the cell cycle have been associated with HRSV infection (22, 33, 56). Here overexpression of NS1 resulted in an enrichment of cells in the G0/G1 phase of the cell cycle. Conversely, infection of cells with recombinant HRSV deficient in the expression of NS1 resulted in no observable differences in the cell cycle compared to mock-infected controls, pointing to the presence of NS1 in cells resulting in cell cycle changes. Whether this effect is mediated directly through interaction with cell cycle regulatory factors or may be due to indirect effects such as changes in the abundance of STAT1 (15) remains to be determined.
Several other groups have used EGFP-fusion proteins to study the interaction of virus proteins with the host cell (14, 26, 34). Utilizing this technology in combination with SILAC coupled to LC-MS/MS has allowed the determination of the cellular interacting partners of a viral protein belonging to an important human pathogen. Approaches like these are particularly important for viruses such as HRSV, where the limited coding capacity and the need for genetic economy would suggest that viral proteins may have multiple functions inside the host cell.
Supplementary Material
ACKNOWLEDGMENTS
J.N.B. and D.A.M. are funded by the Wellcome Trust. This study was funded in part by a grant from the NIAID to M.N.T. (R01-AI081977). The Thermo Fisher Orbitrap Velos mass spectrometer used in the study was provided through funding of the Wolfson Foundation to K.J.H.
We thank Charlie Szekeres (USF) and Gareth Howell (UoL) for assistance with the flow cytometry. We thank Peter Collins for the viruses with NS deletions.
Footnotes
Published ahead of print 16 May 2012
Supplemental material for this article may be found at http://jvi.asm.org/.
REFERENCES
- 1. Atreya PL, Peeples ME, Collins PL. 1998. The NS1 protein of human respiratory syncytial virus is a potent inhibitor of minigenome transcription and RNA replication. J. Virol. 72:1452–1461 [DOI] [PMC free article] [PubMed] [Google Scholar]
- 2. Barsnes H, Vizcaino JA, Eidhammer I, Martens L. 2009. PRIDE converter: making proteomics data-sharing easy. Nat. Biotechnol. 27:598–599 [DOI] [PubMed] [Google Scholar]
- 3. Bitko V, et al. 2007. Nonstructural proteins of respiratory syncytial virus suppress premature apoptosis by an NF-kappaB-dependent, interferon-independent mechanism and facilitate virus growth. J. Virol. 81:1786–1795 [DOI] [PMC free article] [PubMed] [Google Scholar]
- 4. Blazek E, Mittler G, Meisterernst M. 2005. The mediator of RNA polymerase II. Chromosoma 113:399–408 [DOI] [PubMed] [Google Scholar]
- 5. Bossert B, Conzelmann KK. 2002. Respiratory syncytial virus (RSV) nonstructural (NS) proteins as host range determinants: a chimeric bovine RSV with NS genes from human RSV is attenuated in interferon-competent bovine cells. J. Virol. 76:4287–4293 [DOI] [PMC free article] [PubMed] [Google Scholar]
- 6. Bossert B, Marozin S, Conzelmann KK. 2003. Nonstructural proteins NS1 and NS2 of bovine respiratory syncytial virus block activation of interferon regulatory factor 3. J. Virol. 77:8661–8668 [DOI] [PMC free article] [PubMed] [Google Scholar]
- 7. Boulon S, et al. 2010. Establishment of a protein frequency library and its application in the reliable identification of specific protein interaction partners. Mol. Cell. Proteomics 9:861–879 [DOI] [PMC free article] [PubMed] [Google Scholar]
- 8. Brasier AR, et al. 2004. Nuclear heat shock response and novel nuclear domain 10 reorganization in respiratory syncytial virus-infected A549 cells identified by high-resolution two-dimensional gel electrophoresis. J. Virol. 78:11461–11476 [DOI] [PMC free article] [PubMed] [Google Scholar]
- 9. Cane PA, Matthews DA, Pringle CR. 1991. Identification of variable domains of the attachment (G) protein of subgroup A respiratory syncytial viruses. J. Gen. Virol. 72(Pt 9):2091–2096 [DOI] [PubMed] [Google Scholar]
- 10. Collins PL, Graham BS. 2008. Viral and host factors in human respiratory syncytial virus pathogenesis. J. Virol. 82:2040–2055 [DOI] [PMC free article] [PubMed] [Google Scholar]
- 11. Collins PL, Murphy BR. 2002. Respiratory syncytial virus: reverse genetics and vaccine strategies. Virology 296:204–211 [DOI] [PubMed] [Google Scholar]
- 12. Conaway RC, Sato S, Tomomori-Sato C, Yao T, Conaway JW. 2005. The mammalian mediator complex and its role in transcriptional regulation. Trends Biochem. Sci. 30:250–255 [DOI] [PubMed] [Google Scholar]
- 13. Coombs KM, et al. 2010. Quantitative proteomic analyses of influenza virus-infected cultured human lung cells. J. Virol. 84:10888–10906 [DOI] [PMC free article] [PubMed] [Google Scholar]
- 14. Cristea IM, et al. 2006. Tracking and elucidating alphavirus-host protein interactions. J. Biol. Chem. 281:30269–30278 [DOI] [PubMed] [Google Scholar]
- 15. Dimco G, Knight RA, Latchman DS, Stephanou A. 2010. STAT1 interacts directly with cyclin D1/Cdk4 and mediates cell cycle arrest. Cell Cycle 9:4638–4649 [DOI] [PubMed] [Google Scholar]
- 16. Dove BK, et al. 2012. A quantitative proteomic analysis of lung epithelial (A549) cells infected with 2009 pandemic influenza A virus using stable isotope labelling with amino acids in cell culture (SILAC). Proteomics 12:1431–1436 doi:10.1002/pmic.201100470 [DOI] [PubMed] [Google Scholar]
- 17. Elliott J, et al. 2007. Respiratory syncytial virus NS1 protein degrades STAT2 by using the Elongin-Cullin E3 ligase. J. Virol. 81:3428–3436 [DOI] [PMC free article] [PubMed] [Google Scholar]
- 18. Emmott E, et al. 2010. Quantitative proteomics using stable isotope labeling with amino acids in cell culture reveals changes in the cytoplasmic, nuclear, and nucleolar proteomes in Vero cells infected with the coronavirus infectious bronchitis virus. Mol. Cell. Proteomics 9:1920–1936 [DOI] [PMC free article] [PubMed] [Google Scholar]
- 19. Emmott E, Smith C, Emmett SR, Dove BK, Hiscox JA. 2010. Elucidation of the avian nucleolar proteome by quantitative proteomics using stable isotope labeling with amino acids in cell culture (SILAC) and alteration in the coronavirus infectious bronchitis virus infected cells. Proteomics 10:3558–3562 [DOI] [PMC free article] [PubMed] [Google Scholar]
- 20. Emmott E, et al. 2010. Quantitative proteomics using SILAC coupled to LC-MS/MS reveals changes in the nucleolar proteome in influenza A virus-infected cells. J. Proteome Res. 9:5335–5345 [DOI] [PubMed] [Google Scholar]
- 21. Evans JE, Cane PA, Pringle CR. 1996. Expression and characterisation of the NS1 and NS2 proteins of respiratory syncytial virus. Virus Res. 43:155–161 [DOI] [PubMed] [Google Scholar]
- 22. Gibbs JD, Ornoff DM, Igo HA, Zeng JY, Imani F. 2009. Cell cycle arrest by transforming growth factor beta1 enhances replication of respiratory syncytial virus in lung epithelial cells. J. Virol. 83:12424–12431 [DOI] [PMC free article] [PubMed] [Google Scholar]
- 23. Hall CB, et al. 2009. The burden of respiratory syncytial virus infection in young children. N. Engl. J. Med. 360:588–598 [DOI] [PMC free article] [PubMed] [Google Scholar]
- 24. Hastie ML, et al. 2012. The human respiratory syncytial virus nonstructural protein 1 regulates type I and type II interferon pathways. Mol. Cell. Proteomics 11:108–127 [DOI] [PMC free article] [PubMed] [Google Scholar]
- 25. Hengst U, Kiefer P. 2000. Domains of human respiratory syncytial virus P protein essential for homodimerization and for binding to N and NS1 protein. Virus Genes 20:221–225 [DOI] [PubMed] [Google Scholar]
- 26. Jourdan JS, Osorio F, Hiscox JA. 2012. An interactome map of the nucleocapsid protein from a highly pathogenic North American porcine reproductive and respiratory syndrome virus strain generated using SILAC-based quantitative proteomics. Proteomics 12:1015–1023 [DOI] [PMC free article] [PubMed] [Google Scholar]
- 27. Kerrien S, et al. 2012. The IntAct molecular interaction database in 2012. Nucleic Acids Res. 40(Database issue):D841–D846 [DOI] [PMC free article] [PubMed] [Google Scholar]
- 28. Lam YW, Evans VC, Heesom KJ, Lamond AI, Matthews DA. 2010. Proteomics analysis of the nucleolus in adenovirus-infected cells. Mol. Cell. Proteomics 9:117–130 [DOI] [PMC free article] [PubMed] [Google Scholar]
- 29. Leonard VH, Kohl A, Hart TJ, Elliott RM. 2006. Interaction of bunyamwera orthobunyavirus NSs protein with mediator protein MED8: a mechanism for inhibiting the interferon response. J. Virol. 80:9667–9675 [DOI] [PMC free article] [PubMed] [Google Scholar]
- 30. Ling Z, Tran KC, Teng MN. 2009. Human respiratory syncytial virus nonstructural protein NS2 antagonizes the activation of beta interferon transcription by interacting with RIG-I. J. Virol. 83:3734–3742 [DOI] [PMC free article] [PubMed] [Google Scholar]
- 31. Martinez FD. 2003. Respiratory syncytial virus bronchiolitis and the pathogenesis of childhood asthma. Pediatr. Infect. Dis. J. 22:S76–S82 [DOI] [PubMed] [Google Scholar]
- 32. Milbradt AG, et al. 2011. Structure of the VP16 transactivator target in the mediator. Nat. Struct. Mol. Biol. 18:410–415 [DOI] [PMC free article] [PubMed] [Google Scholar]
- 33. Mohapatra S, et al. 2009. Human respiratory syncytial virus reduces the number of cells in S-phase and increases GADD153 expression in HEp-2 cells. Acta Virol. 53:207–211 [DOI] [PubMed] [Google Scholar]
- 34. Moorman NJ, et al. 2008. Human cytomegalovirus protein UL38 inhibits host cell stress responses by antagonizing the tuberous sclerosis protein complex. Cell Host Microbe 3:253–262 [DOI] [PMC free article] [PubMed] [Google Scholar]
- 35. Munday D, Hiscox JA, Barr JN. 2010. Quantitative proteomic analysis of A549 cells infected with human respiratory syncytial virus subgroup B using stable isotope labeling with amino acids in cell culture (SILAC) coupled to LC-MS/MS. Proteomics 10:4320–4334 [DOI] [PMC free article] [PubMed] [Google Scholar]
- 36. Munday DC, et al. 2010. Quantitative proteomic analysis of A549 cells infected with human respiratory syncytial virus. Mol. Cell. Proteomics 9:2438–2459 [DOI] [PMC free article] [PubMed] [Google Scholar]
- 37. Munday DC, et al. 2012. Using stable isotope labeling by amino acids in cell culture (SILAC) and quantitative proteomics to investigate the interactions between viral and host proteomes. Proteomics: 12:666–672 doi:10.1002/pmic.201100488 [DOI] [PubMed] [Google Scholar]
- 38. Munir S, et al. 2011. Respiratory syncytial virus interferon antagonist NS1 protein suppresses and skews the human T lymphocyte response. PLoS Pathog. 7:e1001336 doi:10.1371/journal.ppat.1001336 [DOI] [PMC free article] [PubMed] [Google Scholar]
- 39. Munir S, et al. 2008. Nonstructural proteins 1 and 2 of respiratory syncytial virus suppress maturation of human dendritic cells. J. Virol. 82:8780–8796 [DOI] [PMC free article] [PubMed] [Google Scholar]
- 40. Openshaw PJ, Dean GS, Culley FJ. 2003. Links between respiratory syncytial virus bronchiolitis and childhood asthma: clinical and research approaches. Pediatr. Infect. Dis. J. 22:S58–S64 [DOI] [PubMed] [Google Scholar]
- 41. Ren J, et al. 2011. A novel mechanism for the inhibition of interferon regulatory factor-3-dependent gene expression by human respiratory syncytial virus NS1 protein. J. Gen. Virol. 92:2153–2159 [DOI] [PMC free article] [PubMed] [Google Scholar]
- 42. Schlender J, Bossert B, Buchholz U, Conzelmann KK. 2000. Bovine respiratory syncytial virus nonstructural proteins NS1 and NS2 cooperatively antagonize alpha/beta interferon-induced antiviral response. J. Virol. 74:8234–8242 [DOI] [PMC free article] [PubMed] [Google Scholar]
- 43. Spann KM, Tran KC, Collins PL. 2005. Effects of nonstructural proteins NS1 and NS2 of human respiratory syncytial virus on interferon regulatory factor 3, NF-kappaB, and proinflammatory cytokines. J. Virol. 79:5353–5362 [DOI] [PMC free article] [PubMed] [Google Scholar]
- 44. Straub CP, et al. 2011. Mutation of the elongin C binding domain of human respiratory syncytial virus non-structural protein 1 (NS1) results in degradation of NS1 and attenuation of the virus. Virol. J. 8:252. [DOI] [PMC free article] [PubMed] [Google Scholar]
- 45. Swedan S, Andrews J, Majumdar T, Musiyenko A, Barik S. 2011. Multiple functional domains and complexes of the two nonstructural proteins of human respiratory syncytial virus contribute to interferon suppression and cellular location. J. Virol. 85:10090–10100 [DOI] [PMC free article] [PubMed] [Google Scholar]
- 46. Swedan S, Musiyenko A, Barik S. 2009. Respiratory syncytial virus nonstructural proteins decrease levels of multiple members of the cellular interferon pathways. J. Virol. 83:9682–9693 [DOI] [PMC free article] [PubMed] [Google Scholar]
- 47. Teng MN, et al. 2000. Recombinant respiratory syncytial virus that does not express the NS1 or M2-2 protein is highly attenuated and immunogenic in chimpanzees. J. Virol. 74:9317–9321 [DOI] [PMC free article] [PubMed] [Google Scholar]
- 48. ten Have S, Boulon S, Ahmad Y, Lamond AI. 2011. Mass spectrometry-based immuno-precipitation proteomics—the user's guide. Proteomics 11:1153–1159 [DOI] [PMC free article] [PubMed] [Google Scholar]
- 49. Trinkle-Mulcahy L, et al. 2008. Identifying specific protein interaction partners using quantitative mass spectrometry and bead proteomes. J. Cell Biol. 183:223–239 [DOI] [PMC free article] [PubMed] [Google Scholar]
- 50. van Diepen A, et al. 2010. Quantitative proteome profiling of respiratory virus-infected lung epithelial cells. J. Proteomics 73:1680–1693 [DOI] [PubMed] [Google Scholar]
- 51. Verbruggen P, et al. 2011. Interferon antagonist NSs of La Crosse virus triggers a DNA damage response-like degradation of transcribing RNA polymerase II. J. Biol. Chem. 286:3681–3692 [DOI] [PMC free article] [PubMed] [Google Scholar]
- 52. Vizcaino JA, et al. 2009. A guide to the Proteomics Identifications Database proteomics data repository. Proteomics 9:4276–4283 [DOI] [PMC free article] [PubMed] [Google Scholar]
- 53. Vogels MW, et al. 2011. Identification of host factors involved in coronavirus replication by quantitative proteomics analysis. Proteomics 11:64–80 [DOI] [PMC free article] [PubMed] [Google Scholar]
- 54. Vojnic E, et al. 2011. Structure and VP16 binding of the mediator Med25 activator interaction domain. Nat. Struct. Mol. Biol. 18:404–409 [DOI] [PubMed] [Google Scholar]
- 55. Wang X, Huang L. 2008. Identifying dynamic interactors of protein complexes by quantitative mass spectrometry. Mol. Cell. Proteomics 7:46–57 [DOI] [PubMed] [Google Scholar]
- 56. Wu W, et al. 2011. Characterization of the interaction between human respiratory syncytial virus and the cell cycle in continuous cell culture and primary human airway epithelial cells. J. Virol. 85:10300–10309 [DOI] [PMC free article] [PubMed] [Google Scholar]
- 57. Zhang L, Zhang ZP, Zhang XE, Lin FS, Ge F. 2010. Quantitative proteomics analysis reveals BAG3 as a potential target to suppress severe acute respiratory syndrome coronavirus replication. J. Virol. 84:6050–6059 [DOI] [PMC free article] [PubMed] [Google Scholar]
- 58. Zhang W, et al. 2005. Inhibition of respiratory syncytial virus infection with intranasal siRNA nanoparticles targeting the viral NS1 gene. Nat. Med. 11:56–62 [DOI] [PubMed] [Google Scholar]
Associated Data
This section collects any data citations, data availability statements, or supplementary materials included in this article.