

Abstract
BACKGROUND AND PURPOSE
The amelioration of insulin resistance by bilobetin is closely related to its hypolipidaemic effect. The aim of the present study was to determine the insulin-sensitizing mechanism of bilobetin by elucidating its effect on lipid metabolism.
EXPERIMENTAL APPROACH
Rats fed a high-fat diet were treated with bilobetin for either 4 or 14 days before applying a hyperinsulinaemic–euglycaemic clamp. Triglyceride and fatty acids labelled with radioactive isotopes were used to track the transportation and the fate of lipids in tissues. The activity of lipid metabolism-related enzymes and β-oxidation rate were measured. Western blot was used to investigate the phosphorylation, translocation and expression of PPARα in several tissues and cultured cells. The location of amino acid residues subjected to phosphorylation in PPARα was also studied.
KEY RESULTS
Bilobetin ameliorated insulin resistance, increased the hepatic uptake and oxidation of lipids, reduced very-low-density lipoprotein triglyceride secretion and blood triglyceride levels, enhanced the expression and activity of enzymes involved in β-oxidation and attenuated the accumulation of triglycerides and their metabolites in tissues. Bilobetin also increased the phosphorylation, nuclear translocation and activity of PPARα accompanied by elevated cAMP level and PKA activity. Threonine-129–alanine and/or serine-163–alanine mutations on the PPARα genes and PKA inhibitors prevented the effects of bilobetin on PPARα. However, cells overexpressing PKA appeared to stimulate the phosphorylation, nuclear translocation and activity of PPARα.
CONCLUSIONS AND IMPLICATIONS
Bilobetin treatment ameliorates hyperlipidaemia, lipotoxicity and insulin resistance in rats by stimulating PPARα-mediated lipid catabolism. PKA activation is crucial for this process.
Keywords: insulin resistance, PPARα, PKA, phosphorylation, lipid metabolism
Introduction
Insulin resistance, one of the key characteristics of the metabolic syndrome, often progresses to type 2 diabetes. Peripheral insulin resistance, which is usually associated with hyperlipidaemia, is one of the earliest detectable defects identified in individuals at risk of type 2 diabetes (Ginsberg et al., 2006). Increased availability of circulating lipids, especially non-esterified fatty acid (NEFA) and very low-density lipoprotein triglyceride (VLDL-TG), contributes to the accumulation of lipids and their metabolic products in muscles and the liver (Adiels et al., 2006). Lipid metabolites, such as diacyl glycerol (DAG) and long-chain acyl CoA (LCACoA), can decrease insulin sensitivity (Chavez and Summers, 2005). Hence, agents that can reverse lipotoxicity (Oakes et al., 1999) and/or reduce inflammation (Collino et al., 2010) have received considerable interest for their potential to ameliorate insulin resistance.
To increase insulin sensitivity, much effort has been made to remove lipids and their detrimental metabolites from muscles and liver, two of the largest insulin-sensitive tissues; PPAR agonists have been used to do this with some success (Chen et al., 2009). PPARα, a member of the nuclear receptor superfamily, is predominantly expressed in tissues in which fatty acid oxidation occurs. By regulating the expression of genes involved in the uptake and oxidation of lipids, it plays an important role in lipid homeostasis (Lewis et al., 2002). PPARα activity can be stimulated by phosphorylation in addition to being activated by specific ligands (Desvergne and Wahli, 1999). In fact, several amino acid residues contained in different domains of PPARα can be phosphorylated, and thus the transcriptional activity of PPARα is promoted even in the absence of exogenous ligands (Burns and Vanden-Heuvel, 2007). PPARα can be phosphorylated by various kinases, such as MAPK, PKC and AMP-activated protein kinase (Gray et al., 2005; Burns and Vanden-Heuvel, 2007). However, there is relatively little information (Lazennec et al., 2000; Burns and Vanden-Heuvel, 2007) available concerning PPARα phosphorylation by PKA, and the amino acid residues subjected to phosphorylation have not yet been revealed. PKA refers to a family of enzymes whose activity depends on the level of cAMP in the cell. An elevation in the intracellular levels of cAMP, generated by the inhibition of PDE, results in the activation of PKA (Taskén and Aandahl, 2004).
Ginkgo biloba has long been used as a traditional Chinese medicine against several human diseases including hyperlipidaemia and diabetes. Preliminary experiments have established that bilobetin, an active component of G. biloba, can reduce blood lipids and improve the effects of insulin. Interestingly, bilobetin has also been shown to be a cAMP PDE inhibitor, which activates PKA by elevating the intracellular cAMP level (Saponara and Bosisio, 1998). However, it is unclear whether bilobetin exerts its hypolipidaemic effect as a result of PKA-mediated phosphorylation of PPARα. The links between PKA activation, PPARα phosphorylation and the following biological effects have not yet been established; therefore, we attempted to find out whether PPARα mediates the hypolipidaemic and insulin-sensitizing effect of bilobetin and, if so, what is the underlying mechanism? In other words, does bilobetin act as a ligand of PPARα or produce its effect by PKA-mediated phosphorylation of this receptor? To target the exact amino acid residues subjected to phosphorylation by PKA in PPARα is also a brand new task.
In this study we determined the in vivo efficacy and the molecular mechanisms by which bilobetin improves lipid metabolism and the effects of insulin. We observed the effects of bilobetin treatment on PKA activity, lipid dynamics and insulin sensitivity in tissues of rats fed a high-fat diet (HFD). We also obtained evidence showing that PKA activation induced by bilobetin treatment plays a central role in the phosphorylation and nuclear translocation of PPARα.
Methods
Preparation of bilobetin
Bilobetin was isolated and purified from G.biloba by our team. Briefly, dry leaves of G. biloba were extracted with 93% ethanol and then with chloroform. The extracts were loaded onto a column of silica gel and eluted with n-hexane/acetoacetate (70:30) and then followed by elution with chloroform/methanol (70:30). Bilobetin was finally purified by crystallization (purity ≥ 99%, HPLC).
Experimental animals
All animal care and experimental procedures were performed in accordance with the guidelines for animal care of Jiangsu province and were approved by the National Experimental Animal Expert Committee. Eight-week-old male Sprague–Dawley rats (n= 186) were obtained from Slac, Shanghai. Rats were housed in a temperature-controlled (22 ± 1°C) environment with a 12 h light, 12 h dark cycle (lights on at 6:00 h). Standard diet (12.5 kJ·g−1) and high-fat diet (21.4 kJ·g−1; 59% fat, 21% protein and 20% carbohydrate, expressed as % of total dietary calories) were also purchased from Slac. After a 1 week acclimatization period, 180 rats with access to water ad libitum were randomly assigned to six groups. The normal group was fed a standard diet for 8 weeks; HFD group was fed a HFD for 8 weeks; BIL14 and BIL4 groups received HFD for 8 weeks, but bilobetin (dissolved in PBS at pH = 8.5 and injected i.p., 12 mg·kg−1·day−1) was administered for the last 14 days (BIL14) or 4 days (BIL4) of HFD feeding to observe the different effects of short-term and long-term treatment with bilobetin; BIL4M and BIL4H groups received the same treatment as the BIL4 group, but either MK886 (Biomol, Shanghai, China; a non-competitive PPARα inhibitor) (BIL4M, 50 mg·kg−1·day−1) or H89 (Biomol; a competitive PKA inhibitor) (BIL4H, 50 mg·kg−1·day−1) was suspended in 1.25% γ-cyclodextrin (Sigma, Shanghai, China) solution and injected i.v. 30 min before the bilobetin treatment. An additional BIL14H group (six rats) received HFD for 8 weeks, but these rats were treated with H89 in addition to bilobetin for the last 14 days. The BIL14H group was used to obtain the data presented in Tables 1 and 2, and Figure 3.
Table 1.
Effects of bilobetin on body weights and weights of some tissues
| Normal | HFD | BIL14 | BIL4 | BIL14H | BIL4M | BIL4H | |
|---|---|---|---|---|---|---|---|
| Body weight (g) | 368.8 ± 34.7 | 406.8 ± 37.4 | 376.3 ± 33.3 | 391.1 ± 32.2 | 442.1 ± 39.5 | 423.7 ± 30.7 | 412.0 ± 33.1 |
| Body weight gain (g) | |||||||
| 8 weeks | 150.8 ± 19.3 | 193.8 ± 22.5 | 166.3 ± 16.6 | 174.1 ± 18.4 | 209.8 ± 32.4 | 209.7 ± 21.8 | 196.5 ± 19.7 |
| The last 14 days | 37.2 ± 4.7a | 57.3 ± 8.1 | 31.9 ± 6.3a | 52.6 ± 7.4 | 63.4 ± 9.7c | 59.8 ± 7.1 | 53.5 ± 6.8 |
| Liver weight (g) | 14.6 ± 0.4 | 14.7 ± 0.5 | 15.7 ± 0.6 | 14.6 ± 0.5 | 14.8 ± 0.6 | 15.1 ± 0.5 | 15.3 ± 0.4 |
| Tissue weight (% of body weight) | |||||||
| Liver | 3.96 ± 0.11b | 3.62 ± 0.10 | 4.21 ± 0.13a | 3.74 ± 0.12 | 3.38 ± 0.16c | 3.58 ± 0.11 | 3.72 ± 0.12 |
| Epididymal fat | 1.10 ± 0.16a | 1.99 ± 0.11 | 1.36 ± 0.19b | 1.59 ± 0.17 | 2.21 ± 0.15c | 1.93 ± 0.10 | 1.88 ± 0.17 |
| Mesenteric fat | 0.64 ± 0.12a | 1.36 ± 0.14 | 0.89 ± 0.12b | 1.18 ± 0.16 | 1.51 ± 0.19c | 1.39 ± 0.13 | 1.31 ± 0.15 |
| Perirenal fat | 1.51 ± 0.15a | 2.19 ± 0.13 | 1.73 ± 0.12b | 1.89 ± 0.12 | 2.25 ± 0.16c | 2.14 ± 0.14 | 2.21 ± 0.17 |
| Inguinal fat | 1.61 ± 0.25 | 1.94 ± 0.21 | 1.86 ± 0.24 | 1.88 ± 0.28 | 1.89 ± 0.25 | 1.91 ± 0.23 | 1.92 ± 0.25 |
| Food intake (g day−1 per rat) | 21.9 ± 1.9 | 21.5 ± 1.5 | 21.8 ± 1.1 | 21.3 ± 1.3 | 21.8 ± 1.5 | 21.6 ± 1.6 | 21.5 ± 1.3 |
Data are means ± SEM. n= 6.
P < 0.01,
P < 0.05 versus HFD group;
P < 0.01 versus BIL14 group (anova).
Table 2.
Effects of bilobetin on plasma enzymes, blood glucose, lipids, and lipoproteins, and insulin sensitivity
| Normal | HFD | BIL14 | BIL4 | BIL14H | BIL4M | BIL4H | ||
|---|---|---|---|---|---|---|---|---|
| Blood glucose (mmol·l−1) | 5.47 ± 0.13 | 5.87 ± 0.14 | 5.61 ± 0.13 | 5.69 ± 0.14 | 6.02 ± 0.16 | 5.95 ± 0.17 | 5.91 ± 0.16 | |
| GIR (mmol·kg−1·min−1) | 1.43 ± 0.13a | 0.87 ± 0.08 | 1.18 ± 0.08b | 1.10 ± 0.10 | 0.84 ± 0.07d | 0.95 ± 0.09 | 0.88 ± 0.09 | |
| EGP (mmol·kg−1·min−1) | Basal | 0.38 ± 0.02a | 0.57 ± 0.05 | 0.40 ± 0.03b | 0.46 ± 0.04 | 0.65 ± 0.05c | 0.61 ± 0.03 | 0.58 ± 0.04 |
| Clamp | 0.15 ± 0.02a | 0.37 ± 0.03 | 0.19 ± 0.03b | 0.27 ± 0.04 | 0.38 ± 0.03c | 0.39 ± 0.03 | 0.37 ± 0.04 | |
| Insulin (µU·ml−1) | Basal | 9.78 ± 1.27a | 15.14 ± 1.22 | 11.09 ± 1.23b | 12.31 ± 1.53 | 15.95 ± 1.65d | 15.82 ± 1.42 | 15.78 ± 1.62 |
| Clamp | 99.96 ± 7.49 | 121.77 ± 7.25 | 104.51 ± 8.37 | 115.12 ± 7.73 | 118.54 ± 6.95 | 123.33 ± 6.42 | 122.82 ± 7.73 | |
| TG (mmol·l−1) | 0.98 ± 0.13a | 1.91 ± 0.09 | 1.11 ± 0.13a | 1.52 ± 0.16 | 2.08 ± 0.19c | 2.03 ± 0.18 | 1.94 ± 0.14 | |
| VLDL-TG (mmol·l−1) | 0.58 ± 0.07a | 1.39 ± 0.19 | 0.68 ± 0.12a | 1.13 ± 0.21 | 1.50 ± 0.23c | 1.43 ± 0.14 | 1.37 ± 0.13 | |
| IDL/LDL-TG (mmol·l−1) | 0.24 ± 0.03b | 0.35 ± 0.02 | 0.26 ± 0.04 | 0.27 ± 0.05 | 0.39 ± 0.08 | 0.40 ± 0.06 | 0.38 ± 0.03 | |
| HDL-TG (mmol·l−1) | 0.14 ± 0.02 | 0.15 ± 0.03 | 0.13 ± 0.03 | 0.13 ± 0.02 | 0.15 ± 0.03 | 0.18 ± 0.06 | 0.16 ± 0.04 | |
| VLDL-apoB-48 (mg·l−1) | 23 ± 5 | 25 ± 3 | 26 ± 2 | 25 ± 2 | 28 ± 3 | 27 ± 3 | 26 ± 2 | |
| VLDL-apoB-100 (mg·l−1) | 71 ± 7 | 101 ± 18 | 97 ± 12 | 99 ± 14 | 102 ± 18 | 104 ± 21 | 98 ± 17 | |
| HDL-apoA-1 (mg·l−1) | 532 ± 76 | 367 ± 53 | 445 ± 87 | 344 ± 49 | 351 ± 81 | 394 ± 64 | 374 ± 55 | |
| NEFA (mmol·l−1) | Basal | 0.42 ± 0.04 | 0.51 ± 0.07 | 0.45 ± 0.04 | 0.50 ± 0.06 | 0.52 ± 0.06 | 0.53 ± 0.05 | 0.48 ± 0.07 |
| Clamp | 0.19 ± 0.03 | 0.32 ± 0.05 | 0.21 ± 0.03 | 0.26 ± 0.04 | 0.39 ± 0.05 | 0.37 ± 0.06 | 0.36 ± 0.05 | |
| ALT (U·l−1) | 77 ± 29 | 88 ± 37 | 86 ± 21 | 79 ± 30 | 76 ± 25 | 72 ± 24 | 71 ± 28 | |
| AST (U·l−1) | 81 ± 8 | 92 ± 19 | 86 ± 12 | 84 ± 16 | 90 ± 13 | 88 ± 21 | 87 ± 10 | |
Data are means ± SEM. n= 6.
P < 0.01,
P < 0.05 vs. HFD group;
P < 0.01,
P < 0.05 vs. BIL14 group (ANOVA). ALT, alanine aminotransferase; Apo, apolipoprotein; AST, aspartate aminotransferase; EGP, endogenous glucose production; GIR glucose infusion rate; HDL high-density lipoprotein; IDL intermediate-density lipoprotein; LDL low-density lipoprotein; NEFA, non-esterified fatty acid; TG, triglyceride; VLDL, very-low-density lipoprotein.
Figure 3.
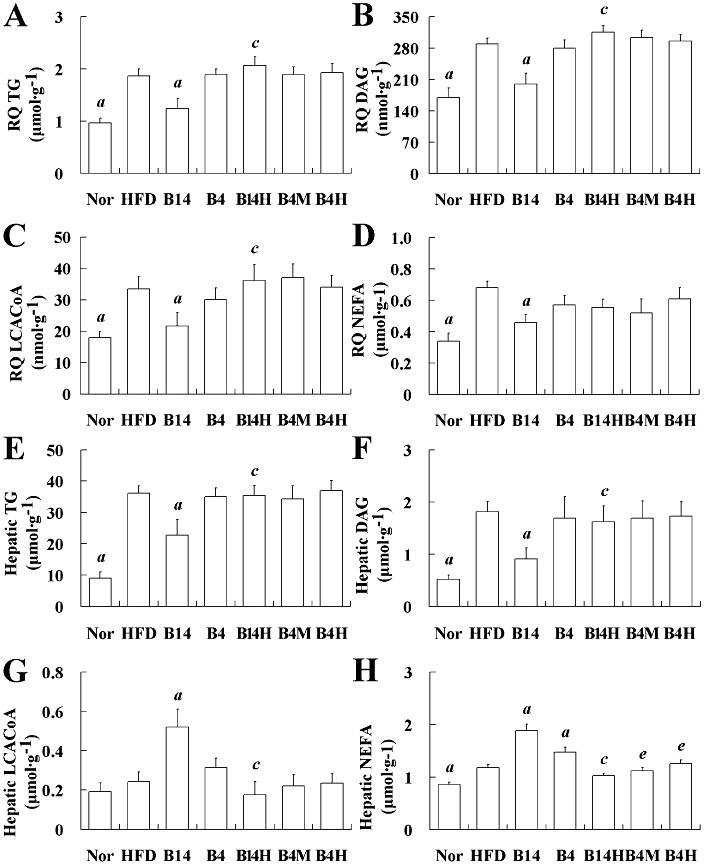
Effects of bilobetin on lipid contents of RQ (A–D) and liver (E–H) in rats. Nor, standard diet; HFD, high-fat diet; B14, HFD + 14 day bilobetin treatment; B4, HFD + 4 day bilobetin treatment; B14H, B14 rats treated with PKA inhibitor (H89). B4M, B4 rats treated with PPARα inhibitor (MK886); B4H, B4 rats treated with H89. Data are means ± SEM. n= 6. aP < 0.01 versus HFD group; cP < 0.01 versus B14 group; eP < 0.01 versus B4 group (anova).
Cell cultures
Primary hepatocytes were prepared from male Sprague–Dawley rat (180–250 g) by the in situ perfusion procedure with collagenase. Primary hepatocytes and HEK293 cells (human embryonic kidney cells) were plated onto 12-well plates, which were coated with 6 µg·cm−2 collagen I, at a density of 2 × 10⁵ cells per well and maintained in Dulbecco's modified Eagle's medium (DMEM; Life Technologies, Shanghai, China) supplemented with 10% fetal bovine serum (FBS) as described previously (Honkakoski et al., 1998). Cell cultures were kept at 37°C under a humidified atmosphere of 95% air and 5% CO2. Cultures that had a viability of more than 90% were used for the subsequent experiments.
Hyperinsulinaemic–euglycaemic clamps
Conscious but restrained overnight-fasted rats were subjected to a 120 min basal period followed by 120 min when they were subjected to a euglycaemic–hyperinsulinaemic clamp (Ye et al., 2011). Insulin (Santa Cruz, Shanghai, China) was infused through the proximal tail vein at a constant rate of 240 mU·kg−1·h−1. Blood glucose was measured using blood glucose monitors (ARKRAY GT-1810) every 5 min in order to adjust the glucose infusion rate. Additionally, the rats were given an infusion (1 mg·kg−1·min−1) of [U-13C]-glucose (Amersham, Beijing, China) through another tail vein. During the last 30 min of the basal period and the last 60 min of clamp periods (steady-state conditions), blood samples were obtained from the orbital venous plexus for the measurement of glucose levels, every 15 min, in accordance with data from previous studies (Beylot et al., 1993; Michael et al., 2006). At the end of basal and clamp periods, additional blood samples for the determination of NEFA were taken. During the steady state, the total amount of glucose appearing in the circulation (Ra) equals the rate of disappearance of glucose from the circulation (Rd). Both were calculated by dividing the [U-13C]-glucose infusion rate by the steady-state value of the increase in glucose. Endogenous glucose production (EGP) was calculated as Rd minus the glucose infusion rate.
Extraction and determination of tissue lipids
TG and DAG were extracted from the liver and muscle by use of a method described by Kaluzny et al. (1985). The concentrations of TG and DAG were determined using a GPO-PAP kit (Randox, Shanghai, China). NEFA was isolated from liver and muscle by the method of Dole and Meinertz (1960). NEFA was measured using an acyl-CoA oxidase-based colorimetric kit (Wako, Shanghai, China). The isolation of LCACoA from liver and muscle was as described by Srivastava et al. (2006). LCACoA was then hydrolyzed with KOH in the presence of dithiothreitol. The CoA liberated was measured by HPLC (Hosokawa et al., 1989). LCACoA content was calculated by measuring the peak area and by comparison to CoA standards (Sigma-Aldrich, Shanghai, China).
Kinetics of Intralipid-TG and VLDL-TG
Conscious but restrained rats were injected through a tail vein with 0.15 mL·kg−1 of 10% Intralipid containing 3 × 10¹⁰ dpm·L−1[9,10-3H]-triolein (Amersham) under either overnight-fasting (basal) or clamp state (Laplante et al., 2009). Blood samples were collected from orbital venous plexus 0, 1, 2, 5, 10 and 20 min after the injection and then centrifuged to obtain plasma. The plasma was quickly frozen by placing it in liquid nitrogen and stored at −20°C until used. Liver, red quadriceps (RQ) and mesenteric WAT (mWAT) were rapidly excised, pre-cooled and kept at −70°C until use. The radioactivity of tissues was quantified as described previously (Hultin et al., 1995). Clearance of Intralipid-TG from blood was calculated by the method of non-linear curve fitting (Rössner, 1974) using Prism (GraphPad, Taipei, Taiwan). Other rats were injected through the tail vein with 600 mg·kg−1 Triton WR1339. Blood samples were taken from the orbital venous plexus 0, 20, 40 and 60 min after injection and prepared for plasma. VLDL-TG secretion rate was calculated by multiplying plasma volume (kg−1 body mass) by the slope obtained from regression of plasma TG accumulation against time. The clearance rate of VLDL-TG was calculated as its secretion rate ÷ plasma TG.
The uptake and storage of NEFA
The mixture of tracers, consisting of 5 × 10¹⁰ dpm·L−1[9,10-3H]-(R)-2-bromopalmitate [synthesized from [9,10-3H]-palmitic acid (Amersham) by a Hell–Volhard–Zelinsky reaction (Harwood, 1962)], and 3 × 10¹⁰ dpm·L−1[U-14C]-palmitate (Amersham), was infused (0.25 mL·min−1) into the tail vein of conscious but restrained rats for 4 min (Oakes et al., 1999). Arterial blood samples (0.2 mL) were withdrawn through a carotid catheter (placed 1 week before the study) at 0, 1, 2, 3, 4, 5, 6, 8, 12 and 16 min after the start of tracer infusion for measuring plasma tracers. After the last blood sample had been taken, the samples of liver, RQ and mWAT were collected and prepared. The tracers contained in plasma, and tissues were separated and determined as described previously (Oakes et al., 1999). The calculation of tissue uptake and storage rates of NEFA are described in the ‘Supporting Information’.
Enzyme activity and palmitate oxidation rate
Plasma alanine aminotransferase (ALT) and aspartate aminotransferase (AST) activities were measured spectroscopically using diagnostic kits from Wako. The extraction of cAMP and PKA from liver, RQ and mWAT was accomplished using the method described by Woo et al. (2006). The cAMP level (DELFIA cAMP kit, PerkinElmer, Shanghai, China) and the PKA activity (Promega, Beijing, China) in tissues and primary hepatocytes were measured by use of commercial kits. The preparation of LPL from liver, RQ and mWAT was as described by Iverius and Lindqvist (1986). LPL activity in tissues was determined by use of a commercial kit (Jiancheng, Nanjing, Jiangsu, China). CPT-1 activity in mitochondria from liver and skeletal muscle was measured using a u.v. spectrophotometry method as described by Bieber et al. (1972). To measure the in vitro palmitate oxidation rate in homogenates of liver and muscle, 14C-metabolites and 14CO2 produced from [14C]-palmitate were quantified according to the method ofDoha et al. (2005). The hepatic levels of ATP, ADP and AMP were measured by HPLC. The concentrations of these nucleotides were calculated from the computer-integrated areas of the peaks in the sample chromatogram in relation to the areas obtained for standard solutions, as previously described by Maessen et al. (1988). Acyl-CoA dehydrogenase activity was measured in an isolated mitochondrial fraction according to the method described by Dommes et al. (1981). Acyl-CoA oxidase activity was measured in the 500× g supernatant fraction of liver homogenates as described previously (Ide et al., 1987). 16:0-CoA was used as a substrate for the acyl-CoA dehydrogenase and acyl-CoA oxidase assays. PDE activity in the cytosolic fraction and adenylate cyclase (AC) activity in the membrane fraction extracted from cultured hepatocytes were measured after the different treatments.
Real-time PCR
For the determination of mRNA expression levels of apoCIII, LPL, CD36/FAT, FATP, ACO, ACS and CPT-1 in liver, total RNA isolation (Chomczynski and Sacchi, 1987), cDNA synthesis and relative quantification of target gene mRNA compared with β-actin, a housekeeping gene, were performed as described previously (Duran-Sandoval et al., 2004; Achouri et al., 2005; Rong et al., 2010). The primers used here were purchased from ShineGene (Shanghai, China). PCR analysis of these target genes in liver was performed using the ΔΔCt method (Ringseis et al., 2007). Relative expression ratios are expressed as fold changes in the concentration of mRNA in the treated group compared with that in the normal group.
Immunoprecipitation and Western blot
Protein extracts were obtained from the cytoplasm and nucleus (Wang and Tong, 2009). The extracts (1 mg) were incubated with 5 µg of the following antibodies: anti-β-actin, anti-PPARα, anti-PPARγ and anti-RXRα (Santa Cruz). Immunocomplexes were precipitated with Protein G-Agarose, washed with buffer three times, boiled for 5 min and analysed by SDS-PAGE (Alwayn et al., 2006). Rabbit polyclonal IgG pre-bound to goat anti-rabbit IgG-Agarose (Sigma) was used as an input control. Proteins were visualized using enhanced chemiluminescence (Bio-Rad, Shanghai, China).
Ligand binding assays
The binding affinities of bilobetin to the ligand-binding domain (LBD) of PPARα and PPARγ were measured using the LanthaScreen PPARα and PolarScreen PPARγ Competitor Assay Kits (Invitrogen, Beijing, China) according to the manufacturer's instructions. Fenofibrate acid and pioglitazone (both from Sigma) were used as positive control compounds.
Cell transfection
Cells were seeded onto 12-well plate 12 h before transfection with one or more of the following expression plasmids (rats RXRα: pSG5-RXRα; rats PPARα: pSG5-PPARα; mutated rats PPARα: pSG5-S93APPARα, pSG5-T129APPARα, pSG5-S163APPARα, pSG5-T129AS163A; and human PKA-Cα: pSG5-PKA) and/or firefly luciferase reporter (pGL3-SV40-PPRE) in phenol red-free DMEM with 5% FBS using the calcium phosphate method (Jordan et al., 1996). Twenty-four hours after transfection, cells were treated with test compounds for specific durations (declared in corresponding experiments) in medium supplemented with 10% FBS. Luciferase assays were performed using the dual luciferase kit (Promega) following the manufacturer's instructions. Values were normalized for cell number and luciferase control (pRL-CMV). Each value represents the average of duplicate assays. All experiments were repeated three times. Expression plasmids and firefly luciferase reporter plasmid were obtained from Asia Bioscience, Taipei, Taiwan.
In vitro phosphorylation
The phosphorylation reaction was performed in phosphorylating buffer supplemented with 0.1 mmol·L−1 unlabelled ATP, 10 µCi [γ-32P]-ATP (Amersham), 1 U of catalytic subunit of PKA (PKA-Cα; Santa Cruz) in a 20 µL reaction mixture for 45 min at 25°C. In each reaction, either recombinant human PPARα protein (Abcam, Shanghai, China) (0.1 µg) or one of synthetic short PPARα peptide fragments (50 ng) was added. Phosphorylated proteins were detected by autoradiography after immunoprecipitation and the following SDS-PAGE.
EMSA
Double-stranded oligonucleotide (5′-CAAAACTAGGTCAAAGGTCA) was end-labelled with [γ-32P]-ATP by T4 polynucleotide kinase (Promega) (Gomez-Garre et al., 2006). Recombinant human PPARα protein (Abcam) or protein extracts were equilibrated with 1 µg of poly (dI–dC) in a binding buffer (5% glycerol, 1 mmol·L−1 dithiothreitol, 1 mmol·L−1 EDTA, 50 mmol·L−1 NaCl, 10 mmol·L−1 Tris, pH 7.5) for 30 min and then reacted with labelled probe for 20 min at room temperature. The reaction mixtures were electrophoresed on a 4% polyacrylamide gels and subjected to autoradiography. Competition assays were performed by adding 100-fold molar excess of unlabelled wild-type oligonucleotide.
Statistical analysis
Results are expressed as means ± SEM. The number of samples in the different groups is shown in the figures and tables. Significance of differences among data was analysed by one-way anova. Another statistical analysis among HFD, BIL4, BIL4M and BIL4H was performed in order to evaluate the potential inhibition of the effects of bilobetin by H89 or MK886. A value of P < 0.05 was considered statistically significant.
Results
Changes in physical parameters
As shown in Table 1, administration of bilobetin for 14 days did not affect body weight or the liver weight, and body weight gain during the entire experimental period, but significantly decreased the weight of visceral fat as a % of body weight gain (P < 0.05, P < 0.01). The finding that the percentage weight of liver increased (P < 0.01), but the actual liver weight did not change in the BIL14 group suggests that the altered weight ratio is mostly due to the decreased weight of visceral fat (P < 0.05). H89 diminish these effects of bilobetin (P < 0.01). The finding that the percentage mass of inguinal fat in the body did not change in the BIL14 group implies that s.c. fat is unaffected by bilobetin compared with visceral fat. The liver, fat and body mass were unchanged in the BIL4 group. The observation that all HFD-fed groups consumed the same daily amount of food helps to exclude the possibility that bilobetin reduced the mass of visceral fat by inhibiting feeding.
Changes in biochemical parameters
According to Table 2, the fasting blood glucose was comparable among all the groups. Bilobetin administration for 14 days (but not for 4 days) improved the effects of insulin, as shown by an elevation in the glucose infusion rate (GIR, P < 0.05) and a reduction in EGP (P < 0.05) in basal and clamp states compared with HFD rats. This beneficial effect of bilobetin was associated with a marked reduction in the plasma insulin level (P < 0.05). The concentrations of total TG (P < 0.01) and VLDL-TG (P < 0.01) in BIL14 rats (but not in BIL4 rats) were lower than those of the HFD group, indicating that bilobetin, when administered for 14 days, has a hypolipidaemic effect. Bilobetin had no effect on the plasma levels of IDL/LDL-TG, HDL-TG, VLDL-apoB-48, VLDL-apoB-100, HDL-apoA-1 and NEFA. H89 plus bilobetin treatment for 14 days prevented the hypolipidaemic and insulin-sensitizing effects of bilobetin. Treatments with bilobetin for 4 days had no effect on the pathogenic induced changes in GIR, blood insulin, EGP and blood lipids, which indicates that these alterations may be time-dependent. Plasma activities of AST and ALT were employed to evaluate the liver toxicity of bilobetin. The negative results indicate that a 14 day treatment with bilobetin does not have a toxic effect on rat liver.
Modifications of Intralipid-TG and VLDL-TG kinetics
Bilobetin can attenuate the levels of total TG and VLDL-TG in the circulation. Here, its ability to change the kinetics of both exogenous and endogenous TG was examined. Rats administered bilobetin for either 14 or 4 days showed a significant enhancement of hepatic Intralipid-TG uptake (Figure 1A, P < 0.01). Decrements in Intralipid-TG uptake by RQ (P < 0.01) and mWAT (P < 0.01) were only apparent in the 14 day-treated rats (Figure S1A and B). The systemic Intralipid-TG clearance rate (Figure 1B, P < 0.01, P < 0.05) was substantially increased, while the VLDL-TG production rate (Figure 1C, P < 0.01) was significantly lessened in both the BIL14 and BIL4 group. The clearance rate of VLDL-TG was elevated by the 14 day bilobetin treatment (Figure 1D, P < 0.01). Changes in the 4 day bilobetin treatment group could be prevented by pretreatment with either MK886 or H89. In this regard, we observed an increase in hepatic TG uptake after the 4 day treatment; however, the decrease in TG uptake by RQ and mWAT were only noticed 10 days later. Also, most of the Intralipid-TG was taken up by liver. This demonstrates that Intralipid-TG was redistributed among the tissues, and the primary effect organ is the liver. It also indicates that the decline in TG uptake by RQ and mWAT resulted from the decreased blood TG level. The attenuated hepatic VLDL-TG production rate and enhanced VLDL-TG clearance rate may contribute to this reduced blood TG level.
Figure 1.
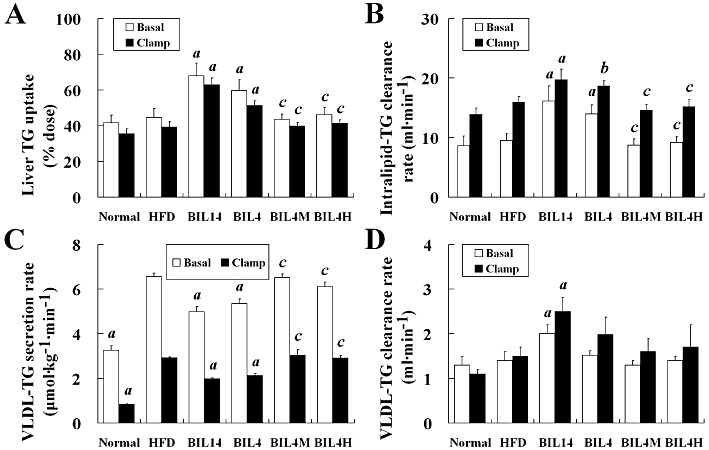
Effects of bilobetin on TG dynamics in rats. The uptake of Intralipid-TG by liver (A) in overnight-fasted (basal) or euglycaemic–hyperinsulinaemic clamp (clamp) rats; (B) the systemic Intralipid-TG clearance in basal or clamp rats; The rates of VLDL-TG secretion (C) and VLDL-TG clearance (D) in basal or clamp rats. Normal, standard diet; HFD, high-fat diet; BIL14, HFD + 14 day bilobetin treatment; BIL4, HFD + 4 day bilobetin treatment; BIL4M, BIL4 rats treated with PPARα inhibitor (MK886); BIL4H, BIL4 rats treated with PKA inhibitor (H89). Data are means ± SEM. n= 6. aP < 0.01, bP < 0.05 versus HFD group; cP < 0.01 versus BIL4 group (anova).
Modifications of NEFA kinetics
White adipose tissues (WAT) are the main fat reservoir. They release NEFA by hydrolysis of TG stored in both the adipocytes and lipoprotein that pass through the capillaries of this organ. The released NEFA constitutes another major source of lipid for liver and muscle. So it was necessary to evaluate the kinetics of uptake and storage of NEFA in liver, muscle and WAT. Hepatic NEFA uptake was significantly elevated in BIL14 and BIL4 compared with that of the HFD group (Figure 2A, P < 0.01, P < 0.05). Interestingly, the stimulation of hepatic NEFA uptake in the BIL14 and BIL4 groups was accompanied by a reduction in the NEFA stored in the liver (Figure 2B, P < 0.01, P < 0.05). Bilobetin did not affect NEFA uptake and NEFA storage in RQ and mWAT (Figure S2A and B; P > 0.05). Both MK886 and H89 prevented the effects of 4 day bilobetin administration on NEFA uptake and storage in the liver.
Figure 2.
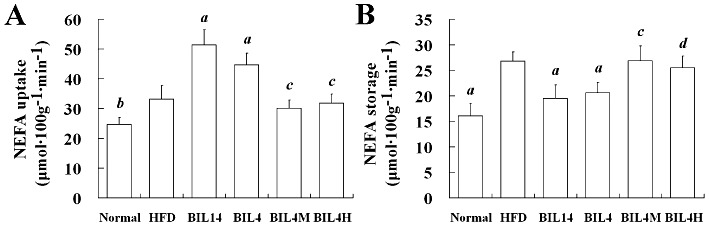
Effects of bilobetin on rates of uptake (A) and storage (B) of NEFA by liver in rats. Normal, standard diet; HFD, high-fat diet; BIL14, HFD + 14 day bilobetin treatment; BIL4, HFD + 4 day bilobetin treatment; BIL4M, BIL4 rats treated with PPARα inhibitor (MK886); BIL4H, BIL4 rats treated with PKA inhibitor (H89). Data are means ± SEM. n= 6. aP < 0.01, bP < 0.05 versus HFD group; cP < 0.01, dP < 0.05 versus BIL4 group (anova).
Effect of bilobetin on tissue lipid levels
Having observed that bilobetin increased the hepatic uptake of TG and NEFA, we wanted to check if there was a corresponding lipid accumulation in tissues. Therefore, we quantified lipids and some of their derivatives in both liver and muscle. Except for the hepatic LCACoA level (Figure 3G), which was not altered in the HFD group, the contents of TG, DAG, LCACoA and NEFA in RQ (Figure 3A–D, P < 0.01) and the contents of TG, DAG and NEFA in liver (Figure 3E, F and H, P < 0.01) were significantly increased in the HFD group. Bilobetin treatment for 14 days attenuated TG, DAG, LCACoA and NEFA in RQ (Figure 3A–D, P < 0.01). In the liver, the elevated accumulations of TG and DAG in the HFD group were reduced in the BIL14 group (Figure 3E and F, P < 0.01). In contrast to the effects on RQ, bilobetin increased the hepatic contents of LCACoA (Figure 3G, P < 0.01) and NEFA (Figure 3H, P < 0.01) in BIL14 rats. The hepatic NEFA was increased by treatment with bilobetin for 4 days (Figure 3H, P < 0.01), whereas it had no effect on hepatic TG, DAG and LCACoA levels. The PKA inhibitor, H89, administered as a co-treatment with bilobetin for 14 days, prevented the lipid-lowering effect of bilobetin. Although we observed increased hepatic LCACoA level after bilobetin treatment, bilobetin reduced the total amount of lipid accumulating in the liver and muscle. The increased hepatic LCACoA might result from an expanded peroxisome population as shown by elevated ACO expression (Martin et al., 1997).
Effect of bilobetin on tissue enzyme activity
In the liver, bilobetin treatment stimulates lipid uptake but substantially reduces lipid accumulation. Therefore, the effect of bilobetin on NEFA catabolism was evaluated. In BIL14 and BIL4 groups, the activities of CPT-1 (Figure 4A, P < 0.01, P < 0.05) and acyl-CoA dehydrogenase (Figure 4B, P < 0.01) in hepatic mitochondria and acyl-CoA oxidase activity (Figure 4C, P < 0.01, P < 0.05) in liver homogenate were significantly higher than those of the HFD group. Meanwhile we also observed significantly stimulated palmitate oxidation (Figure 4D, P < 0.01) and ATP production (Figure 4E, P < 0.01, P < 0.05) in both the BIL14 and BIL4 groups. Significant elevations in hepatic LPL activity were noticed in the BIL14 and BIL4 groups compared with the HFD group (Figure 4F, P < 0.01). MK886 or H89 pretreatment prevented the effects of bilobetin on the activities of LPL and the enzymes involved in NEFA oxidation, the rates of NEFA oxidation, and the cellular ATP levels. Activities of enzymes, NEFA oxidation rates, and ATP production in RQ and/or mWAT did not appear to be influenced by bilobetin. The cAMP levels (Figure 4G, P < 0.01) and PKA activities (Figure 4H, P < 0.01) measured in livers from BIL14, BIL4 and BIL4M groups were higher than values determined in the HFD group. Although BIL4H rats showed elevated hepatic cAMP levels compared with that of the HFD group, its hepatic PKA activity was inhibited by H89. Bilobetin had no effect on cAMP levels and PKA activities in RQ and mWAT.
Figure 4.
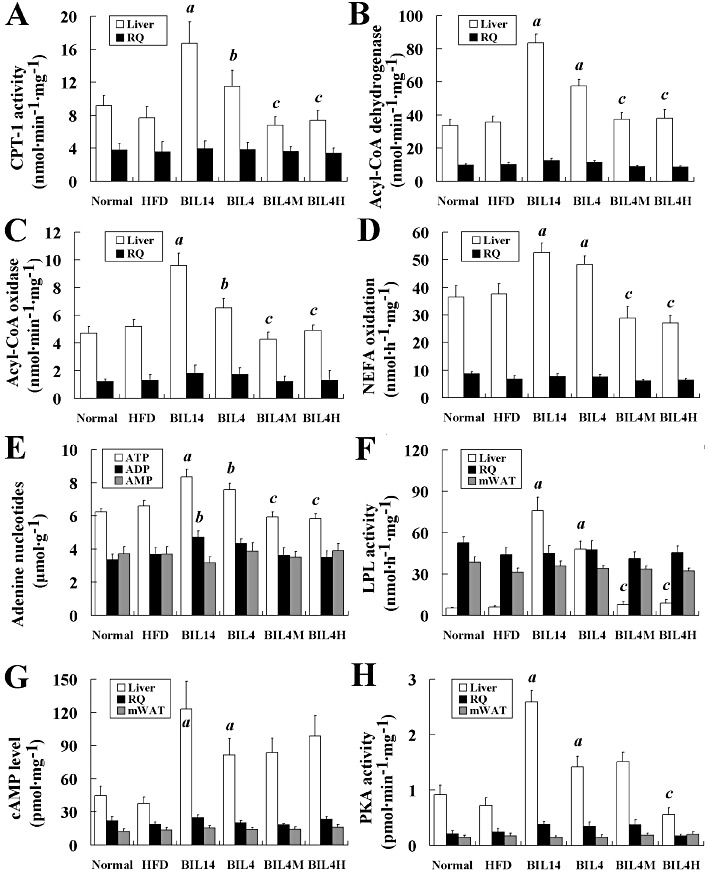
Effects of bilobetin on activities of CPT-1 (A), acyl-CoA dehydrogenase (B) and acyl-CoA oxidase (C) in rats' liver. (D) Effects of bilobetin on NEFA oxidation in liver and RQ of rats. (E) Effects of bilobetin on contents of adenine nucleotides in rats' liver. Effects of bilobetin on LPL activity (F), cAMP level (G) and PKA activity (H) in rats' liver, RQ and mWAT. Normal, standard diet; HFD, high-fat diet; BIL14, HFD + 14 day bilobetin treatment; BIL4, HFD + 4 day bilobetin treatment; BIL4M, BIL4 rats treated with PPARα inhibitor (MK886); BIL4H, BIL4 rats treated with PKA inhibitor (H89). Data are means ± SEM. n= 6. aP < 0.01, bP < 0.05 versus HFD group; cP < 0.01 versus BIL4 group (anova).
Bilobetin stimulates the expression and nuclear translocation of PPARα in rats' liver
Bilobetin exhibits its hypolipidaemic effect by stimulating hepatic uptake and catabolism of lipids, and a PPARα inhibitor can prevent these effects. To further confirm whether PPARα is indeed involved in the actions of bilobetin, we observed the effects of bilobetin on the phosphorylation, translocation and expression of PPARα, and the transcription of some PPARα-regulated genes in vivo. Bilobetin treatment for 14 days not only promoted the phosphorylation of PPARα and the translocation of PPARα from the cytoplasm to the nucleus (Figure 5A and B, P < 0.01) but also enhanced its expression in liver (Figure 5A, P < 0.01). The enhanced phosphorylation and translocation was also observed in the BIL4 group (Figure 5A and B, P < 0.01). The effects of bilobetin on PPARα were inhibited by MK886 and H89 pretreatment (Figure 5A and B; P < 0.01). The up-regulation of the expression of PPARα seems to be a result of PPARα translocation. Firstly, PPARα promoter region contains PPRE, the binding of the PPARα : RXRα heterodimer to PPRE may stimulate PPARα expression. Secondly, we observed that the increased expression of PPARα (observed after 14 day treatment with bilobetin) appearred later than the PPARα translocation to the nucleus (observed after 4 day treatment with bilobetin) in intact rats. Also, the finding that the selective PPARα inhibitor, MK886, inhibited the up-regulated expression of PPARα supports our assumption. The nuclear translocation and expression of PPARα in RQ (Figure S3A), PPARα in mWAT (Figure S3B) and RXRα in liver (Figure S3C) appeared not to be influenced by bilobetin treatment.
Figure 5.
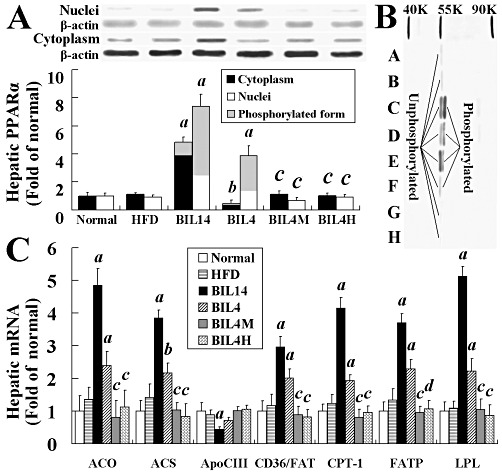
Effects of bilobetin on phosphorylation, nuclear translocation and expression of hepatic PPARα in rats (A). Western blot analysis of control and treatment groups with cytosolic and/or nuclear fractions (B). A, cytoplasm of normal; B, cytoplasm of HFD; C, nuclei of BIL14; D, cytoplasm of BIL14; E, nuclei of BIL4; F, cytoplasm of BIL4; G, cytoplasm of BIL4M; H, cytoplasm of BIL4H. Effects of bilobetin on the amount of mRNA from PPARα-regulated genes in the liver (C). Relative expression ratios are expressed as fold changes of protein or mRNA content compared with normal group. Normal, standard diet; HFD, high-fat diet; BIL14, HFD + 14 day bilobetin treatment; BIL4, HFD + 4 day bilobetin treatment; BIL4M, BIL4 rats treated with PPARα inhibitor (MK886); BIL4H, BIL4 rats treated with PKA inhibitor (H89). Data are means ± SEM. n= 6. aP < 0.01, bP < 0.05 versus HFD group; cP < 0.01, dP < 0.05 versus BIL4 group (anova).
Bilobetin stimulates hepatic gene transcription
In contrast to the HFD group, relative mRNA levels of ACO, ACS, apoCIII, CD36/FAT, CPT-1, FATP and LPL in livers from BIL14 and BIL4 rats were altered (apoCIII mRNA decreased, others increased) significantly (P < 0.05; P < 0.01) as shown in Figure 5C. Both MK886 and H89 significantly inhibited the changes in gene transcription induced by bilobetin, and thus restored the mRNA levels of the BIL14 and BIL4 groups to those of the HFD group.
Affinity of bilobetin for PPARs
It is interesting that bilobetin can activate PPARα. However, we do not yet know whether bilobetin can act as a ligand for PPAR. As shown in the ligand binding assays, bilobetin weakly bound to PPARα-LBD and PPARγ-LBD. Fenofibrate acid and pioglitazone were found to dose-dependently bind to PPARα- and PPARγ-LBD, respectively, demonstrating that bilobetin is neither a PPARα ligand nor a PPARγ ligand (see Figure S4A and B in ‘Supporting Information’).
Effects of bilobetin on PKA and PPARα activation in cell cultures
We concluded that bilobetin does not act as a ligand for either PPARα or PPARγ. Thereafter, we studied the phosphorylation of PPARα after bilobetin treatment in cell cultures. The intracellular cAMP level and PKA activity transiently increased and then dropped to normal levels within 4 h after the treatment of cultured cells with bilobetin alone (Figure S5A and B). This may be due to the relatively low production of cAMP in cells receiving no stimulation. Hence, we pre-incubated these cells with 1 µmol·L−1 forskolin. This concentration of forskolin can increase both the cAMP level and PKA activity but has no effect on PPARα phosphorylation (not shown). The combination of bilobetin and forskolin significantly increased not only the cAMP level and PKA activity but also PPARα phosphorylation. Bilobetin significantly inhibited PDE activity in cytoplasm in a dose-dependent manner (Figure 6A), but had no effect on AC activity (Figure S5E). The area under the curve (AUC) of intracellular cAMP level (Figure 6B) and the AUC of PKA activity (Figure 6B) significantly increased after bilobetin plus forskolin treatment. The time-dependent changes in the cAMP level and PKA activity are shown in Figure S5A and B. Significant phosphorylation and nuclear translocation of PPARα (Figure 6C and D, P < 0.01) were observed 3 h after the maximum increase in PKA activity. The amount of phosphorylated PPARα was increased significantly in both the cytoplasm and nucleus. The nuclear content of PPARα was mainly elevated, but its distribution in cytoplasm was reduced. We also observed that bilobetin induced an up-regulation in the cAMP level (Figure S5C), PKA activity (Figure S5D), PPARα phosphorylation and its nuclear translocation (Figure 6E and F) in a dose-dependent manner (10−7–10−4 mol·L−1). H89 (5 µmol·L−1) but not MK886 (5 µmol·L−1) pretreatment significantly reduced the PKA activity in cells treated with bilobetin; both H89 and MK886 restored the phosphorylation and translocation of PPARα to control levels. Significantly elevated luciferase activities in primary hepatocytes and pSG5-rPPARα and pSG5-rRXRα transfected HEK293 cells were induced by forskolin + bilobetin or pSG5-hPKA-Cα transfection (Figure 6G, P < 0.01).
Figure 6.
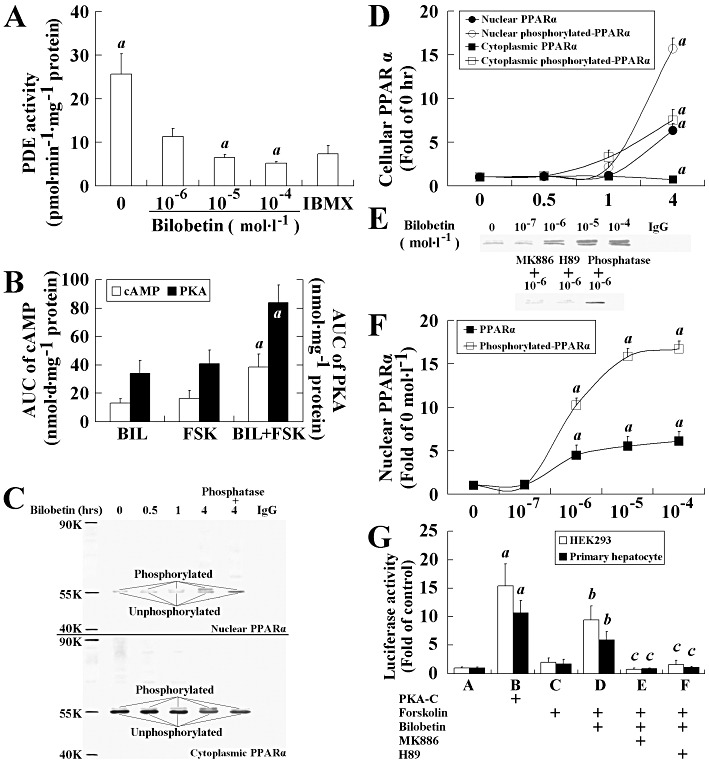
Effects of bilobetin on PKA pathway and PPARα activation. (A) PDE activity. IBMX (25 µmol·L−1). Data are means ± SEM, n= 6. aP < 0.01 versus 10−6 mol·L−1 bilobetin-treated cells. (B) AUC of cAMP level and PKA activity. Data are means ± SEM, n= 6. aP < 0.01 versus 1 µmol·L−1 forskolin-treated cells. (C, E) Western blot analysis of control and treatment groups with cytosolic and nuclear fractions. Phosphorylation and translocation of PPARα to nuclei in time- (D) and dose- (F) dependent manner. Data are means ± SEM, n= 6. aP < 0.01 versus control. In (D), the hepatocytes were incubated with forskolin plus bilobetin (both 1 µm ol·L−1) for 0, 0.5, 1 and 4 h, and then PPARα phosphorylation and distribution of PPARα between cytoplasm and nucleus were measured. In (F), the hepatocytes were incubated with forskolin (1 µmol·L−1) plus bilobetin (0, 10−7, 10−6, 10−5, 10−4 mol·L−1) for 4 h, and then nuclear contents of PPARα and its phosphorylated form were measured. Some of cultures were also treated with PKA inhibitor (H89, 5 µmol·L−1) or PPARα inhibitor (MK886, 5 µmol·L−1) to observe its effects on the cells. Both input control and loading controls (not shown) were used for calculation. Some phosphorylated proteins were dephosphorylated by calf alkaline phosphatase to indicate the real phosphorylation. (G) Luciferase activity. The PPARα activity was determined by measuring luciferase activity in reporter plasmid (0.5 µg pGL3-SV40-3PPRE with 0.01 µg pRL-CMV as control) transfected HEK293 cells and primary hepatocytes. HEK293 cells were also transfected with 0.1 µg pSG5-PPARα and 0.1 µg pSG5-RXRα plasmids. Twenty-four hours after transfection, cells were treated with forskolin (1 µmol·L−1) or forskolin plus bilobetin (both 1 µmol·L−1) for 4 h. Some cells were also treated with PKA inhibitor (H89, 5 µmol·L−1) or PPARα inhibitor (MK886, 5 µmol·L−1) to observe its effects on the cells. Data are means ± SEM, n= 3. aP < 0.01 versus A group; bP < 0.01 versus C group, cP < 0.01 versus D group.
PKA directly phosphorylates PPARα and stimulates its PPRE binding
Purified PPARα protein (plus purified RXRα) exhibited moderate binding activity to PPRE in vitro (Figure 7A, lane 7). When PKA-Cα was introduced, the binding activity of PPARα : RXRα to PPRE enhanced significantly (Figure 7A, lane 8). PPARα was then incubated with PKA-Cα in the presence of [γ-32P]-ATP to investigate whether PPARα could be directly phosphorylated by PKA-Cα. As shown in Figure 7B, PKA-Cα directly phosphorylated PPARα, and phosphatase reversed this phosphorylation.
Figure 7.
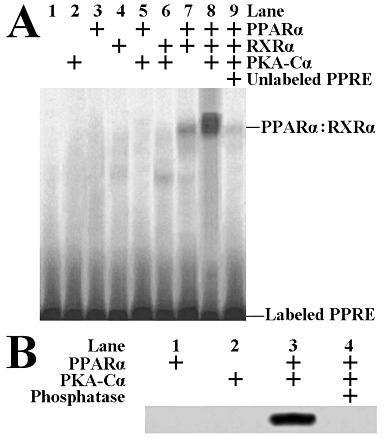
EMSA for measuring the altered binding of PPARα : RXRα to PPRE with or without PKA-Cα treatment (A). PPARα could be directly phosphorylated by PKA-Cαin vitro (B).
Threonine-129 (Thr129) and/or serine-163 (Ser163) of PPARα is phosphorylated by PKA
To identify the locations of the amino acid residues of PPARα that are phosphorylated by PKA, we synthesized two short peptides with the sequences identical to their counterparts in wild-type rat PPARα (Thr129 peptide: KGFFRR[Thr129]IRLKLA and Ser163 peptide: RFHKCL[Ser163]VGMSHN) and another two of their alanine mutants (Thr129A and Ser163A peptides). We studied the phosphorylation of these peptides and found that Thr129 and Ser163 peptides exhibited strong phosphorylation (Figure 8A), while Thr129A and Ser163A peptides were not phosphorylated by PKA-Cα (Figure 8B). We also evaluated the phosphorylation on PPARα and their mutants in HEK293 cells. In contrast to control mutation of Ser93 to alanine (used as control, because the Ser93 residue in TDE[Ser93]PGNA sequence is not phosphorylated by PKA), Thr129A, Ser163A and Thr129A + Ser163A mutated PPARα expression plasmids transfected cells exhibited weak phosphorylation and nuclear translocation of PPARα (Figure 8C). The binding activity of PPARα to PPRE (Figure 8D) and luciferase activity of PPRE-containing reporter (Figure 8E) was reduced significantly in HEK293 cells transfected with Thr129A and/or Ser163A mutants, although these cells were treated with forskolin + bilobetin or transfected with pSG5-hPKA-Cα expression plasmid. In Figure 8E, mutations on Thr129A and/or Ser163A had some influence on fenofibrate acid-stimulated luciferase activity but did not inhibit it completely, indicating that Thr129 and Ser163 of PPARα might be key components in phosphorylation-mediated transcriptional activity, with only minor importance in the ligand-mediated transcriptional activity in which phosphorylation might be involved (Lazennec et al., 2000).
Figure 8.
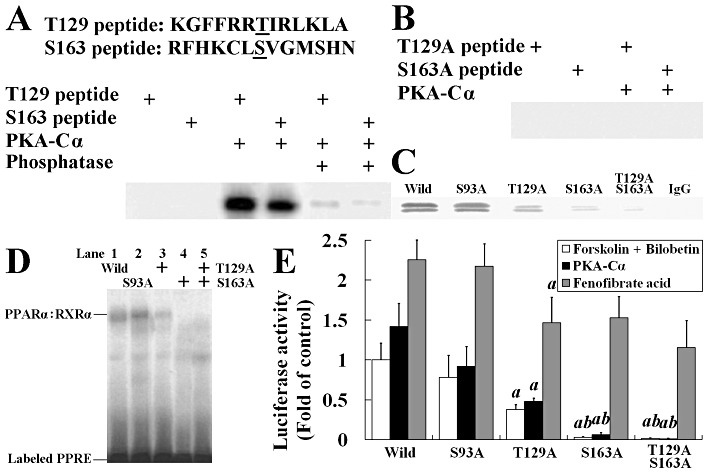
Threonine-129 (T129) and serine-163 (S163) of PPARα are phosphorylated by PKA. (A) Two synthetic peptides containing residues 123 through 135 and 157 through 169 of PPARα were phosphorylated by using 1 U of PKA-Cα in the presence of [γ-32P]-ATP. Some phosphorylated proteins were dephosphorylated by calf alkaline phosphatase to indicate the covalent binding of 32P to threonine or serine. (B) The mutated short peptides with their PKA phosphorylation sites replaced by alanine were incubated with PKA and [γ-32P]-ATP in phosphorylation buffer. (C) Western blot of immunoprecipitated nuclear PPARα from wild or mutated PPARα expression plasmid transfected HEK293 cells. (D) EMSA using extracts from wild-type or mutated PPARα expression plasmid transfected HEK293 cells. The PPRE bindings were observed in wild-type, Ser93A and Thr129A, but not in Ser163A and Thr129A/Ser163A cells. (E) Luciferase activity in HEK293 cells transfected with reporter plasmid (0.5 µg pGL3-SV40-3PPRE with 0.01 µg pRL-CMV as control) and either wild-type or mutated PPARα expression plasmid (0.1 µg) and 0.1 µg pSG5-RXRα plasmids. Cells were treated with forskolin + bilobetin (both 1 µmol·L−1) or fenofibrate acid (1 µmol·L−1) for 4 h. Data are means ± SEM. n= 3. aP < 0.01 versus pSG5-Ser93APPARα transfected cells, bP < 0.01 versus pSG5-Thr129APPARα-transfected cells (anova).
Discussion
In this study, we have shown that bilobetin can ameliorate hyperlipidaemia and insulin resistance, and these effects may result from PPARα activation. In contrast to previous studies (Motojima et al., 1998; Srivastava et al., 2006), we have provided a series of proofs to exhibit that the administration of bilobetin, which stimulates PPARα activity by PKA-mediated phosphorylation on this nuclear receptor without adding exogenous PPARα ligand, produces obvious pharmacological effects on rats suffering from insulin resistance. We also employed site-directed mutagenesis to reveal that the Thr129 and/or Ser163 of PPARα are phosphorylated after PKA activation resulting from bilobetin-mediated PDE inhibition.
Our results revealed that treating rats on a HFD with bilobetin for 14 days activated hepatic PPARα, up-regulated lipid metabolism-related genes in the liver, improved the lipid profiles in both blood and tissues, reduced lipid accumulation in tissues and also ameliorated insulin resistance. These effects were accompanied by elevations in the cAMP level and PKA activity in the liver. Although we did not calculate the IC50 of bilobetin to inhibit a purified isoform of PDE, we did show that bilobetin significantly inhibits total PDE activity in hepatic cytoplasm; whereas it had no effect on adenylate cyclase activity. More importantly, the intracellular cAMP level and PKA activity could be elevated by bilobetin in a time- and dose-dependent manner. Therefore, we can reasonably conclude that bilobetin regulates PKA signalling pathway by interfering with PDE-mediated cAMP breakdown.
Although the lipid profiles in plasma and tissues were improved by the 4 day treatment with bilobetin, the insulin resistance was not ameliorated by this short-term treatment, but it stimulated hepatic uptake of NEFA and TG, and repressed VLDL-TG secretion. The elevated hepatic NEFA uptake was followed by increased NEFA oxidation and ATP production. These observations suggest that the initial effects of bilobetin may induce changes in both the distribution of lipids and their metabolic pathways. Regardless of the fate of NEFA in distinct tissue types, NEFA transport across the cell membrane (mediated by FATP and FAT/CD36) and its activation into a fatty acyl-CoA (mediated by ACS) are required for further utilization (Martin et al., 1997; Motojima et al., 1998), and both can be regulated by PPARα (Rong et al., 2010). LPL, the key enzyme for hydrolyzing TGs in lipoproteins, is also involved in the cellular uptake of lipids. Although LPL is normally not made in adult liver, PPAR activators may restore its expression (Applebaum-Bowden, 1995). Changes in LPL activity in different tissues determine not only the plasma TG levels but also the uptake of TG by these tissues. Our data show that 4 or 14 day bilobetin treatment up-regulates the transcription of FATP, FAT/CD36, ACS and LPL genes, and elevates the activities of LPL and several other enzymes involved in hepatic β-oxidation but has no effect on their activities in muscle and adipose, suggesting that the primary target of bilobetin is the liver. This selective action of bilobetin on distinct tissue types might be explained partly by its unique pharmacokinetic attributes (unpublished; see ‘Supporting Information’).
In previously published articles, selective PPARα ligands have been shown to ameliorate insulin resistance, and their beneficial effects were dependent on their lipid-lowering properties (Schwarz et al., 2003; Li et al., 2006; Rong et al., 2010). Multiple factors may lead to the condition of insulin resistance. Several studies performed in obese individuals or animals (Oakes et al., 1999; Schwarz et al., 2003) have demonstrated a correlation between the amounts of ectopic lipid stores found in muscle and muscle insulin resistance, known as lipotoxicity (Oakes et al., 1999). This association is further supported by additional studies in healthy humans (Taube et al., 2009). Other studies have demonstrated that TG metabolites, such as DAG and LCACoA, are also involved in this reduced insulin sensitivity in various tissues (Hosokawa et al., 1989; Chavez and Summers, 2005). In our study, pretreatment with a PKA inhibitor completely prevented the beneficial effects of 14 day bilobetin administration on the lipid profile and insulin resistance, and failed to decrease the metabolites that interfere with insulin signal transduction in tissues. The PPARα inhibitor and PKA inhibitor also inhibited the effects of bilobetin on both lipid kinetics and expression of PPARα-regulated lipid-lowering-enzymes. Collectively, PKA and PPARα are essential for the bilobetin-mediated improvement in insulin sensitivity. We have demonstrated here that bilobetin is neither a PPARα nor a PPARγ ligand; and PKA can phosphorylate PPARα directly. So it is reasonable to deduce that bilobetin regulates PPARα activity by PKA-mediated phosphorylation of this receptor.
To further clarify the mechanism by which bilobetin activates PPARα, we studied the effects of bilobetin on phosphorylation, nuclear translocation, PPRE binding of PPARα and its transcriptional activity on PPRE-containing reporter. Bilobetin elevated both cellular cAMP level and PKA activity in a time- and dose-dependent manner. The elevations were followed by a increased phosphorylation on PPARα and its nuclear translocation. In a previous study (Lazennec et al., 2000), the PPARα phosphorylation by PKA was limited not only by the cell model selected, but also by the failure to reveal the exact phosphorylation sites of PKA. HEK293 cells do not express PPARα and behave differently from normal hepatocytes. In this study, we used two types of cell to evaluate the phosphorylation by PKA on both wild-type and mutated PPARα, and the subsequent changes in biological effect. In agreement with others, we found that the phosphorylation sites (Thr129 and Ser163) are mapped into DNA-binding domain (DBD) of PPARα. We further revealed that mutation on the Ser163 residue (Ser163A) has a more significant effect on PPARα activity than the Thr129A mutant. To explain this mechanism, the three-dimensional structure of the PPARα protein may provide the strongest evidence. However, it has not yet been solved; some of its properties can only be inferred from biochemical studies and structural analysis of RAR : RXRα and PPARα : RXRα (Gray et al., 2005; Chandra et al., 2008) because of their sequence conservation. The α-helix (E120-R131) immediately after the first zinc finger structure directly associates with the AGGTCA sequence through hydrogen-bonding (Gray et al., 2005). The Thr129 residue is mapped into this α-helix and its mutation might influence protein-DNA binding capability (Gray et al., 2005). Another α-helix (Q154-G165) near the second zinc finger joins N151 and the hinge domain (Chandra et al., 2008). The PPARα hinge region may engage in an extensive DNA interaction, binding upstream of the AAACT motif. N151 (PPARα-N160) is predicted to interact with Q206 and R209 of RXRα in addition to PPARα's major RXRα interacting region in LBD. Changes in this region (e.g. Ser163A) might alter the interactions not only between DNA and the PPARα hinge domain but also between PPARα and RXRα. However, these assumptions should be subjected to intensive research.
Enzymes regulated by PPARα in rats and humans are different. In this study, we observed no changes in HDL-apoA-1 expression, which was caused by the lack of PPRE in the promoter of the Apoa1 gene in rodents. The human Apoa1 gene contains PPRE, so a PPARα activator could significantly increase the expression of HDL-apoA-1 in humans. This species difference in pharmacodynamics should be noted in future research.
In conclusion, bilobetin, a purified active component from a traditional drug, ameliorates hyperlipidaemia and improves insulin sensitivity in non-genetic rat models of insulin resistance induced by HFD, at least in part by phosphorylation of Thr129 and/or Ser163 of PPARα in the liver. Subsequently, PPARα activation leads to the changes in gene expression and biochemical processes and results in an enhanced uptake and oxidation of lipids by the liver. These changes influence the partition of NEFA and TG among several tissues. As a result, the accumulation of detrimental lipid metabolites in the liver and muscle are removed, and insulin sensitivity is restored in these tissues.
Glossary
- ACO
acyl CoA oxidase
- ACS
acyl CoA synthetase
- Apo
apolipoprotein
- CD36/FAT
CD36/fatty acid translocase
- CPT-1
carnitine palmitoyl transferase-1
- DAG
diacyl glycerol
- FATP
fatty acid transport protein
- HDL
high-density lipoprotein
- HFD
high-fat diet
- IDL
intermediate-density lipoprotein
- LCACoA
long-chain acyl CoA
- LDL
low-density lipoprotein
- LPL
lipoprotein lipase
- mWAT
mesenteric white adipose tissue
- NEFA
non-esterified fatty acid
- RQ
red quadriceps
- TG
triglyceride
- VLDL
very low density lipoprotein
Conflict of interest
The authors state no conflict of interest.
Supporting information
Additional Supporting Information may be found in the online version of this article:
Figure S1 Effects of bilobetin on TG dynamics in rats. The uptake of Intralipid-TG by RQ (A) and mWAT (B) in overnight-fasted (basal) or euglycaemic–hyperinsulinaemic clamp (clamp) rats. Normal, standard diet; HFD, high-fat diet; BIL14, HFD + 14 day bilobetin treatment; BIL4, HFD + 4 day bilobetin treatment; BIL4M, BIL4 rats treated with PPARα inhibitor (MK886); BIL4H, BIL4 rats treated with PKA inhibitor (H89). Data are means ± SE. n = 6.aP < 0.01 versus HFD group (ANOVA).
Figure S2 Effects of bilobetin on rates of uptake (A) and storage (B) of NEFA by mWAT and RQ in rats. Normal, standard diet; HFD, high-fat diet; BIL14, HFD + 14 day bilobetin treatment; BIL4, HFD + 4 day bilobetin treatment; BIL4M, BIL4 rats treated with PPARα inhibitor (MK886); BIL4H, BIL4 rats treated with PKA inhibitor (H89). Data are means ± SE. n = 6. aP < 0.01 versus HFD group (ANOVA).
Figure S3 Effects of bilobetin on expression of PPARα in RQ (A), PPARγ in mWAT (B) and RXRα inliver (C). Relative expression ratios are expressed as fold changes of protein content compared with normal group. Normal, standard diet; HFD, high-fat diet; BIL14, HFD + 14 day bilobetin treatment; BIL4, HFD + 4 day bilobetin treatment; BIL4M, BIL4 rats treated with PPARα inhibitor (MK886); BIL4H, BIL4 rats treated with PKA inhibitor (H89). Data are means ± SE. n = 6.
Figure S4 (A) Competitive binding curve of bilobetin (blue) and fenofibrate acid (purple) to PPARα ligand binding domain. Values are expressed as the 520 nm/495 nm emission ratio at a series of concentrations (1 nmol·L−1–1mmol·L−1) of bilobetin. (B) Competitive binding curve of bilobetin (blue) and pioglitazone (purple) to PPARγ ligand binding domain. Values are expressed as the polarization values (mP) at a series of concentrations (1 nmol·L−1–1 mmol·L−1) of bilobetin. Values are means ± SE. n = 3.
Figure S5 Effects of bilobetin on cAMP level, PKA activity and AC activity. Cells were incubated with bilobetin (1 μmol·L−1) or forskolin (1 μmol·L−1) or forskolin plus bilobetin (each 1 μmol·L−1) for 0, 0.5, 1, 4, 12 and 24 h, and then the intracellular cAMP level (A) and PKA activity (B) were determined in cytoplasm. Data are means ± SE, n = 6. aP < 0.01 versus 0 h of corresponding group; bP < 0.01 versus corresponding time point of forskolin group (ANOVA). In another experiment, hepatocytes were incubated with forskolin (1 μmol·L−1) plus bilobetin (0, 10−7, 10−6, 10−5, 10−4 mol·L−1) for 1 h, and then the changes of cAMP level (C) and PKA activity (D) in cytoplasm were measured. Data are means ± SE, n = 6. aP <0.01 versus forskolin (1 μmol·L−1)-treated cells. (E) AC activity. Data are means ± SE, n = 6. aP < 0.01 versus 10−6 mol·L−1 bilobetin-treated cells.
Please note: Wiley-Blackwell are not responsible for the content or functionality of any supporting materials supplied by the authors. Any queries (other than missing material) should be directed to the corresponding author for the article.
References
- Achouri Y, Hegarty BD, Allanic D. Long chain fatty acyl CoA synthetase 5 expression is induced by insulin and glucose: involvement of sterol regulatory element-binding protein-1c. Biochimie. 2005;87:1149–1155. doi: 10.1016/j.biochi.2005.04.015. [DOI] [PubMed] [Google Scholar]
- Adiels M, Olofsson SO, Taskinen MR, Boren J. Diabetic dyslipidaemia. Curr Opin Lipidol. 2006;17:238–246. doi: 10.1097/01.mol.0000226115.97436.c0. [DOI] [PubMed] [Google Scholar]
- Alwayn I, Andersson C, Lee S, Arsenault DA, Bistrian BR, Gura KM, et al. Inhibition of matrix metalloproteinases increases PPAR-α and IL-6 and prevents dietary-induced hepatic steatosis and injury in a murine model. Am J Physiol Gastrointest Liver Physiol. 2006;291:G1011–G1019. doi: 10.1152/ajpgi.00047.2006. [DOI] [PubMed] [Google Scholar]
- Applebaum-Bowden D. Lipases and lecithin: cholesterol acyltransferase in the control of lipoprotein metabolism. Curr Opin Lipidol. 1995;6:130–135. doi: 10.1097/00041433-199506000-00004. [DOI] [PubMed] [Google Scholar]
- Beylot M, Previs SF, David F, Brunengraber H. Determination of the 13C-labeling pattern of glucose by gas chromatography-mass spectrometry. Anal Biochem. 1993;212:526–531. doi: 10.1006/abio.1993.1363. [DOI] [PubMed] [Google Scholar]
- Bieber LL, Abraham T, Helmarath T. A rapid spectrophotometric assay for carnitine palmitoyltransferase. Anal Biochem. 1972;50:509–518. doi: 10.1016/0003-2697(72)90061-9. [DOI] [PubMed] [Google Scholar]
- Burns KA, Vanden-Heuvel JP. Modulation of PPAR activity via phosphorylation. Biochim Biophys Acta. 2007;1771:952–960. doi: 10.1016/j.bbalip.2007.04.018. [DOI] [PMC free article] [PubMed] [Google Scholar]
- Chandra V, Huang PX, Hamuro Y, Raghuram S, Wang YJ, Burris TP, et al. Structure of the intact PPAR-γ–RXR-α nuclear receptor complex on DNA. Nature. 2008;456:350–356. doi: 10.1038/nature07413. [DOI] [PMC free article] [PubMed] [Google Scholar]
- Chavez JA, Summers SA. Characterizing the effects of saturated fatty acids on insulin signaling and ceramide and diacylglycerol accumulation in 3T3-L1 adipocytes and C2C12 myotubes. Arch Biochem Biophys. 2005;419:101–109. doi: 10.1016/j.abb.2003.08.020. [DOI] [PubMed] [Google Scholar]
- Chen W, Zhou XB, Liu HY, Xu C, Wang LL, Li S. P633H, a novel dual agonist at peroxisome proliferator-activated receptors alpha and gamma, with different anti-diabetic effects in db/db and KK-Ay mice. Br J Pharmacol. 2009;157:724–735. doi: 10.1111/j.1476-5381.2009.00231.x. [DOI] [PMC free article] [PubMed] [Google Scholar]
- Chomczynski P, Sacchi N. Single-step method of RNA isolation by acid guanidinium thiocyanate-phenol-chloroform extraction. Anal Biochem. 1987;162:156–159. doi: 10.1006/abio.1987.9999. [DOI] [PubMed] [Google Scholar]
- Collino M, Aragno M, Castiglia S, Miglio G, Tomasinelli C, Boccuzzi G, et al. Pioglitazone improves lipid and insulin levels in overweight rats on a high cholesterol and fructose diet by decreasing hepatic inflammation. Br J Pharmacol. 2010;160:1892–1902. doi: 10.1111/j.1476-5381.2010.00671.x. [DOI] [PMC free article] [PubMed] [Google Scholar]
- Desvergne B, Wahli W. Peroxisome proliferator-activated receptors: nuclear control of metabolism. Endocr Rev. 1999;20:649–688. doi: 10.1210/edrv.20.5.0380. [DOI] [PubMed] [Google Scholar]
- Doha KO, Kima YW, Parka SY, Leea SK, Parkb JS, Kim JY. Interrelation between long-chain fatty acid oxidation rate and carnitine palmitoyltransferase 1 activity with different isoforms in rat tissues. Life Sci. 2005;77:435–443. doi: 10.1016/j.lfs.2004.11.032. [DOI] [PubMed] [Google Scholar]
- Dole V, Meinertz H. Microdetermination of long-chain fatty acids in plasma and tissues. J Biol Chem. 1960;235:2595–2599. [PubMed] [Google Scholar]
- Dommes V, Baumgart C, Kumnau WH. Degradation of unsaturated fatty acids in peroxisomes. Existence of 2,4-dienoyl-CoA reductase pathway. J Biol Chem. 1981;256:8259–8262. [PubMed] [Google Scholar]
- Duran-Sandoval D, Mautino G, Martin G, Percevault F, Barbier O, Fruchart JC. Glucose regulates the expression of the farnesoid X receptor in liver. Diabetes. 2004;53:890–898. doi: 10.2337/diabetes.53.4.890. [DOI] [PubMed] [Google Scholar]
- Ginsberg HN, Zhang YL, Hernandez-Ono A. Metabolic syndrome: focus on dyslipidemia. Obesity (Silver Spring) 2006;14:41S–49S. doi: 10.1038/oby.2006.281. [DOI] [PubMed] [Google Scholar]
- Gómez-Garre D, Herraíz M, González-Rubio ML, Bernal R, Aragoncillo P, Carbonell A, et al. Activation of peroxisome proliferator-activated receptor-α and-γ in auricular tissue from heart failure patients. Eur J Heart Fail. 2006;8:154–161. doi: 10.1016/j.ejheart.2005.06.002. [DOI] [PubMed] [Google Scholar]
- Gray JP, Burns KA, Leas TL, Perdew GH, Vanden-Heuvel JP. Regulation of peroxisome proliferator-activated receptor α by protein kinase C. Biochemistry. 2005;44:10313–10321. doi: 10.1021/bi050721g. [DOI] [PubMed] [Google Scholar]
- Harwood HJ. Reactions of the hydrocarbon chain of fatty acids. Chem Rev. 1962;62:102–103. [Google Scholar]
- Honkakoski P, Zelko I, Sueyoshi T, Negishi M. The nuclear orphan receptor CAR-retinoid X receptor heterodimer activates the phenobarbital-responsive enhancer module of the CYP2B gene. Mol Cell Biol. 1998;18:5652–5658. doi: 10.1128/mcb.18.10.5652. [DOI] [PMC free article] [PubMed] [Google Scholar]
- Hosokawa Y, Shimomura Y, Harris RA. Determination of short-chain acyl CoA esters by high-performance liquid chromatography. Anal Biochem. 1989;153:45–49. doi: 10.1016/0003-2697(86)90058-8. [DOI] [PubMed] [Google Scholar]
- Hultin M, Carneheim C, Rosenqvist K, Olivecrona T. Intravenous lipid emulsions: removal mechanisms as compared to chylomicrons. J Lipid Res. 1995;36:2174–2184. [PubMed] [Google Scholar]
- Ide T, Watanabe M, Sugano M, Yamamoto I. Activities of liver mitochondrial and peroxisomal fatty acid oxidation enzymes in rats fed trans fat. Lipids. 1987;22:6–10. doi: 10.1007/BF02534867. [DOI] [PubMed] [Google Scholar]
- Iverius PH, Lindqvist AM. Preparation, characterization and measurement of lipoprotein lipase. Methods Enzymol. 1986;129:691–704. doi: 10.1016/0076-6879(86)29099-0. [DOI] [PubMed] [Google Scholar]
- Jordan M, Schallhorn A, Wurm FM. Transfecting mammalian cells: optimization of critical parameters affecting calcium-phosphate precipitate formation. Nucleic Acids Res. 1996;24:596–601. doi: 10.1093/nar/24.4.596. [DOI] [PMC free article] [PubMed] [Google Scholar]
- Kaluzny M, Duncan L, Merritt M, Epps D. Rapid separation of lipid classes in high yield and purity using bonded phase columns. J Lipid Res. 1985;26:135–140. [PubMed] [Google Scholar]
- Laplante M, Festuccia WT, Soucy G, Blanchard PG, Renaud A, Berger JP, et al. Tissue-specific postprandial clearance is the major determinant of PPARγ-induced triglyceride lowering in the rat. Am J Physiol Regul Integr Comp Physiol. 2009;296:R57–R66. doi: 10.1152/ajpregu.90552.2008. [DOI] [PubMed] [Google Scholar]
- Lazennec G, Canaple L, Saugy D, Wahli W. Activation of peroxisome proliferator-activated receptors (PPARs) by their ligands and protein kinase A activators. Mol Endocrinol. 2000;14:1962–1975. doi: 10.1210/mend.14.12.0575. [DOI] [PMC free article] [PubMed] [Google Scholar]
- Lewis GF, Carpentier A, Adeli K, Giacca A. Disordered fat storage and mobilization in the pathogenesis of insulin resistance and type 2 diabetes. Endocr Rev. 2002;23:201–229. doi: 10.1210/edrv.23.2.0461. [DOI] [PubMed] [Google Scholar]
- Li PP, Shan S, Chen YT, Ning ZQ, Sun SJ, Liu Q, et al. The PPAR alpha/gamma dual agonist chiglitazar improves insulin resistance and dyslipidemia in MSG obese rats. Br J Pharmacol. 2006;148:610–618. doi: 10.1038/sj.bjp.0706745. [DOI] [PMC free article] [PubMed] [Google Scholar]
- Maessen JG, Vusse GJ, Vork M, Kootstra G. Nucleotides, nucleosides and oxypurines in human kidneys measured by use of reversed phase high-performance liquid chromatography. Clin Chem. 1988;34:1087–1090. [PubMed] [Google Scholar]
- Martin G, Schoonjans K, Lefebvre AM, Staels B, Auwerx J. Coordinate regulation of the expression of the fatty acid transport protein and acyl-CoA synthetase genes by PPARα and PPARγ activators. J Biol Chem. 1997;272:28210–28217. doi: 10.1074/jbc.272.45.28210. [DOI] [PubMed] [Google Scholar]
- Michael MD, Kulkarni RN, Postic C, Previs SF, Shulman GI, Magnuson MA, et al. Loss of insulin signaling in hepatocytes leads to severe insulin resistance and progressive hepatic dysfunction. Mol Cell. 2006;6:87–97. [PubMed] [Google Scholar]
- Motojima K, Passilly P, Peters JM, Gonzalez FJ, Latruffe N. Expression of putative fatty acid transporter genes are regulated by peroxisome proliferator-activated receptor α and γ activators in a tissue- and inducer-specific manner. J Biol Chem. 1998;273:16710–16714. doi: 10.1074/jbc.273.27.16710. [DOI] [PubMed] [Google Scholar]
- Oakes ND, Kjellstedt A, Forsberg G, Clementz T, Camejo G, Furler S. Development and initial evaluation of a novel method for assessing tissue-specific plasma free fatty acid utilization in vivo using (R)-2-bromopalmitate tracer. J Lipid Res. 1999;40:1155–1169. [PubMed] [Google Scholar]
- Ringseis R, Muschick A, Eder K. Dietary oxidized fat prevents ethanol induced triacylglycerol accumulation and increases expression of PPARα target genes in rat liver. J Nutr. 2007;137:77–83. doi: 10.1093/jn/137.1.77. [DOI] [PubMed] [Google Scholar]
- Rong X, Li Y, Ebihara K, Zhao M, Kusakabe T, Tomita T, et al. Irbesartan treatment up-regulates hepatic expression of PPAR-alpha and its target genes in obese Koletsky (fa(k)/fa(k)) rats: a link to amelioration of hypertriglyceridaemia. Br J Pharmacol. 2010;160:1796–1807. doi: 10.1111/j.1476-5381.2010.00835.x. [DOI] [PMC free article] [PubMed] [Google Scholar]
- Rössner S. Studies on an intravenous fat tolerance test. Methodological, experimental and clinical experiences with Intralipid. Acta Med Scand Suppl. 1974;564:1–24. [PubMed] [Google Scholar]
- Saponara R, Bosisio E. Inhibition of cAMP-phosphodiesterase by biflavones of Ginkgo biloba in rat adipose tissue. J Nat Prod. 1998;61:1386–1387. doi: 10.1021/np970569m. [DOI] [PubMed] [Google Scholar]
- Schwarz JM, Linfoot P, Dare D, Aghajanian K. Hepatic de novo lipogenesis in normoinsulinemic and hyperinsulinemic subjects consuming high-fat, low-carbohydrate and low-fat, high-carbohydrate isoenergetic diets. Am J Clin Nutr. 2003;77:43–50. doi: 10.1093/ajcn/77.1.43. [DOI] [PubMed] [Google Scholar]
- Srivastava RA, Jahagirdar R, Azhar S, Sharma S, Bisgaier CL. Peroxisome proliferator-activated receptor-alpha selective ligand reduces adiposity, improves insulin sensitivity and inhibits atherosclerosis in LDL receptor-deficient mice. Mol Cell Biochem. 2006;285:35–50. doi: 10.1007/s11010-005-9053-y. [DOI] [PubMed] [Google Scholar]
- Taskén K, Aandahl EM. Localized effects of cAMP mediated by distinct routes of protein kinase A. Physiol Rev. 2004;84:137–167. doi: 10.1152/physrev.00021.2003. [DOI] [PubMed] [Google Scholar]
- Taube A, Eckardt K, Eckel J. Role of lipid-derived mediators in skeletal muscle insulin resistance. Am J Physiol Endocrinol Metab. 2009;297:E1004–E1012. doi: 10.1152/ajpendo.00241.2009. [DOI] [PubMed] [Google Scholar]
- Wang F, Tong Q. SIRT2 suppresses adipocyte differentiation by deacetylating FOXO1 and enhancing FOXO1's repressive interaction with PPARγ. Mol Biol Cell. 2009;20:801–808. doi: 10.1091/mbc.E08-06-0647. [DOI] [PMC free article] [PubMed] [Google Scholar]
- Woo CW, Siow YL, O K. Homocysteine activates cAMP-response element binding protein in HEK293 through cAMP/PKA signaling pathway. Arterioscler Thromb Vasc Biol. 2006;26:1043–1050. doi: 10.1161/01.ATV.0000214981.58499.32. [DOI] [PubMed] [Google Scholar]
- Ye JM, Tid-Ang J, Turner N, Zeng XY, Li HY, Cooney GJ, et al. PPARδ agonists have opposing effects on insulin resistance in high fat-fed rats and mice due to different metabolic responses in muscle. Br J Pharmacol. 2011;163:556–566. doi: 10.1111/j.1476-5381.2011.01240.x. [DOI] [PMC free article] [PubMed] [Google Scholar]
Associated Data
This section collects any data citations, data availability statements, or supplementary materials included in this article.