

Abstract
Presently incurable, Parkinson's disease (PD) is the most common neurodegenerative movement disorder and affects 1% of the population over 60 years of age. The hallmarks of PD pathogenesis are the loss of dopaminergic neurons in the substantia nigra pars compacta, and the occurrence of proteinaceous cytoplasmic inclusions (Lewy bodies) in surviving neurons. Lewy bodies are mainly composed of the pre-synaptic protein alpha-synuclein (αsyn), an intrinsically unstructured, misfolding-prone protein with high propensity to aggregate. Quantifying the pool of soluble αsyn and monitoring αsyn aggregation in living cells is fundamental to study the molecular mechanisms of αsyn-induced cytotoxicity and develop therapeutic strategies to prevent αsyn aggregation. In this study, we report the use of a split GFP complementation assay to quantify αsyn solubility. Particularly, we investigated a series of naturally occurring and rationally designed αsyn variants and showed that this method can be used to study how αsyn sequence specificity affects its solubility. Furthermore, we demonstrated the utility of this assay to explore the influence of the cellular folding network on αsyn solubility. The results presented underscore the utility of the split GFP assay to quantify αsyn solubility in living cells.
Introduction
Parkinson’s disease (PD) is the most prevalent neurodegenerative movement disorder, affecting 1% of the world’s population over the age of 60 years [1]. The hallmarks of PD pathogenesis are the loss of dopaminergic neurons in the substantia nigra pars compacta and the occurrence of cytoplasmic inclusions called Lewy bodies (LB) in surviving dopaminergic neurons [2]. Post mortem analyses revealed that the main component of LB is the pre-synaptic protein alpha-synuclein (αsyn) and of trace amounts of ubiquitin and molecular chaperones [3], suggesting that they result from the aberrant accumulation and aggregation of misfolded, undegraded αsyn. Duplications or triplications of the αsyn locus [4], [5], as well as mutations in αsyn-encoding gene - A53T, A30P & E46K – lead to increased aggregation and have been linked to familial cases of PD [6]–[10]. Overexpression of αsyn results in the formation of inclusion bodies, cytotoxicity and cell death in animal models and cell cultures [11]–[13]. Misfolding and aggregation of αsyn has been associated with impairment of proteasomal degradation, another common trait of PD pathogenesis [14]–[16]. In summary, aberrant accumulation of misfolded αsyn plays a key role in development of PD pathogenesis. Therefore, monitoring αsyn aggregation in living cells in a quantitative fashion is important to study the molecular mechanisms associated with αsyn-induced cytotoxicity and develop therapeutic strategies for the treatment of PD.
A number of αsyn variants containing mutations that alter the protein’s rate of aggregation have been characterized [6]–[9]. Among mutations linked to familial cases of PD, the A53T αsyn variant was shown to aggregate at a much faster rate than wt αsyn in cell cultures and in vitro [9], [10], [17]. C-terminal truncations have also been reported to aggregate at higher rates than wt αsyn [18]–[20], demonstrating that the proline-rich C-terminal region plays a fundamental role in limiting αsyn misfolding and aggregation [18]–[22]. A recent study demonstrated that a truncation variant of αsyn consisting of amino acids 1–123 (αsyn123) readily formed aggregates in vitro [19]. Interestingly, it was also shown that truncated αsyn accumulates in LB [23], suggesting that lower molecular weight truncated αsyn species may have a role in PD pathology. Recently, in an effort to decipher the determinants of αsyn aggregation, a rationally designed mutant containing three proline substitutions (TP αsyn, containing substitutions A30P, A56P and A76P) was also constructed and demonstrated to resist aggregation in vitro [24]. Its solubility in cell cultures, however, is not known.
A number of methods to study αsyn aggregation in vitro have been reported and include microscopy [21], size-exclusion chromatography [25], and NMR spectroscopy [26]. These techniques rely on the use of purified proteins for analysis. Hence, they preclude the study of αsyn aggregation in living cells, which is necessary to decipher the pathogenic mechanisms that lead to increased levels of misfolded and aggregated αsyn and to identify gene targets for therapy.
Microscopy based techniques have been used to monitor protein aggregation in living cells [27], [28]. Particularly, αsyn aggregation can be detected using αsyn-specific antibodies [11], [29] or by overexpressing αsyn variants fused to fluorescent reporters such as GFP [17], [30], [31]. The main limitation of using GFP fusions as aggregation reporters is that aggregation events that occur after the formation of the GFP chromophore do not alter fluorescence emission, leading to detection of GFP fluorescence irrespective of αsyn aggregation state. To overcome this limitation, techniques that rely on fluorescence complementation have been developed. Particularly, αsyn was fused to non-fluorescent complementary GFP fragments and the resulting fusion molecules were co-expressed in mammalian cells. αsyn self-association causes close proximity of the two GFP fragments and results in bimolecular fluorescence complementation (BiFC). Hence, the intensity of the fluorescence signal is a measurement of αsyn self-association [32]–[34]. Fluorescence energy resonance transfer (FRET) has also been used to quantify αsyn aggregation by fusing two fluorophores to the N- and C-terminals of αsyn [35]. BiFC and FRET, however, suffer from inherent limitations. Fusion of αsyn to highly stable chromophores or to large protein fragments can perturb αsyn folding and alter its misfolding-propensity. In addition, these techniques are not optimal to measure protein self-association because they fail to detect homotypic interactions.
In this study, we developed an expression system that allows detecting and quantifying soluble αsyn in living cells. We adapted a previously reported split GFP molecule specifically engineered to study protein solubility [36]. This GFP variant is cleaved into two unequal size fragments, a 15-amino acid “sensor” fragment and a large “detector” fragment, that spontaneously complement upon chemical interaction, giving rise to a fluorescence signal [36]. αsyn was fused to the sensor fragment, which has minimal effect on the folding and solubility of its fusion partners and can therefore be used as a sensor of αsyn solubility. The resulting αsyn fusion protein was co-expressed with the large detector fragment in cell cultures. Fluorescent complementation is directly proportional to αsyn solubility as it occurs only if the sensor fragment escapes aggregation and is accessible to the detector fragment. The fluorescence of cells expressing wild type αsyn was compared to that of cells expressing αsyn variants with different aggregation properties: A53T αsyn, a C-terminal truncation variant (αsyn123), and a rationally designed triple proline mutant (A30P, A56P and A76P) with low propensity to aggregate (TP αsyn). Cell fluorescence was also evaluated upon inhibition of proteasomal degradation and was observed to correlate with αsyn solubility as predicted from in vitro studies. Our results indicate that this method provides a robust platform to quantify αsyn solubility in living cells and can be used to study αsyn sequence specificity and to monitor the influence of the cell folding network on αsyn aggregation.
Results
Quantification of αsyn Solubility using the αsyn-split GFP Assay
To study αsyn solubility in living cells we adapted a previously reported assay based on split GFP complementation [36]. In this assay, GFP is split into two moieties, GFP1–10, the bulk of the β-barrel (detector fragment), and GFP11, a 15-amino acid β-sheet (sensor fragment). GFP fragment complementation was shown to be inversely proportional to aggregation by comparing sequential expression and co-expression of GFP11-tagged proteins and GFP1–10 [36]. The small GFP11 tag was previously shown not to affect the folding of the fusion protein [36], [37] and was therefore fused to the C-terminal of αsyn in this study. The large GFP1–10 fragment was co-expressed with αsyn-GFP11 in the cytoplasm of mammalian cells. We hypothesized that if αsyn is maintained in a soluble state, the GFP11 tag is exposed to the solvent and can complement with GFP1–10, giving rise to a fluorescence signal. On the other hand, αsyn aggregation would preclude accessibility of GFP11 to GFP1–10, thus preventing fluorescence complementation. Hence, GFP fluorescence is expected to be proportional to αsyn solubility.
HeLa cells were transfected for the expression of αsyn-GFP11 and GFP1–10 and GFP fluorescence was evaluated by flow cytometry and fluorescence microscopy (Figure 1). As expected, cells expressing only GFP1–10 did not display detectable fluorescent signal (Figure 1A), whereas cells co-expressing αsyn-GFP11 and GFP1–10 exhibited GFP fluorescence when tested 18 hrs post transfection (Figure 1B). Fluorescence microscopy validated these results (Figure 1, inset), confirming that cell fluorescence is due to GFP fragment complementation. To ensure that the intensity of the fluorescence signal is not limited by the amount of GFP1–10 available for complementation with GFP11 and is therefore an accurate measurement of the concentration of soluble αsyn, a series of experiments were conducted in which increasing concentrations of plasmid encoding for GFP1–10 were used in the transfection procedure. A GFP1–10 to GFP11 ratio of 2∶1 was sufficient to ensure that fluorescent complementation is not limited by the concentration of GFP1–10 but rather depends on the amount of soluble αsyn-GFP11 (data not shown), in agreement with previously published work [36], [37]. This ratio of plasmid concentrations was used for all subsequent experiments.
Figure 1. The αsyn-split GFP system enables quantification of soluble αsyn in HeLa cells.

HeLa cells were transfected with αsyn-GFP11 and GFP1–10. Fluorescence was measured with a flow cytometer and live cells were imaged using fluorescence microscopy. (A) Representative fluorescence histogram (left panel) and data analysis (right panel) of cells expressing GFP1–10 only. Over 99% of the cell population does not display fluorescence. A representative image of live cells is reported in the figure inset. (B) Fluorescence histogram (left panel) and data analysis (right panel) of cells co-expressing αsyn-GFP11 and GFP1–10. Over 50% of the cell population display GFP fluorescence. A representative fluorescence microscopy image is reported in the figure inset. Scale bars represent 200 µm.
Next, we compared wild type αsyn to three αsyn variants - A53T αsyn, TP αsyn and a C-terminal truncation mutant consisting of amino acids 1–123 (αsyn123). A53T αsyn was shown to aggregate faster than wild type αsyn in cells and in vitro [9], [10], [17]. The truncated αsyn123 has a shortened proline rich C terminal region, making it prone to aggregation in in vitro studies [18]–[20]. TP αsyn contains three proline substitutions (A30P, A56P and A76P) that disrupt the protein's ability to form aggregates in vitro, therefore preventing the formation of fibrils even after two weeks of incubation [24]. The solubility and aggregation propensity of TP αsyn in living cells, however, is not known. The mutations were introduced in the αsyn-GFP11 encoding gene. HeLa cells were transfected with three plasmid encoding the αsynGFP11 variants, GFP1–10, and mCherry, a highly photostable red fluorescent protein mutant [38] (a gracious gift from Dr. Jonathan Silberg, Rice University), used here as a transfection control. Cells were cultured for 18 hrs and GFP fluorescence measured by flow cytometry. Cells expressing TP αsyn exhibited 50% higher fluorescence than cells expressing wild type αsyn, whereas, GFP fluorescence was 25% lower in cells expressing A53T and αsyn123 (Figure 2A). Results obtained using HeLa cells suggest that the αsyn-split GFP assay can be used to quantify αsyn solubility in living cells. To validate the use of the αsyn-split GFP assay in a cell type more relevant to study the phenotype associated with PD cellular pathogenesis, these experiments were repeated using neuroglioma (H4) cells. As shown in Figure 2B, H4 cells expressing A53T αsyn and αsyn123 exhibited significantly lower fluorescence than wild type αsyn, while GFP fluorescence was significantly higher in H4 cells transfected with TP αsyn, confirming the results obtained in HeLa cells.
Figure 2. Mutations in αsyn gene sequence affect protein solubility.

The fluorescence of cells expressing the αsyn-split GFP system was measured by flow cytometry and fluorescence microscopy. (A) Quantitative analysis of GFP fluorescence of HeLa cells expressing αsyn-GFP11+ GFP1–10 (blue), A53T αsyn-GFP11+ GFP1–10 (green), αsyn123-GFP11+ GFP1–10 (purple) and TP αsyn-GFP11+ GFP1–10 (red). (B) Quantitative analysis of GFP fluorescence of H4 cells expressing αsyn-GFP11 (blue), A53T αsyn-GFP11+ GFP1–10 (green), αsyn123-GFP11+ GFP1–10 (purple) and TP αsyn-GFP11+ GFP1–10 (red). Fluorescence measurements were normalized to fluorescence of cells expressing wild type αsyn-GFP11. *p<0.05; **p<0.005. Data points are reported as mean ± S.E.M. (n = 3). (C–D) Representative fluorescence microscopy images of HeLa cells expressing αsyn-GFP11+ GFP1–10 (blue, first row), A53T αsyn-GFP11+ GFP1–10 (green, second row), αsyn123-GFP11+ GFP1–10 (purple, third row) and TP αsyn-GFP11+ GFP1–10 (red, fourth row) at 20X (C) and 100X (D) magnification. GFP fluorescence is shown in the left column and mCherry fluorescence is shown in the right column. Scale bar represents 200 µm (C) and 20 µm (D).
Fluorescence microscopy images of HeLa cells expressing the αsyn-split GFP system are reported in Figure 2C–D and include detection of GFP fluorescence (left column) and detection of mCherry fluorescence (right column). GFP fluorescence was observed to decrease in cells expressing A53T αsyn and αsyn123 and to increase in cells expressing TP αsyn, confirming results obtained with flow cytometry. The intensity of mCherry fluorescence, however, did not change in cells expressing different αsyn variants, demonstrating that the differences in GFP fluorescence complementation detected are not due to differences in transfection or expression efficiency, but are rather due to GFP fluorescence complementation. These differences in GFP fluorescence complementation were equally observed upon visualization of the whole cell population (Figure 2C) as well as in individual cells (Figure 2D), confirming the results obtained from flow cytometry. In summary, these results demonstrate that A53T αsyn and αsyn123 have a higher propensity to form aggregates and, therefore, lead to lower fluorescence complementation than wt and TP αsyn.
Inhibition of Proteasomal Degradation Lowers αsyn Solubility and Prevents GFP Fluorescence Complementation
Our results demonstrate that the αsyn-split GFP assay is a viable tool to study αsyn aggregation. This assay can be used to study the aggregation of naturally occurring αsyn variants and to predict the aggregation of rationally designed mutants such as TP αsyn. To further characterize the TP αsyn mutant, we tested its solubility in HeLa cells under cell culturing conditions that are expected to alter the solubility of misfolded, aggregation-prone proteins. To this end, we induced chemical inhibition of proteasomal degradation and investigated its effect on fluorescence complementation. Inhibition of the proteasome causes aberrant accumulation of misfolded proteins and formation of insoluble aggregates [39], [40]. Lactacystin is a highly selective proteasome inhibitor [41] that can easily penetrate the cell membrane and irreversibly block multiple hydrolytic activities in the proteasome [42]. HeLa cells expressing GFP1–10 and either αsyn-GFP11 or TP αsyn-GFP11 were treated with a range of concentrations of lactacystin for 24 hrs and GFP fluorescence was measured by flow cytometry. As shown in Figure 3A, cells expressing TP αsyn exhibited 10% and 21% higher fluorescence than cells expressing wild type αsyn after 12 and 24 hrs of incubation, respectively. Upon treatment with lactacystin, we observed a decrease in GFP fluorescence in a concentration dependent manner. Specifically, cells expressing αsyn wild type displayed 68% fluorescence of untreated cells upon treatment with 5 µM lactacystin and cells expressing TP αsyn displayed 70% fluorescence under the same conditions (Figure 3B). These results suggest that proteasomal inhibition, by causing an increase in αsyn aggregation, results in lowered GFP fluorescence complementation. Thus, this assay can be used to monitor the influence of the folding and degradation machinery on αsyn solubility. It should be noted that even though lactacystin treatment caused similar changes in fluorescence in cells expressing wild type αsyn and TP αsyn relative to untreated cells, the absolute fluorescence of cells expressing TP αsyn was significantly higher than that of cells expressing αsyn wild type (Figure S1), as reported before (Figure 2 & 3A).
Figure 3. Inhibition of proteasomal degradation lowers αsyn solubility.

(A) Quantitative analysis of GFP fluorescence of cells expressing αsyn-GFP11+ GFP1–10 (blue) and TP αsyn-GFP11+ GFP1–10 (red). Relative fluorescence was calculated by normalizing the fluorescence of cells 12 and 24 hrs post transfection to the fluorescence measured at 0 hr. *p<0.005; **p<0.05. (B) Relative fluorescence of cells expressing αsyn-GFP11 and GFP1–10 (blue) and TP αsyn-GFP11+ GFP1–10 (red), 24 hrs post transfection. Cells were incubated for 24 hrs with increasing concentrations of lactacystin (0–5 µM). Relative fluorescence was evaluated by normalizing the fluorescence of treated cells to the fluorescence of untreated cells. *p<0.01, **p<0.05. Data points are reported as mean ± S.E.M. (n = 3) (C) Representative western blot of cells expressing αsyn-GFP11, treated with lactacystin (5 µM) for 24 hrs, using αsyn-specific antibody. (D) Western blots band quantification of cells expressing αsyn-GFP11. Bands were quantified by NIH ImageJ analysis software. GAPDH was used as loading control.
In order to confirm that the loss of GFP fluorescence observed upon lactacystin treatment is due to increase in αsyn aggregation, αsyn solubility was investigated by Western blot. HeLa cells expressing αsyn-GFP11 were incubated with lactacystin (5 µM) for 24 hrs. The soluble protein fraction was collected and analyzed using an αsyn-specific antibody. Lactacystin-induced proteasome inhibition was observed to result in approximately 25% decrease in soluble αsyn (Figure 3C and 3D). This data indicates that the decrease in fluorescence complementation due to lactacystin treatment can be attributed to a decrease in soluble αsyn-GFP11.
Fluorescence Complementation Inversely Correlates with the Formation of Cellular Aggregates
To examine the correlation between fluorescence complementation and αsyn aggregation, we evaluated the formation of aggregates using immunofluorescence microscopy. Cells were cultured under conditions that gave rise to maximal change in GFP complementation and analyzed by immunofluorescence microscopy. Specifically, HeLa cells were transfected for the expression of GFP1–10 and either αsyn-GFP11 or TP αsyn-GFP11 and treated with lactacystin (5 µM) for 24 hrs. αsyn accumulation into cellular aggregates was detected using an antibody specific for αsyn (Figure 4, column 1, blue) and the ProteoStat® dye (Figure 4, column 2, red), a 488-nm excitable red fluorescent molecule that specifically interacts with denatured proteins within aggresomes [43]. Images showing co-localization of αsyn and the aggregate-specific dye were analyzed with NIH ImageJ software to obtain heatmaps (Figure 4, column 3). To quantify the aggregation of αsyn, co-localization events were counted and averaged over three independent experiments. The extent of co-localization was evaluated by analyzing the image heatmaps based on the color scale reported in Table 1 as described in the Materials and Methods. Our analysis revealed that the degree of αsyn aggregation induced by lactacystin treatment depends on αsyn sequence. Specifically, cells expressing αsyn-GFP11 display a 3-fold increase in αsyn aggregation upon treatment with lactacystin, while cells expressing TP αsyn-GFP11 exhibit only a 1.5-fold increase (Table 1, high aggregation). The extent of aggregation detected from fluorescence microscopy studies (Figure 4) inversely correlates with measurements of cell fluorescence obtained by flow cytometry (Figure 3). We therefore concluded that the decrease in fluorescence complementation observed in cells treated with lactacystin can be attributed to the increase in αsyn aggregation caused by inhibition of proteasomal degradation. Furthermore, the higher fluorescence complementation observed in cells expressing TP αsyn compared to wild type αsyn is a direct result of its lower rate of aggregation.
Figure 4. Inhibition of proteasomal degradation enhances αsyn aggregation.
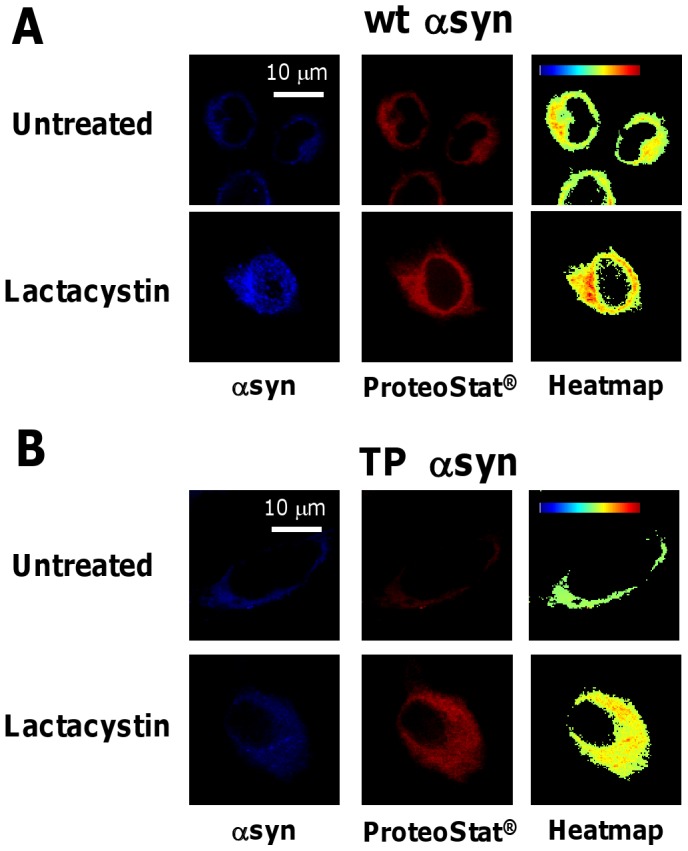
Immunofluorescence microscopy of cells expressing (A) αsyn-GFP11 and GFP1–10 and (B) TP αsyn-GFP11 and GFP1–10. Cells were treated with lactacystin (5 µM) for 24 hrs. Co-localization intensity of αsyn (blue, column 1) and ProteoStat® dye (red, column 2) is displayed in the form of co-localization heat maps (column 3). Hot colors represent positive co-localization and cold colors represent negative co-localization. Scale bars represent 10 µm.
Table 1. ProteoStat® co-localization assay.
| αsyn | TP αsyn | |||||||||||
| αsyn aggregation | Untreated | Lactacystin | Untreated | Lactacystin | ||||||||
| Low a | 52.0 | ± | 4.5 | 57.8 | ± | 15.0 | 33.4 | ± | 6.2 | 45.7 | ± | 12.0 |
| High b | 9.8 | ± | 4.6 | 28.9 | ± | 9.2 | 7.1 | ± | 4.0 | 10.8 | ± | 3.0 |
Low co-localization – 35 to 60, yellow pixels.
High co-localization – 0 to 35, red pixels.
Discussion
Aggregation of αsyn into proteinaceous inclusions [2] has been repeatedly associated with the development of PD pathogenesis [11], [44]. Therefore, there is an urgent need to understand the molecular mechanisms underlying αsyn misfolding and aggregation in living cells. Currently available methods to study aggregation in cell cultures, including the use of GFP fusions, BiFC and FRET, present a number of limitations mainly associated with the use of reporter molecules that alter αsyn misfolding and aggregation pathway [32], preclude rapid and high-throughput quantification and, most importantly, do not afford reliable distinction between soluble and insoluble pools of αsyn [45]. In this study, we report the use of a split GFP assay based on the detection of fluorescent complementation [36], previously reported for quantification of protein solubility in vitro [36], and in bacterial and mammalian cells [37]. The GFP variant used in this assay is split into a small “sensor” fragment, which was fused to αsyn in this study, and a large “detector” fragment. αsyn aggregation precludes accessibility of the sensor fragment to the detector fragment for fluorescence complementation. We demonstrated here that the αsyn-split GFP expression system provides a reliable tool to quantify αsyn solubility in living cells.
We investigated the utility of the αsyn-split GFP assay to study the relationship between αsyn sequence and its rate of aggregation in living cells. Mutations in the αsyn-encoding gene have been associated with the development of early onset familial cases of PD [6]–[8]. αsyn C-terminal truncations were observed to accumulate in LB [20], [46], [47]. The aggregation properties of naturally occurring and rationally designed αsyn mutants have been extensively characterized in vitro [24], [48], [49]. To evaluate the use of the αsyn-split GFP assay to study how αsyn sequence specificity affects protein aggregation, we tested a rationally designed variant (TP αsyn) known to resist aggregation in vitro [24]. We compared the fluorescence of cells expressing TP αsyn to that of cells expressing wild type αsyn, A53T αsyn and a truncated αsyn variant (αsyn123). We observed a significant increase in fluorescence in cells expressing TP αsyn compared to cells expressing wild type αsyn, demonstrating higher solubility of this αsyn variant in cell cultures. On the other hand, cells expressing the A53T mutant and the truncation mutant αsyn123 exhibited significantly lower fluorescence than cells expressing wild type αsyn, suggesting that these variants aggregate at higher rate and that aggregation lowers GFP fragment complementation and fluorescence. These results indicate that the αsyn-split GFP assay can be used to quantify the effect of mutations in αsyn-encoding gene on the protein aggregation propensity in living cells.
We also investigated whether the αsyn-split GFP assay can be used to study the impact of environmental factors that alter the efficiency of the folding quality control system on αsyn solubility. Although the causes of PD are far from understood, studies have shown that changes in the cellular environment such as oxidative stress and inflammation are involved in the progression of the disease [50]. Inducing oxidative stress or inflammation was shown to increase αsyn aggregation and αsyn-induced cytotoxicity [51], [52]. Furthermore, the accumulation of αsyn has also been associated with impairment of the proteasome [14]–[16]. In this study, proteasomal inhibition was chemically induced in cells expressing the αsyn-split GFP system and observed to lower fluorescence complementation, demonstrating that proteasome dysfunction lowers αsyn solubility.
Finally, we showed that the intensity of fluorescence of cells expressing the αsyn-split GFP system is inversely proportional to the extent of αsyn aggregation. Analysis of co-localization between αsyn and an aggregate-specific dye revealed that the increase in fluorescent signal measured correlates with the decrease in aggregate formation. These results demonstrate that the αsyn-split GFP assay can be used to investigate cell treatments that affect protein aggregation and that it will potentially enable molecular screenings for the discovery of compounds that modulate αsyn aggregation.
In summary, our results show that the αsyn-split GFP assay allows to quantitatively measure the solubility of αsyn in living cells. Furthermore, we demonstrated that this assay can be used to study the aggregation properties of αsyn mutants in cell cultures and elucidate the effects that modifiers of cellular protein folding have on αsyn aggregation.
Methods
Reagents, Cell Lines, and Media
Lactacystin was purchased from Cayman Chemicals. Cell culture media were purchased from Gibco and Invitrogen. Fetal bovine serum (FBS) was purchased from Atlanta Biologicals. JetPrime™ transfection kit was purchased from Polyplus Transfection. Proteostat® Aggresome Detection Kit was purchased from Enzo Life Sciences.
HeLa cells (ATCC) were grown in MEM (GIBCO) supplemented with 10% heat-inactivated FBS and 1% PSQ and maintained at 37°C and 5% CO2. Human H4 neuroglioma cells (HTB-148, ATCC) were cultured in high glucose DMEM (Invitrogen) supplemented with 10% heat-inactivated FBS, 1% PSQ, 4 mM L-Glutamine, and 1 mM sodium pyruvate, and maintained at 37°C and 5% CO2. Cell medium was replaced every 3 to 4 days and monolayers of cells were passaged upon reaching about 90% confluency.
Plasmids and Transient Transfections
pCMV-mGFP Cterm S11 Neo Kan and pCMV-mGFP 1–10 Hyg Amp vectors were obtained from Theranostech, Inc. The sequence encoding for GFP1–10 was amplified from pCMV-mGFP1–10 Hyg Amp by PCR using the primers listed in Table S1 and subcloned into pcDNA4/TO (Invitrogen) using the KpnI and XhoI restriction sites, giving rise to pcDNA4/TO/GFP1–10. The cDNA encoding for α-syn was amplified from pcDNA6.2+αsyn-emGFP plasmid (lab collection) using the primers listed in Table S1 and cloned into the plasmid pCMV-mGFP Cterm S11 Neo Kan using XhoI and AgeI restriction sites, giving rise to pCMV-mGFP/αsyn-GFP11. The A53T substitution carrying mutant αsyn was constructed using the QuikChange® Site-Directed mutagenesis kit (Strategene) and KAPA HiFi HotStart PCR kit (Kapa Biosystems) following manufacturers’ protocols and using primers listed in Table S1, giving rise to pCMV-mGFP/A53Tαsyn-GFP11.The gene encoding for the αsyn mutant containing A30P, A56P, and A76P substitutions was constructed using the same procedure, using primers listed in Table S1, giving rise to pCMV-mGFP/TP αsyn-GFP11. The sequence of the truncated αsyn gene was amplified using pCMV-mGFP/αsyn-GFP11 as template and primers listed in table S1. The PCR product was cloned into the empty pCMV-mGFP Cterm S11 Neo Kan plasmid using XhoI and AgeI restriction sites, giving rise to pCMV-mGFP/αsyn123-GFP11.
Transfections were conducted in 6-well plates. 104 cells were seeded in each well of a 6-well plate and plates were incubated for 24 hrs at 37°C. Transient transfections were performed using the JetPrime™ DNA transfection kit (Polyplus Transfection) according to the manufacturer’s procedures.
GFP Complementation Analyses
HeLa or H4 cells were plated in 6-well plates and incubated for 24 hrs at 37°C. The media was removed and replaced with fresh media containing 0.33 µg of vectors encoding for wild type αsyn, A53T αsyn, TP αsyn or αsyn123 and 0.67 µg of pcDNA4/TO/GFP1–10 per well and transfected as described above. Transfection reactions were incubated for 16 hrs, at which point the media was replaced again. Cells were then collected and fluorescence was measured using a flow cytometer (FACSCanto™ II, BD Biosciences).
Fluorescence Microscopy Analysis
HeLa cells were seeded on glass coverslips in 6-well plate and incubated for 24 hrs at 37°C. The media was removed and replaced with fresh media containing 0.33 µg/well of vectors encoding for wild type αsyn, A53T, TP αsyn or αsyn123, 0.67 µg/well of pcDNA4/TO/GFP1–10 and 0.2 µg/well of plasmid encoding for mCherry. The transfection reactions were incubated for 16 hrs, at which point they were washed with 0.1% Tween-20/PBS and fixed with 4% paraformaldehyde for 30 min. The coverslips were mounted on glass slides for fluorescence microscopy. The slides were imaged using an Olympus IX81 confocal microscope and analyzed using proprietary Fluoview software.
Western Blot Analysis
HeLa cells were plated in 6-well plates and incubated for 24 hrs at 37°C. The media was removed and replaced with fresh MEM media containing 0.5 µg of pCMV-mGFP/αsyn-GFP11 per well and transfected as described above. Cells were lysed with complete lysis-M buffer (Roche) for 30min on ice with gentle rocking. The protein concentration was determined by Bradford assay (Pierce), and each sample was diluted to the same protein concentration. Proteins were separated by 12% SDS-polyacrylamide gels and transferred to a nitrocellulose membrane. Membranes were incubated with primary antibodies (mouse anti-α-syn (Sigma-Aldrich) and rabbit anti-GAPDH (Santa Cruz Biotechnology)) and appropriate secondary antibodies (HRP conjugated goat anti-rabbit and goat anti-mouse antibodies (Santa Cruz)). Blots were visualized using Millipore Luminata Forte HRP chemiluminescent substrate (Fisher) and quantified using NIH ImageJ software.
Immunofluorescence and Co-localization Analyses
Cells were seeded on glass coverslips in 6-well plate, transfected, incubated in the presence of small molecules for 24 hrs and fixed with 4% paraformaldehyde for 30 min. Cells were permeabilized with a 0.5% Triton X-100, 0.6% 0.5 M EDTA solution in Assay buffer (Proteostat® Aggresome Detection Kit, Enzo) for 30 min on ice, followed by incubation in 8% BSA (blocking buffer) for 1 hr at room temperature. Cells were then incubated for 1 hr with primary antibody (mouse anti-αsyn, Sigma-Aldrich), washed with 0.1% Tween-20/PBS, and incubated with secondary antibody (Dylight 649 Goat anti-mouse from KPL). Cells were washed again and incubated with ProteoStat® dye (Proteostat® Aggresome Detection Kit, Enzo) for 30 min in the dark. The coverslips were mounted on glass slides for fluorescent microscopy. The slides were imaged using an Olympus IX81 confocal microscope and analyzed using proprietary Fluoview software.
Co-localization of αsyn with the ProteoStat® dye was evaluated using the ImageJ plugin Co-localization Colormap [53]. Results are reported in the form of co-localization heatmaps where hot colors represent positive co-localization, and cold colors represent negative co-localization. The co-localization heatmaps were analyzed using the ImageJ plugin Threshold Colour, which allows RGB images to be filtered based on the hue, saturation, and brightness of the pixels. Images were filtered to display RGB color hues as follows: high co-localization (RGB hue: 0–35, red pixels) and low co-localization (RGB hue: 36–60, yellow pixels). Pixels falling in the RGB hue range 60–255 were considered negative correlation and not evaluated in this study. For each sample, 85–120 cells were analyzed to count co-localization events.
Statistical Analysis
All data are presented as mean ± S.E.M. Statistical significance was calculated using a two-tailed Student’s t test. Values were considered significantly different when p was <0.05.
Supporting Information
Effect of inhibition of proteasomal degradation on αsyn solubility and split GFP fluorescence complementation. Representative plot of absolute GFP fluorescence in cells expressing αsyn-GFP11 and GFP1–10 (blue) and TP αsyn-GFP11 and GFP1–10 (red). Cells were incubated for 24 hrs with increasing concentrations of lactacystin (0–5 µM).
(TIF)
Primers used to construct GFP1–10, wt αsyn-GFP11, A53T αsyn-GFP11, TP asyn-GFP11, and αsyn123-GFP11.
(DOC)
Funding Statement
These authors have no support or funding to report.
References
- 1. de Lau LML, Breteler MMB (2006) Epidemiology of Parkinson's disease. The Lancet Neurology 5: 525–535. [DOI] [PubMed] [Google Scholar]
- 2. Moore DJ, West AB, Dawson VL, Dawson TM (2005) MOLECULAR PATHOPHYSIOLOGY OF PARKINSON'S DISEASE. Annual Review of Neuroscience 28: 57–87. [DOI] [PubMed] [Google Scholar]
- 3. Shults CW (2006) Lewy bodies. Proceedings of the National Academy of Sciences of the United States of America 103: 1661–1668. [DOI] [PMC free article] [PubMed] [Google Scholar]
- 4. Chartier-Harlin M–C, Kachergus J, Roumier C, Mouroux V, Douay X, et al. (2004) α-synuclein locus duplication as a cause of familial Parkinson's disease. The Lancet 364: 1167–1169. [DOI] [PubMed] [Google Scholar]
- 5. Singleton AB, Farrer M, Johnson J, Singleton A, Hague S, et al. (2003) α-Synuclein Locus Triplication Causes Parkinson's Disease. Science 302: 841. [DOI] [PubMed] [Google Scholar]
- 6. Kruger R, Kuhn W, Muller T, Woitalla D, Graeber M, et al. (1998) Ala30Pro mutation in the gene encoding alpha-synuclein in Parkinson's disease. Nature genetics 18: 106–108. [DOI] [PubMed] [Google Scholar]
- 7. Polymeropoulos MHLC (1997) Mutation in the alpha-synuclein gene identified in families with Parkinson's disease. Science 276: 2045. [DOI] [PubMed] [Google Scholar]
- 8. Zarranz JJ, Alegre J, Gómez-Esteban JC, Lezcano E, Ros R, et al. (2004) The new mutation, E46K, of α-synuclein causes parkinson and Lewy body dementia. Annals of Neurology 55: 164–173. [DOI] [PubMed] [Google Scholar]
- 9. Li J, Uversky VN, Fink AL (2001) Effect of familial Parkinson's disease point mutations A30P and A53T on the structural properties, aggregation, and fibrillation of human alpha-synuclein. Biochemistry 40: 11604–11613. [DOI] [PubMed] [Google Scholar]
- 10. Narhi L, Wood SJ, Steavenson S, Jiang Y, Wu GM, et al. (1999) Both familial Parkinson's disease mutations accelerate alpha-synuclein aggregation. J Biol Chem 274: 9843–9846. [DOI] [PubMed] [Google Scholar]
- 11. Rideout HJ, Larsen KE, Sulzer D, Stefanis L (2001) Proteasomal inhibition leads to formation of ubiquitin/α-synuclein-immunoreactive inclusions in PC12 cells. Journal of Neurochemistry 78: 899–908. [DOI] [PubMed] [Google Scholar]
- 12. Fleming SM, Salcedo J, Fernagut PO, Rockenstein E, Masliah E, et al. (2004) Early and progressive sensorimotor anomalies in mice overexpressing wild-type human alpha-synuclein. J Neurosci 24: 9434–9440. [DOI] [PMC free article] [PubMed] [Google Scholar]
- 13. Zhou W, Hurlbert MS, Schaack J, Prasad KN, Freed CR (2000) Overexpression of human alpha-synuclein causes dopamine neuron death in rat primary culture and immortalized mesencephalon-derived cells. Brain Res 866: 33–43. [DOI] [PubMed] [Google Scholar]
- 14. Conway KA, Harper JD, Lansbury PT (2000) Fibrils Formed in Vitro from α-Synuclein and Two Mutant Forms Linked to Parkinson's Disease are Typical Amyloid†. Biochemistry 39: 2552–2563. [DOI] [PubMed] [Google Scholar]
- 15. Lindersson E, Beedholm R, Højrup P, Moos T, Gai W, et al. (2004) Proteasomal Inhibition by α-Synuclein Filaments and Oligomers. Journal of Biological Chemistry 279: 12924–12934. [DOI] [PubMed] [Google Scholar]
- 16. Snyder H, Mensah K, Theisler C, Lee J, Matouschek A, et al. (2003) Aggregated and Monomeric α-Synuclein Bind to the S6′ Proteasomal Protein and Inhibit Proteasomal Function. Journal of Biological Chemistry 278: 11753–11759. [DOI] [PubMed] [Google Scholar]
- 17. Outeiro TF, Lindquist S (2003) Yeast Cells Provide Insight into Alpha-Synuclein Biology and Pathobiology. Science 302: 1772–1775. [DOI] [PMC free article] [PubMed] [Google Scholar]
- 18. Serpell LC, Berriman J, Jakes R, Goedert M, Crowther RA (2000) Fiber diffraction of synthetic α-synuclein filaments shows amyloid-like cross-β conformation. Proceedings of the National Academy of Sciences 97: 4897–4902. [DOI] [PMC free article] [PubMed] [Google Scholar]
- 19. Li W, West N, Colla E, Pletnikova O, Troncoso JC, et al. (2005) Aggregation promoting C-terminal truncation of α-synuclein is a normal cellular process and is enhanced by the familial Parkinson's disease-linked mutations. Proceedings of the National Academy of Sciences of the United States of America 102: 2162–2167. [DOI] [PMC free article] [PubMed] [Google Scholar]
- 20. Crowther RA, Jakes R, Spillantini MG, Goedert M (1998) Synthetic filaments assembled from C-terminally truncated α-synuclein. FEBS Letters 436: 309–312. [DOI] [PubMed] [Google Scholar]
- 21. Goldsbury C, Frey P, Olivieri V, Aebi U, Müller SA (2005) Multiple Assembly Pathways Underlie Amyloid-β Fibril Polymorphisms. Journal of Molecular Biology 352: 282–298. [DOI] [PubMed] [Google Scholar]
- 22. Heise H, Hoyer W, Becker S, Andronesi OC, Riedel D, et al. (2005) Molecular-level secondary structure, polymorphism, and dynamics of full-length α-synuclein fibrils studied by solid-state NMR. Proceedings of the National Academy of Sciences of the United States of America 102: 15871–15876. [DOI] [PMC free article] [PubMed] [Google Scholar]
- 23. Baba M, Nakajo S, Tu PH, Tomita T, Nakaya K, et al. (1998) Aggregation of alpha-synuclein in Lewy bodies of sporadic Parkinson's disease and dementia with Lewy bodies. Am J Pathol 152: 879–884. [PMC free article] [PubMed] [Google Scholar]
- 24. Karpinar DP, Balija MBG, Kugler S, Opazo F, Rezaei-Ghaleh N, et al. (2009) Pre-fibrillar [alpha]-synuclein variants with impaired [beta]-structure increase neurotoxicity in Parkinson's disease models. EMBO J 28: 3256–3268. [DOI] [PMC free article] [PubMed] [Google Scholar]
- 25. Wang W, Perovic I, Chittuluru J, Kaganovich A, Nguyen LTT, et al. (2011) A soluble α-synuclein construct forms a dynamic tetramer. Proceedings of the National Academy of Sciences 108: 17797–17802. [DOI] [PMC free article] [PubMed] [Google Scholar]
- 26. Etzkorn M, Böckmann A, Baldus M (2011) Kinetic analysis of protein aggregation monitored by real-time 2D solid-state NMR spectroscopy. Journal of Biomolecular NMR 49: 121–129. [DOI] [PMC free article] [PubMed] [Google Scholar]
- 27. Johnston JA, Ward CL, Kopito RR (1998) Aggresomes: A Cellular Response to Misfolded Proteins. The Journal of Cell Biology 143: 1883–1898. [DOI] [PMC free article] [PubMed] [Google Scholar]
- 28.Taschenberger G, Garrido M, Tereshchenko Y, Bähr M, Zweckstetter M, et al.. (2011) Aggregation of αSynuclein promotes progressive in vivo neurotoxicity in adult rat dopaminergic neurons. Acta Neuropathologica: 1–13. [DOI] [PMC free article] [PubMed]
- 29. Webb JL, Ravikumar B, Atkins J, Skepper JN, Rubinsztein DC (2003) α-Synuclein Is Degraded by Both Autophagy and the Proteasome. Journal of Biological Chemistry 278: 25009–25013. [DOI] [PubMed] [Google Scholar]
- 30. McLean PJ, Kawamata H, Hyman BT (2001) α-Synuclein–enhanced green fluorescent protein fusion proteins form proteasome sensitive inclusions in primary neurons. Neuroscience 104: 901–912. [DOI] [PubMed] [Google Scholar]
- 31. Schwach G, Tschemmernegg M, Pfragner R, Ingolic E, Schreiner E, et al. (2010) Establishment of stably transfected rat neuronal cell lines expressing alpha-synuclein GFP fusion proteins. J Mol Neurosci 41: 80–88. [DOI] [PubMed] [Google Scholar]
- 32. Outeiro TF, Putcha P, Tetzlaff JE, Spoelgen R, Koker M, et al. (2008) Formation of Toxic Oligomeric α-Synuclein Species in Living Cells. PLoS ONE 3: e1867. [DOI] [PMC free article] [PubMed] [Google Scholar]
- 33. Tetzlaff JE, Putcha P, Outeiro TF, Ivanov A, Berezovska O, et al. (2008) CHIP Targets Toxic α-Synuclein Oligomers for Degradation. Journal of Biological Chemistry 283: 17962–17968. [DOI] [PMC free article] [PubMed] [Google Scholar]
- 34. Goncalves SA, Matos JE, Outeiro TF (2010) Zooming into protein oligomerization in neurodegeneration using BiFC. Trends Biochem Sci 35: 643–651. [DOI] [PubMed] [Google Scholar]
- 35. Klucken J, Outeiro TF, Nguyen P, McLean PJ, Hyman BT (2006) Detection of novel intracellular α-synuclein oligomeric species by fluorescence lifetime imaging. The FASEB Journal 20: 2050–2057. [DOI] [PubMed] [Google Scholar]
- 36. Cabantous S, Terwilliger TC, Waldo GS (2005) Protein tagging and detection with engineered self-assembling fragments of green fluorescent protein. Nat Biotech 23: 102–107. [DOI] [PubMed] [Google Scholar]
- 37. Chun W, Waldo GS, Johnson GVW (2007) Split GFP complementation assay: a novel approach to quantitatively measure aggregation of tau in situ: effects of GSK3β activation and caspase 3 cleavage. Journal of Neurochemistry 103: 2529–2539. [DOI] [PubMed] [Google Scholar]
- 38.Shaner NC, Campbell RE, Steinbach PA, Giepmans BN, Palmer AE, et al. (2004) Improved monomeric red, orange and yellow fluorescent proteins derived from Discosoma sp. red fluorescent protein. Nat Biotechnol. United States. 1567–1572. [DOI] [PubMed]
- 39. Lecker SH, Goldberg AL, Mitch WE (2006) Protein Degradation by the Ubiquitin–Proteasome Pathway in Normal and Disease States. Journal of the American Society of Nephrology 17: 1807–1819. [DOI] [PubMed] [Google Scholar]
- 40. Lehman N (2009) The ubiquitin proteasome system in neuropathology. Acta Neuropathologica 118: 329–347. [DOI] [PMC free article] [PubMed] [Google Scholar]
- 41. Soldatenkov VA, Dritschilo A (1997) Apoptosis of Ewing's Sarcoma Cells Is Accompanied by Accumulation of Ubiquitinated Proteins. Cancer Research 57: 3881–3885. [PubMed] [Google Scholar]
- 42. Fenteany G, Standaert R, Lane W, Choi S, Corey E, et al. (1995) Inhibition of proteasome activities and subunit-specific amino-terminal threonine modification by lactacystin. Science 268: 726–731. [DOI] [PubMed] [Google Scholar]
- 43. Shen D, Coleman J, Chan E, Nicholson T, Dai L, et al. (2011) Novel Cell- and Tissue-Based Assays for Detecting Misfolded and Aggregated Protein Accumulation Within Aggresomes and Inclusion Bodies. Cell Biochemistry and Biophysics 60: 173–185. [DOI] [PMC free article] [PubMed] [Google Scholar]
- 44. McNaught KSP, Björklund LM, Belizaire R, Isacson O, Jenner P, et al. (2002) Proteasome inhibition causes nigral degeneration with inclusion bodies in rats. NeuroReport 13: 1437–1441. [DOI] [PubMed] [Google Scholar]
- 45. Waldo GS, Standish BM, Berendzen J, Terwilliger TC (1999) Rapid protein-folding assay using green fluorescent protein. Nat Biotech 17: 691–695. [DOI] [PubMed] [Google Scholar]
- 46. Du H–N, Tang L, Luo X–Y, Li H–T, Hu J, et al. (2003) A Peptide Motif Consisting of Glycine, Alanine, and Valine Is Required for the Fibrillization and Cytotoxicity of Human α-Synuclein†. Biochemistry 42: 8870–8878. [DOI] [PubMed] [Google Scholar]
- 47. Murray IVJ, Giasson BI, Quinn SM, Koppaka V, Axelsen PH, et al. (2003) Role of α-Synuclein Carboxy-Terminus on Fibril Formation in Vitro†. Biochemistry 42: 8530–8540. [DOI] [PubMed] [Google Scholar]
- 48. Koo H–J, Lee H–J, Im H (2008) Sequence determinants regulating fibrillation of human α-synuclein. Biochemical and Biophysical Research Communications 368: 772–778. [DOI] [PubMed] [Google Scholar]
- 49. Volles MJ, Lansbury PT Jr (2007) Relationships between the Sequence of α-Synuclein and its Membrane Affinity, Fibrillization Propensity, and Yeast Toxicity. Journal of Molecular Biology 366: 1510–1522. [DOI] [PMC free article] [PubMed] [Google Scholar]
- 50. Hirsch EC, Hunot S (2009) Neuroinflammation in Parkinson's disease: a target for neuroprotection? The Lancet Neurology 8: 382–397. [DOI] [PubMed] [Google Scholar]
- 51. Hashimoto M, Hsu LJ, Xia Y, Takeda A, Sisk A, et al. (1999) Oxidative stress induces amyloid-like aggregate formation of NACP/[alpha]-synuclein in vitro. NeuroReport 10: 717–721. [DOI] [PubMed] [Google Scholar]
- 52. Gao H-M, Kotzbauer PT, Uryu K, Leight S, Trojanowski JQ, et al. (2008) Neuroinflammation and Oxidation/Nitration of α-Synuclein Linked to Dopaminergic Neurodegeneration. The Journal of Neuroscience 28: 7687–7698. [DOI] [PMC free article] [PubMed] [Google Scholar]
- 53. Jaskolski F, Mulle C, Manzoni OJ (2005) An automated method to quantify and visualize colocalized fluorescent signals. Journal of Neuroscience Methods 146: 42–49. [DOI] [PubMed] [Google Scholar]
Associated Data
This section collects any data citations, data availability statements, or supplementary materials included in this article.
Supplementary Materials
Effect of inhibition of proteasomal degradation on αsyn solubility and split GFP fluorescence complementation. Representative plot of absolute GFP fluorescence in cells expressing αsyn-GFP11 and GFP1–10 (blue) and TP αsyn-GFP11 and GFP1–10 (red). Cells were incubated for 24 hrs with increasing concentrations of lactacystin (0–5 µM).
(TIF)
Primers used to construct GFP1–10, wt αsyn-GFP11, A53T αsyn-GFP11, TP asyn-GFP11, and αsyn123-GFP11.
(DOC)