

Abstract
STAT5 is a transcription factor essential for hematopoietic physiology. STAT5 functions to transduce signals from cytokines to the nucleus where it regulates gene expression. Although several important transcriptional targets of STAT5 are known, most remain unidentified. To identify novel STAT5 targets, we searched chromosomes 21 and 22 for clusters of STAT5 binding sites contained within regions of interspecies homology. We identified four such regions, including one with tandem STAT5 binding sites in the first intron of the NCAM2 gene. Unlike known STAT5 binding sites, this site is found within a very large intron and resides ~200 kb from the first coding exon of NCAM2. We demonstrate that this region confers STAT5-dependent transcriptional activity. We show that STAT5 binds in vivo to the NCAM2 intron in the NKL natural killer cell line and that this binding is induced by cytokines that activate STAT5. Neither STAT1 nor STAT3 bind to this region, despite sharing a consensus binding sequence with STAT5. Activation of STAT4 and STAT5 causes the accumulation of both of these STATs to the NCAM2 regulatory region. Therefore, using an informatics based approach to identify STAT5 targets, we have identified NCAM2 as both a STAT4- and STAT5-regulated gene, and we show that its expression is regulated by cytokines essential for natural killer cell survival and differentiation. This strategy may be an effective way to identify functional binding regions for transcription factors with known cognate binding sites anywhere in the genome.
STAT2 transcription factors are a family of seven related proteins that are involved in a variety of essential cellular processes. STATs are activated by phosphorylation induced by cytokines and growth factors and regulate gene transcription by binding to DNA regulatory regions. STATs have been implicated in numerous solid as well as hematopoietic cancers (1–3). One well studied example is chronic myelogenous leukemia, in which the Bcr/Abl oncogene causes the constitutive activation of STAT5, which directly leads to continuous up-regulation of antiapoptotic genes, such as bcl-x (4).
STAT5 refers to two different genes, STAT5a and STAT5b, which encode highly related proteins (5). STAT5a and STAT5b null mice show both overlapping and distinct phenotypes, suggesting that their transcriptional targets may not be identical (6–8). However, we have shown previously that both STAT5a and STAT5b can bind to the same regulatory region when both are activated, although there are differences in the temporal binding patterns of STAT5a and STAT5b (9). Thus, both STAT5 proteins seem to bind to the same targets, and any differences between STAT5a and STAT5b may arise from differential expression or differences in kinetics of DNA binding.
An essential component to understanding STAT5 function is to have a more complete picture of STAT5 transcriptional targets as well as to have a greater understanding of the STAT5 binding sites within these targets. Regulatory regions have traditionally been thought to be associated with the 5′-end of genes, and thus, searches for transcription factor binding sites have often been confined to this region. Identifying functional regulatory elements in the 5′ region has yielded valuable insight into transcriptional regulation. However, functional transcription factor binding sites can be found far from the 5′-end of the gene. For example, the STAT5 binding site for the insulin-like growth factor-1 gene is located ~75 kb from the 5′-end (10). In addition, most functional STAT5 binding sites appear to be located within introns, with a bias toward the first intron (9). Therefore, our emerging knowledge of transcription factor binding sites necessitates looking beyond the immediate 5′ region of particular genes.
Evolutionary pressures require the conservation of important non-protein-coding regulatory regions, and thus, transcription factor binding sites are often conserved across species (11). To identify functional STAT5 binding sites, we made use of the fact that transcription factor binding sites can be identified in regions of sequence conservation (12). We focused on chromosomes 21 and 22, which are two small, well characterized chromosomes. Given that STAT5 can bind to cognate DNA sequences in tandem (13–15), we searched for regions of high homology that also contained two STAT5 consensus binding sites. Using this strategy, we identified such a sequence in the first intron of NCAM2 (neural cell adhesion molecule 2). We demonstrate that the identified consensus sites are functional, and we show that NCAM2 is expressed when STAT5 is activated. Last, using chromatin immunoprecipitation (ChIP) assays, we show that STAT5 binds to this site in vivo, conclusively demonstrating that this region is a functional STAT5 binding site. Despite sharing a consensus binding sequence, neither STAT1 nor STAT3 is able to bind to this site in NKL cells. However, we show that STAT4 can bind to the NCAM2 intronic element. Thus, combining bioinformatic techniques with knowledge of STAT5 binding sites can be used to identify novel STAT5 targets and to better understand STAT-mediated transcriptional regulation. Furthermore, this technique should be applicable to any transcription factor for which binding sequences have been defined.
MATERIALS AND METHODS
Cell Lines
The human natural killer cell line NKL (16) was maintained in RPMI with 10% fetal calf serum supplemented with 25 units/ml recombinant human IL-2 (R&D Systems, Minneapolis, MN). Human breast cancer T47D cells and human 293 cells were obtained from ATCC (Manassas, VA) and were maintained in Dulbecco’s modified Eagle’s medium supplemented with 10% fetal calf serum.
Antibodies and Cytokines
Antibodies recognizing STAT5a (sc-1081), total STAT5 (sc-835), STAT4 (sc-486), STAT1 (sc-346), STAT3 (sc-482), p300 (sc-585), and RNA polymerase II (Pol II) (sc-9001) were obtained from Santa Cruz Biotechnology, Inc. (Santa Cruz, CA). Anti-STAT5b (catalog number 13-5300) and anti-phospho-STAT1 (catalog number 33-3400) were obtained from Invitrogen. Anti-phospho-STAT5 (catalog number 935-1L), and anti-phospho-STAT3 (catalog number 9131) were obtained from Cell Signaling (Beverly, MA). Normal rabbit IgG was obtained from Caltag (Burlingame, CA). Recombinant human IL-2, IL-6, IFN-α, IFN-γ, and prolactin were obtained from R & D Systems (Minneapolis, MN). Recombinant human IL-10 was obtained from Peprotech (Rocky Hill, NJ).
Cell Stimulations
NKL cells were starved of IL-2 for 1 day and then stimulated with 50 units/ml IL-2, 10 ng/ml IL-6, 100 ng/ml IL-10, 50,000 units/ml IFN-α, or 500 units/ml IFN-γ. Cells were stimulated for 15 min for Western blots and immunoprecipitations, 30 min for ChIP, and from 1 to 24 h for RT-PCR.
Candidate STAT5 Binding Site Prediction
We searched the STAT5 consensus binding sequence, TTCN3GAA, along the repeat-masked and coding region-masked human chromosomes 21 and 22 to find all of the possible STAT5 consensus binding sites. The repeat-masked chromosomes and associated annotation were downloaded from the University of California Santa Cruz Genome Browser (available on the World Wide Web at genome.ucsc.edu). The RefSeq table was used to mask the coding regions. We further narrowed down the list of potential STAT5 binding sites by incorporating sequence conservation between humans and either mice or rats. The human/mouse/rat whole genome alignment (17) was extracted from the Berkeley Genome Pipeline (available on the World Wide Web at pipeline.lbl.gov/). The conservation score of each STAT5 binding site was defined as the average sequence identity ((number of matched nucleotides − number of Indels)/25, where an “Indel” represents an insertion or a deletion) of a 25-mer window centered at the corresponding binding site. Consensus sites were then manually checked using the May 2004 assembly of the UCSC Genome Browser. Those having 100% homology of both STAT5 consensus sequences between humans, chimpanzees, mice, and rats were selected for subsequent analysis.
Reporter Gene Construction
Human breast DNA (BioChain, Hayward, CA) was amplified with primers spanning the conserved NCAM2 intronic region with the following sequences: ACACATCCTTCATACCAGGAAA and TGGCCACCTATTGGTTTCTATC. Amplification was done using Pfu Ultra (Stratagene, La Jolla, CA), gel-purified using a gel extraction kit (Qiagen, Valencia, CA), and ligated into pCR-Blunt II-TOPO using the Zero Blunt TOPO cloning kit (Invitrogen). The NCAM2 intronic insert was then isolated by digesting with XhoI and HindIII (New England Biolabs, Beverly, MA), the fragments were gel-purified and ligated into XhoI/HindIII-digested pLuc-MCS (Stratagene, La Jolla, CA). STAT5a1*6 was subcloned into EcoRI/NotI-digested pIRES-puro3 (Clontech, Mountain View, CA).
Mutagenesis and Sequencing
Mutagenesis was performed using the Stratagene QuikChange site-directed mutagenesis kit according to the manufacturer’s instructions. Mutation of the first STAT5 consensus site in NCAM2 was made using the following primers: sense primer, 5′-GAAACGCTGCGTGAGGGAACTCAGAAGTCGCATGAC-3′; antisense primer, 5′-GTCATGCGACTTCTGAGTTCCCTCACGCAGCGTTTC-3′. Mutation of the second site was made using the following: sense primer, 5′-CGTCAACTCTCAGGAATGGGAACTGAGAATTCCAAGTAAGAC-3′; antisense primer, 5′-GTCTTACTTGGAATTCTCAGTTCCCATTCCTGAGAGTTGACG-3′. The bases that were changed from wild type are underlined. Miniprep DNA was isolated using a Qiagen DNA Miniprep kit. Sequencing was performed at the Dana Farber Cancer Institute Molecular Biology Core Facility.
Transient Transfections and Reporter Gene Assays
5 × 10⁴ T47D cells were transfected with 1 μg of firefly luciferase vector and 0.1 μg of Renilla luciferase vector (pRL-TK; Promega, Madison, WI) using Lipofectamine 2000 (Invitrogen). 24 h after transfection, cells were stimulated with 100 ng/ml prolactin for 16 h, and luciferase activity was quantitated on a Luminoskan Ascent luminometer (Labsystems, Helsinki, Finland) using a dual luciferase reporter assay kit (Promega, Madison, WI) according to the manufacturer’s protocol. 293 cells were transfected with 1 μg of firefly luciferase, 0.1 μg of Renilla, and 1 μg of pIRES puro or pIRES puro STAT5a1*6 and analyzed for luciferase expression 24 h after transfection. All firefly luciferase activity was normalized to Renilla luciferase. Each reporter assay was performed in triplicate and was repeated in at least four different experiments.
RT-PCR
RNA was extracted using an RNeasy Kit (Qiagen, Valencia, CA). cDNA was made using the Taqman reverse transcription kit (Applied Biosystems, Foster City, CA). Quantitative real time PCR was performed in triplicate using SYBR green master mix (Applied Biosystems) on a model 7500 real time PCR system (Applied Biosystems). Primer sequences were as follows: human NCAM2 (AGTGGCTCCAGTGGCAAA and GGCTCCCATCTTCGTGATTA), human IFN-γ (GAGTGTGGAGACCATCAAGGA and CATGTATTGCTTTGCGTTGG), human cytokine-inducible SH2 domain protein (CIS) (CTGCTGTGCATAGCCAAGAC and GTGCCTTCTGGCATCTTCTG), and human glyceraldehyde-3-phosphate dehydrogenase (GAPDH) (AATCCCATCACCATCTTCCA and TGGACTCCACGACGTACTCA). Data are expressed as the mean-fold change ± S.E. of three replicates. Each assay was repeated at least twice.
Western Blotting and Immunoprecipitation
Lysates were run on an 8% polyacrylamide gel, transferred to nitrocellulose, blocked in 5% milk for 1 h, and incubated with the appropriate antibodies overnight. The blots were washed three times with TBST (25 mm Tris, pH 8.0, 125 mm NaCl, and 0.1% Tween 20), incubated with the appropriate horseradish peroxidase-labeled secondary antibody for 1 h, washed three times with TBST, and developed using Western blot chemiluminescence reagent Plus (PerkinElmer Life Sciences).
Chromatin Immunoprecipitation
ChIP assays were performed as previously described (9) with the following changes. 0.37% formaldehyde was used for cross-linking, and sonication was performed using a Fisher sonic dismembranator, model 500, with five bursts of 15 s at a setting of 10%. 10 μg of tRNA and 10 μg of bovine serum albumin were included when the protein A/G beads were added to the immunoprecipitation. For semiquantitative PCR, the primers were as follows: human NCAM2 STAT5 binding region, ACACATCCTTCATACCAGGAAA and TGGCCACCTATTGGTTTCTATC; human NCAM2 negative control region, CTGCACATGATCCATCTTCAAT and CCAGCAATAACTAGGGCATCA. Quantitative real time PCR was performed using the following primers: human NCAM2 STAT5 binding region, ACTTGCATGGGTCACAACAC and CAGGCATGGGGTTGTCTTAC. Data from three replicates were normalized to input and expressed relative to nonspecific IgG. Each assay was performed at least twice.
RESULTS
Identification of STAT5 Consensus Sites on Human Chromosomes 21 and 22
To identify novel STAT5 consensus sites, we chose to analyze chromosomes 21 and 22, which are the two smallest human chromosomes. Low stringency searches identified thousands of potential binding sites. Although many of these are probably true STAT binding sites, we increased our stringency to achieve an experimentally feasible number of STAT binding sites. We searched for the STAT5 consensus binding site TTCN3GAA (5, 18, 19), in noncoding regions of 200 bases or less with greater than 70% homology between humans and mice or rats. Given that STAT5 can form tetramers and contact DNA at two binding sites (13–15), we focused on regions that contained two STAT5 consensus sites. We identified 81 sites that met these criteria. Since functional STAT5 regulatory regions are likely to be conserved among diverse species, we further considered only those that had 100% homology at both STAT5 consensus sites between humans, chimpanzees, mice, and rats. Four regions were identified in this search, one near the 3′-end of an uncharacterized clone, accession number BC032403 (located on chromosome 21 at bases 36247794–36247969, May 2004, UCSC genome assembly), and a second ~20 kb 3′ of the PCP4 gene, accession number X93349 (located on chromosome 21 at bases 40242743–40242862, May 2004, UCSC genome assembly). We also identified conserved STAT5 consensus sites within the promoter of the oncostatin M gene as well as the first intron of NCAM2.
Oncostatin M has previously been reported to be a STAT5 target gene (20, 21), demonstrating that this methodology identifies bona fide STAT5-regulated genes. NCAM2, by contrast, had not been known to be STAT5-responsive. Of note, NCAM2 is highly homologous to NCAM1 (CD56), which is an essential component of natural killer (NK) cell biology (22). The cytokine IL-2, which is a key regulator of NK cell function, is known to be a potent activator of STAT5 (23). Thus, it was plausible that NCAM2 would be a STAT5 target gene. Furthermore, STAT5 binding sites are often located in introns (9), and the STAT5 binding sites identified in NCAM2 are found within the first intron of this gene (located on chromosome 21 at bases 21494503 to 21494577 of the May 2004 UCSC genome assembly) (Fig. 1). Therefore, we focused on understanding STAT5 regulation of NCAM2.
FIGURE 1. NCAM2 genomic structure.

The upper panel shows a schematic of the NCAM2 gene with the approximate locations of exons (boxes) and introns (horizontal lines). The location of the STAT5 consensus binding sites is indicated with an arrow. The distances of the STAT5 consensus sites to the first and second exons are noted below the gene structure. The lower panel shows the exact sequence identified in the homology screen using a screen capture of the UCSC genome browser and shows the sequence homology between five different species. The STAT5 consensus sites are boxed. The base pair numbers and the genomic assembly from the UCSC genome browser for each species is as follows: human, chr21:21,494,503–21,494,577 (May 2004); chimpanzee, chr22: 21,644,947–21,645,021 (November 2003); mouse, chr16:81,746,580–81,746,651 (May 2004); rat, chr11:20,599,259–20,599,330 (June 2003); dog, chr31: 20,113,821–20,113,895 (July 2004).
NCAM2 Is Expressed in NKL Cells
To determine if NCAM2 is expressed in response to STAT5, we utilized NKL cells, which are an IL-2-dependent NK cell line (16), in which both STAT5a and STAT5b can be inducibly activated (Fig. 2a). To determine if NCAM2 was expressed in NKL cells, we starved and then stimulated the cells with IL-2 and performed RT-PCR analysis. IL-2 stimulation caused a dramatic up-regulation of NCAM2 expression, with increased expression starting at 1 h and peak expression at 7 h (Fig. 2b). A dose response was performed, which shows that NCAM2 is induced with IL-2 concentrations as low as 0.05 units/ml, with peak NCAM2 expression levels as low as 5 units/ml (Fig. 2c). Therefore, IL-2, a cytokine that activates STAT5 in NKL cells, induces the expression of NCAM2.
FIGURE 2. STAT5a and STAT5b activation by IL-2 leads to NCAM2 expression in NKL cells.

a, starved NKL cells were either treated with IL-2 for 15 min or left untreated. Immunoprecipitation of STAT5a and STAT5b using specific antibodies was performed, followed by Western blot analysis with the indicated antibodies. b, starved NKL cells were treated with IL-2 for the indicated times. NCAM2 expression was analyzed by quantitative real time PCR. GAPDH was used as an invariant control. c, starved NKL cells were treated for 7 h with IL-2 at the indicated concentrations (units/ml). NCAM2 expression was analyzed by quantitative real time PCR. Each RT-PCR experiment was repeated two times.
The NCAM2 Intronic Region Confers Transcriptional Responsiveness
To demonstrate that the two STAT5 consensus sites within the NCAM2 intron are functional, we inserted this region upstream of a luciferase reporter gene (Fig. 3a). It is extremely difficult to introduce exogenous DNA into NKL cells by transfection or retroviral infection (data not shown). Thus, we utilized the human mammary tumor cell line T47D, in which STAT5 phosphorylation can be induced by prolactin (24). When the reporter construct containing the NCAM2 intronic region was introduced into T47D cells, there was only a low level of luciferase activity compared with empty vector (Fig. 3b). However, when T47D cells were stimulated with prolactin, luciferase activity was induced 9.7-fold (Fig. 3b). To determine if this reporter activity was due directly to STAT5, we used a constitutively activated form of STAT5, STAT5a1*6 (25), and transfected this, in combination with the NCAM2 intronic luciferase construct, into 293 cells. Consistent with our observations in T47D cells, the construct containing the STAT5 consensus sites showed a 12.2-fold increase in luciferase activity when co-transfected with STAT5a1*6 when compared with cells co-transfected with the empty vector (Fig. 3c). Therefore, the highly conserved sequence in the first intron of NCAM2 confers STAT5 responsiveness.
FIGURE 3. The NCAM2 intronic region confers transcriptional activity that depends on the STAT5 binding sites.

a, schematic of the luciferase construct containing the NCAM2 intronic region. Numbering is in reference to the first nucleotide of the NCAM2 mRNA sequence (accession number U75330). The wild type (wt) consensus binding sites are indicated as well as the nucleotides mutated in each construct. b, T47D cells were transfected with empty vector (pLuc) or with a luciferase construct containing the NCAM2 intronic region (NCAM2-Luc) and then were stimulated with prolactin overnight or were left untreated, and luciferase activity was measured. c, 293 cells were transfected with the NCAM2 intronic region together with either an empty vector (NCAM2-Luc/vector) or a STAT5a1*6 expression construct (NCAM2-Luc/STAT5a1*6), and luciferase activity was quantitated 24 h after transfection. d, T47D cells were transfected with either the wild type NCAM2 intronic element (NCAM2-Luc) or the NCAM2 intronic element with mutations in STAT5 consensus site 1 (Mut1-Luc), STAT5 consensus site 2 (Mut2-Luc), or both STAT5 consensus sites (Mut1 + 2-Luc) and either left untreated (light bars) or treated with prolactin (dark bars). Luciferase activity was determined and was normalized to untreated for each construct. Each luciferase assay was repeated four times.
The STAT5 Consensus Sites in the NCAM2 Intronic Element Are Necessary for Transcriptional Activity
To determine the contribution of each STAT5 consensus site to the transcriptional activity of the NCAM2 intronic region, we mutated the first two nucleotides in each site and examined the ability of this mutated element to induce transcription using luciferase assays (Fig. 3a). Mutating either site individually resulted in a clear reduction in prolactin-induced luciferase activity, from 14.5-fold for the wild type construct, to 2.6-fold for site 1 and 2.4-fold for site 2 (Fig. 3d). When both sites were mutated in the same construct, prolactin-induced luciferase expression was completely abolished (Fig. 3d). Thus, the two STAT5 consensus sites confer transcriptional activity, and mutations in these sites abolish this activity.
STAT5 Binds to the NCAM2 Intronic Region in Vivo
The NCAM2 gene is expressed after activation of STAT5, and the region containing the two STAT5 consensus sites in the NCAM2 intron shows STAT5-dependent transcriptional activity. To demonstrate that the NCAM2 intronic element functions as a STAT5 binding region in vivo, we performed a ChIP assay, which has the advantage of allowing an analysis of the binding activity of a transcription factor in living cells. Given that STAT5a and STAT5b often bind to the same region (9), we wanted to determine if both could bind the NCAM2 intronic element. Thus, we performed ChIP using antibodies specific for STAT5a and STAT5b, which revealed that both STAT5 proteins were inducibly bound to this element (Fig. 4a). To exclude the possibility that STAT5 was binding nonspecifically, we designed PCR primers to a region of low homology ~4 kb from the identified STAT5 binding site (chromosome 21, bases 21498297–21498518 of the May 2004 UCSC genome assembly). Using these primers, no DNA was amplified from a ChIP of STAT5a and STAT5b (Fig. 4a). This further demonstrates that STAT5 binding to the region of homology in the NCAM2 intron is specific to this site. Therefore, STAT5 binds to a region containing two highly conserved STAT5 consensus sites within the first intron of the NCAM2 gene, and this binding is dependent upon IL-2 activation of STAT5.
FIGURE 4. STAT5a, STAT5b, and components of the basal transcriptional machinery bind to the NCAM2 intronic element in vivo.
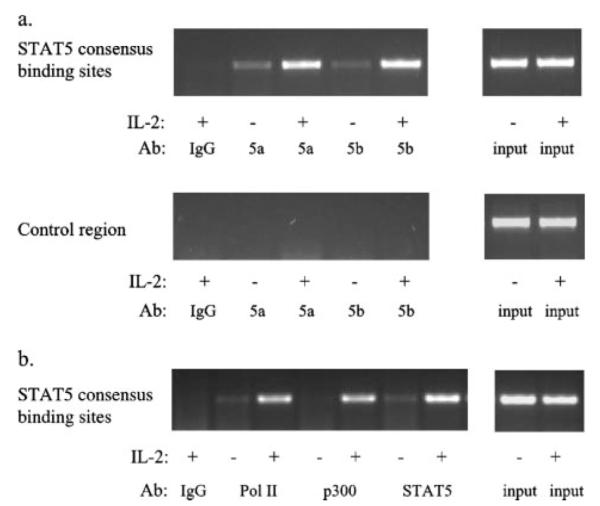
a, ChIP assays were performed on NKL cells that had been starved and then left untreated or stimulated with IL-2 for 30 min. Immunoprecipitations were performed using antibodies (Ab) to STAT5a, STAT5b, or a nonspecific antibody (IgG). The upper panel shows PCR analysis using primers specific for the NCAM2 intronic region, whereas the lower panel shows PCR analysis using primers specific for a control region. The right panels show PCR of input DNA. b, ChIP analysis was performed using antibodies to Pol II, p300, total STAT5, or a nonspecific IgG. PCR was performed on the NCAM2 intronic region using both ChIP product (left) and input DNA (right). Each ChIP experiment was repeated two times.
RNA Polymerase II and p300 Are Recruited to the Intronic Element
Having shown that STAT5 is inducibly bound to the NCAM2 intronic element after IL-2 stimulation, we wanted to determine if other components of the transcriptional apparatus are recruited to this site. Therefore, we performed ChIP assays using antibodies to Pol II, a component of the basal transcriptional machinery, and p300, a known coactivator of STAT5-mediated transcription (26), as well as an antibody that recognizes both STAT5a and STAT5b (total STAT5). Although far from the 5′-end of the gene, both Pol II and p300 were recruited to the NCAM2 intronic element coincident with STAT5 binding (Fig. 4b). Thus, IL-2 activation not only recruits STAT5 to this region of NCAM2 containing conserved STAT5 consensus sites, but IL-2 activation also causes the recruitment of other components of STAT5-mediated transcription as well. The recruitment of Pol II and p300 further demonstrates that functional STAT5 regulatory regions are found outside of traditional promoter regions.
Neither STAT1 nor STAT3 Bind to the NCAM2 Intronic Region
Since other STAT proteins share the TTCN3GAA STAT consensus binding site, we wanted to determine if other STATs are able to bind to the NCAM2 intronic region. In addition to activating STAT5, IL-2 activates STAT1 and STAT3 (27). To determine whether each of these STATs can bind to the NCAM2 intronic region, we performed ChIP analysis on IL-2-treated NKL cells, using antibodies specific for STAT1, STAT3, or total STAT5. Although IL-2 treatment resulted in the robust accumulation of total STAT5 on the NCAM2 intronic element, there was no significant recruitment of STAT1 or STAT3 after IL-2 treatment (Fig. 5). Thus, although multiple STATs can be activated by IL-2 in NKL cells, only STAT5 binds inducibly to the NCAM2 intronic element.
FIGURE 5. Neither STAT1 nor STAT3 bind to the NCAM2 STAT binding region.
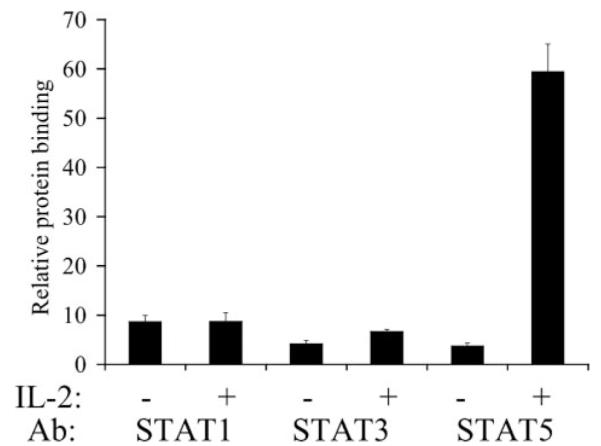
ChIP assays were performed on NKL cells that had been starved and then left untreated or stimulated with IL-2 for 30 min. Immunoprecipitations were performed using antibodies (Ab) specific for STAT1, STAT3, STAT5, or a nonspecific antibody (IgG). DNA was quantitated by real time PCR and was normalized to input and expressed relative to nonspecific IgG. Each ChIP experiment was repeated three times.
IFN-α Induces NCAM2 Expression
To understand the physiological significance of NCAM2 induction, we analyzed STAT activation in response to other cytokines in NKL cells. Although competent to activate STAT1 and STAT3 in other cells, neither IFN-γ nor IL-6 activated these STATs in NKL cells (Fig. 6a). IL-10 activated only STAT1 and STAT3 (Fig. 6a), whereas IFN-α activated STAT1, STAT3, STAT4, and STAT5 (28) (Fig. 6, a and b).
FIGURE 6. IFN-α induces expression of NCAM2.

a, starved NKL cells were either treated with the indicated cytokine for 15 min or left untreated. Western blots were performed with the indicated antibodies. b, starved NKL cells were treated with IL-2 or IFN-α for 15 min or left untreated. Immunoprecipitation was performed using an antibody to STAT4. Western blot analysis was performed against phosphotyrosine (P-Tyr) or STAT4. c, starved NKL cells were treated with the indicated cytokines for 7 h, and NCAM2 expression was analyzed by quantitative real time PCR. GAPDH was used as an invariant control. d, starved NKL cells were treated for the indicated times with IFN-α. NCAM2 expression was analyzed by quantitative real time PCR. GAPDH was used as an invariant control. Each RT-PCR experiment was repeated two times.
We then determined if treatment with these cytokines also leads to the expression of NCAM2 in NKL cells. IL-10 stimulation did not lead to NCAM2 expression; nor did it enhance IL-2-mediated expression of this gene (Fig. 6c). However, IFN-α treatment resulted in robust NCAM2 expression with kinetics similar to, although slightly faster than, IL-2 treatment (Fig. 6d). To determine the composition of STATs that were bound to the NCAM2 intronic element in response to IFN-α, we performed ChIP analysis using antibodies specific for the various STATs. As with IL-2, IFN-α treatment does not lead to the recruitment of STAT1 or STAT3 to the NCAM2 intronic element (data not shown). However, IFN-α treatment resulted in the recruitment of both STAT4 and STAT5 (Fig. 7). Therefore, although IL-2 and IFN-α activate multiple STATs in NKL cells, only STAT4 and STAT5 bind inducibly to the NCAM2 intronic element.
FIGURE 7. STAT4 and STAT5 bind to the NCAM2 intronic region after IFN-α stimulation.
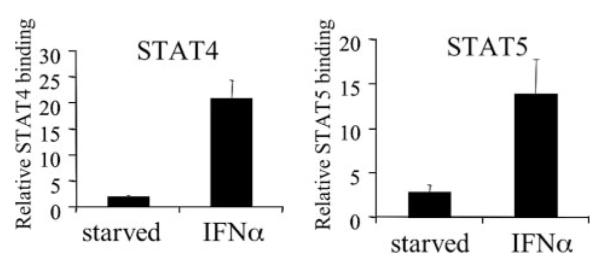
ChIP assays were performed on NKL cells that had been starved and then left untreated or had been stimulated with IFN-α for 30 min. Immunoprecipitations were performed using antibodies specific for STAT4, STAT5, or a nonspecific antibody (IgG). DNA was quantitated by real time PCR and was normalized to input and expressed relative to nonspecific IgG. Each ChIP experiment was repeated three times.
NCAM2 Expression Is Enhanced by the Combination of IL-2 and IFN-α
Both IL-2 and IFN-α stimulation result in expression of NCAM2, yet the composition of STATs that are recruited to this regulatory element differs between the two stimuli. Thus, we hypothesized that the combination of both cytokines might lead to an enhancement of NCAM2 expression. Therefore, we determined NCAM2 expression after stimulation with IL-2, IFN-α, or a combination of both cytokines. Each cytokine alone showed a robust induction of NCAM2 expression, ~19-fold greater than starved NKL cells (Fig. 8a). However, the combination of IL-2 and IFN-α resulted in a 75-fold increase in NCAM2 expression (Fig. 8a), suggesting a synergism between IL-2 and IFN-α on expression of this gene.
FIGURE 8. IL-2 and IFN-α synergize to regulate NCAM2 expression.

a, starved NKL cells were treated with the indicated cytokines for 7 h. NCAM2 expression was analyzed by quantitative real time PCR. GAPDH was used as an invariant control. b and c, starved NKL cells were treated with the indicated cytokine for 2 h. The expression of IFN-γ (b) and CIS (c) was analyzed by quantitative real time PCR. GAPDH was used as an invariant control. d, ChIP assays were performed on NKL cells that had been starved and then left untreated or stimulated with the indicated cytokines for 30 min. Chromatin immunoprecipitations were performed using antibodies specific for STAT4, STAT5, or a nonspecific antibody (IgG). Data were normalized to input and expressed relative to nonspecific IgG. Each RT-PCR and ChIP experiment was repeated two times.
To determine if genes known to be important in the biology of NK cells showed a similar response to IL-2 and IFN-α, we examined expression of IFN-γ, which is expressed by natural killer cells and is essential for the immunomodulatory function of these cells (22). Furthermore, IFN-γ is a STAT5-regulated gene in IL-2-stimulated NK cells (29), although its expression has not previously been analyzed in the NKL cell line. Stimulation with either IL-2 or IFN-α resulted in the expression of the IFN-γ gene (Fig. 8b). Importantly, the simultaneous stimulation with both cytokines resulted in an increase in IFN-γ expression that was more than additive compared with the level with either cytokine alone. We also examined CIS, a target of STAT5 in a variety of hematopoietic and epithelial cells (30). Although both IL-2 and IFN-α induced CIS expression, there was no synergism when both cytokines were used together (Fig. 8c). Thus, the synergy between IL-2 and IFN-α in promoting NCAM2 expression is similar to the regulation of expression of IFN-γ, a STAT5-regulated gene known to be essential for the function of natural killer cells. However, this property is not exhibited by all STAT5 target genes.
Simultaneous Stimulation with IL-2 and IFN-α Results in Maximal Binding of STAT4 and STAT5
Given that the combination of IL-2 and IFN-α resulted in a synergistic induction of NCAM2 expression, we wanted to determine if this correlated with changes in STAT binding to the NCAM2 intronic region. We performed ChIP assays on NKL cells treated with IL-2, IFN-α, or the combination. None of these treatments resulted in any binding of STAT1 or STAT3, and, although there was binding of both STAT5a and STAT5b, there was no change in their composition on the NCAM2 STAT binding region (data not shown). Thus, changes in the binding of these STATs do not account for the difference in NCAM2 expression seen after IL-2 and IFN-α stimulation.
We next analyzed the binding behavior of STAT4 and STAT5 after IL-2, IFN-α, and IL-2/IFN-α stimulation (Fig. 8d). The induction of STAT5 binding is greater after IL-2 stimulation compared with IFN-α stimulation. The combination of both IL-2 and IFN-α induced STAT5 binding by an amount similar to IL-2 stimulation alone. No STAT4 binding was observed with IL-2 stimulation, although IFN-α stimulation resulted in significant STAT4 binding. Therefore, the binding of STAT4 after IFN-α stimulation may compensate for the lower amount of STAT5 bound, resulting in an equal amount of NCAM2 mRNA expression as compared with IL-2 stimulation, in which only STAT5 binds. When NKL cells are stimulated with both cytokines, there is close to maximal binding of both STAT4 and STAT5, resulting in enhanced NCAM2 expression. Thus, the DNA binding activity of STAT4 and STAT5 on NCAM2 is reflected in the cytokine-induced expression of this gene.
DISCUSSION
STAT5 is a transcription factor important for normal and malignant physiology of hematopoietic cells (31). Previously, we identified many novel STAT5-regulated genes using a ChIP-based gene identification strategy (9), and we showed that functional STAT5 binding sites in these genes are often outside of traditional promoters. In addition, several recent publications have suggested that the number of binding sites for a particular transcription factor might number in the thousands (32–34). Although ChIP-based gene identification strategies (9, 35) identified many new STAT5 targets, no known targets were identified, suggesting that these screens did not isolate all STAT5 targets.
We focused on chromosomes 21 and 22, which contain ~2% of the total number of genes in the genome (36). Thus, extrapolating from the high stringency screen presented here, there may be about 200 highly conserved tandem STAT5 binding sites, which probably underestimates the number of functional STAT5 binding sites in the genome. Furthermore, we focused on one STAT5 target, NCAM2, in an NK cell line. However, NCAM2 may not be expressed in all cells. It is likely that many conserved regulatory regions are functional and lead to gene expression only in specific cell types, either due to chromatin modifications or the lack of expression of the necessary co-regulatory factors.
To study the transcriptional regulation of NCAM2, we employed the natural killer cell line NKL, which is an important model of STAT5 activation (23). In particular, IL-2 results in the robust activation of STAT5 in NKL cells, and this cytokine is essential for the proliferation, survival, and differentiation of NK cells in vivo (22). Since NCAM2 is regulated by STAT5 in NKL cells, it may be important for the function of NK cells. NCAM2 is related to NCAM1, also known as CD56, which is a phenotypic marker of NK cells (22). NCAMs are cell adhesion molecules that facilitate cell-to-cell interactions to mediate various physiological responses, such as differentiation, proliferation, migration, and survival, and altered expression of these proteins has been documented in a variety of tumors (37–40).
Since the discovery that NCAM1/CD56 is a prominent marker of NK cells, it was hypothesized that NCAM1/CD56 might facilitate cell-to-cell interactions in the immune system. Indeed, this was shown to be the case (41, 42). NK cells were tested for their cytotoxic activity against two cholangiocellular carcinoma cell lines, one being CD56+ and the other being CD56−. CD56+ NK cells showed cytotoxic activity against the CD56+ cells but not the CD56− cells, and the cytotoxic activity against the CD56+ cells could be inhibited by the addition of a polyclonal antibody against CD56. Cytotoxic NK cells interact with potential targets through various cell surface molecules, and these interactions send positive and negative signals allowing the NK cell to appropriately target cells to be killed while leaving normal cells intact. NCAM1/CD56 is an essential component of this process, and it is likely that the related protein, NCAM2, is also involved in cellular recognition by NK cells.
Both IL-2 and IFN-α can regulate NCAM2 gene expression, and the combination of these cytokines leads to the synergistic induction of gene expression. It is known that combinations of cytokines can lead to the synergistic expression of genes essential for NK cell function (43). One such gene is IFN-γ, which is a direct target of STAT5 (29). Intriguingly, a combination of cytokines that leads to the synergistic induction of NCAM2 expression in NKL cells also leads to the synergistic induction of IFN-γ expression but not that of an unrelated STAT5 target gene. Thus, the expression pattern of NCAM2 mirrors that of a STAT5-regulated gene known to be essential for NK cell physiology.
Although the STAT5 consensus binding sequence is shared by other STATs (18), neither STAT1 nor STAT3 is recruited to the NCAM2 intronic element. However, in addition to STAT5, STAT4 can bind to this element. Therefore, in NKL cells, the NCAM2 intronic element is only competent to bind to STAT4 and STAT5. The nature of this specificity presumably lies outside the STAT consensus sites themselves and may require the recruitment of other transcriptional cofactors.
STAT5 can form tetramers between two dimers bound to nearby binding sites (13–15). Tetramer formation has also been shown for STAT3 (44). The bioinformatics strategy presented here makes use of this fact and thus enhances the ability to identify regulatory regions in which STAT tetramers may be functionally important. We show that both STAT consensus sites are important using reporter assays. Thus, STAT5 may be functioning on this regulatory element by binding to both sites as dimers, and these potentially may interact as tetramers. In addition, STAT4 and STAT5 can bind to this regulatory region when both are activated. It is possible that STAT4 and STAT5 are binding to the NCAM2 intronic element in a combinatorial fashion and displaying a functional interaction. Further experimentation is needed to test this hypothesis. Given the importance of the wide variety of cytokines that activate STAT5 in hematopoietic cells and given the importance of cytokines that activate STAT4 in many of these same cells, it is plausible that these two STATs may regulate other genes in hematopoietic cells.
Previous studies of STAT5 binding sites typically focused on the region immediately 5′ of the first exon. However, functional STAT5 binding sites are located elsewhere as well (9). A recent study demonstrates the presence of functional regulatory regions associated with the DACH gene that reside hundreds of kilobases from the coding region (45). Although the transcription factors that act in trans to these regulatory regions were not identified, the authors suggest that regulation of other genes may depend on sequences found far from any coding region, areas known as “gene deserts.” We have presented the characterization of a functional STAT binding site residing hundreds of kilobases from the first exon of the gene that it regulates. The presence of this novel STAT regulatory region suggests that other functional STAT binding sites may also reside far from the start of transcription.
We have presented an unbiased strategy to identify STAT5 targets through which we have identified two genes, one of which was not previously characterized as being STAT5-responsive. Therefore, it is clear that a combination of bioinformatics approaches, together with knowledge of STAT5 binding patterns, can be utilized to identify novel STAT5 binding sites found anywhere in the genome. This methodology may also be applicable to any transcription factor with a known consensus binding sequence.
Footnotes
This work was supported by the Brent Leahey Fund.
- STAT
- signal transducer and activator of transcription
- ChIP
- chromatin immunoprecipitation
- NK
- natural killer
- IFN
- interferon
- Pol II
- RNA polymerase II
- IL
- interleukin
- RT
- reverse transcription
- GAPDH
- glyceraldehyde-3-phosphate dehydrogenase
- CIS
- cytokine-inducible SH2 domain protein
REFERENCES
- 1.Bowman T, Garcia R, Turkson J, Jove R. Oncogene. 2000;19:2474–2488. doi: 10.1038/sj.onc.1203527. [DOI] [PubMed] [Google Scholar]
- 2.Frank DA. Cancer Treat. Res. 2003;115:267–291. doi: 10.1007/0-306-48158-8_11. [DOI] [PubMed] [Google Scholar]
- 3.Sternberg DW, Gilliland DG. J. Clin. Oncol. 2004;22:361–371. doi: 10.1200/JCO.2004.10.124. [DOI] [PubMed] [Google Scholar]
- 4.Horita M, Andreu EJ, Benito A, Arbona C, Sanz C, Benet I, Prosper F, Fernandez-Luna JL. J. Exp. Med. 2000;191:977–984. doi: 10.1084/jem.191.6.977. [DOI] [PMC free article] [PubMed] [Google Scholar]
- 5.Grimley PM, Dong F, Rui H. Cytokine Growth Factor Rev. 1999;10:131–157. doi: 10.1016/s1359-6101(99)00011-8. [DOI] [PubMed] [Google Scholar]
- 6.Liu X, Robinson GW, Wagner K-U, Garrett L, Wynshaw-Boris A, Hennighausen L. Genes Dev. 1997;11:179–186. doi: 10.1101/gad.11.2.179. [DOI] [PubMed] [Google Scholar]
- 7.Udy GB, Towers RP, Snell RG, Wilkins RJ, Park S-H, Ram PA, Waxman DJ, Davey HW. Proc. Natl. Acad. Sci. U. S. A. 1997;94:7239–7244. doi: 10.1073/pnas.94.14.7239. [DOI] [PMC free article] [PubMed] [Google Scholar]
- 8.Feldman GM, Rosenthal LA, Liu X, Hayes MP, Wynshaw-Boris A, Leonard WJ, Hennighausen L, Finbloom DS. Blood. 1997;90:1768–1776. [PubMed] [Google Scholar]
- 9.Nelson EA, Walker SR, Alvarez JV, Frank DA. J. Biol. Chem. 2004;279:54724–54730. doi: 10.1074/jbc.M408464200. [DOI] [PubMed] [Google Scholar]
- 10.Wang Y, Jiang H. J. Biol. Chem. 2005;280:10955–10963. doi: 10.1074/jbc.M412808200. [DOI] [PubMed] [Google Scholar]
- 11.Ureta-Vidal A, Ettwiller L, Birney E. Nat. Rev. Genet. 2003;4:251–262. doi: 10.1038/nrg1043. [DOI] [PubMed] [Google Scholar]
- 12.Bulyk ML. Genome Biol. 2003;5:201. doi: 10.1186/gb-2003-5-1-201. [DOI] [PMC free article] [PubMed] [Google Scholar]
- 13.Meyer WK, Reichenbach P, Schindler U, Soldaini E, Nabholz M. J. Biol. Chem. 1997;272:31821–31828. doi: 10.1074/jbc.272.50.31821. [DOI] [PubMed] [Google Scholar]
- 14.John S, Vinkemeier U, Soldaini E, Darnell JE, Jr., Leonard WJ. Mol. Cell Biol. 1999;19:1910–1918. doi: 10.1128/mcb.19.3.1910. [DOI] [PMC free article] [PubMed] [Google Scholar]
- 15.Verdier F, Rabionet R, Gouilleux F, Beisenherz-Huss C, Varlet P, Muller O, Mayeux P, Lacombe C, Gisselbrecht S, Chretien S. Mol. Cell Biol. 1998;18:5852–5860. doi: 10.1128/mcb.18.10.5852. [DOI] [PMC free article] [PubMed] [Google Scholar]
- 16.Robertson MJ, Cochran KJ, Cameron C, Le JM, Tantravahi R, Ritz J. Exp. Hematol. 1996;24:406–415. [PubMed] [Google Scholar]
- 17.Brudno M, Poliakov A, Salamov A, Cooper GM, Sidow A, Rubin EM, Solovyev V, Batzoglou S, Dubchak I. Genome Res. 2004;14:685–692. doi: 10.1101/gr.2067704. [DOI] [PMC free article] [PubMed] [Google Scholar]
- 18.Decker T, Kovarik P, Meinke A. J. Interferon Cytokine Res. 1997;17:121–134. doi: 10.1089/jir.1997.17.121. [DOI] [PubMed] [Google Scholar]
- 19.Ehret GB, Reichenbach P, Schindler U, Horvath CM, Fritz S, Nabholz M, Bucher P. J. Biol. Chem. 2001;276:6675–6688. doi: 10.1074/jbc.M001748200. [DOI] [PubMed] [Google Scholar]
- 20.Yoshimura A, Ichihara M, Kinjyo I, Moriyama M, Copeland NG, Gilbert DJ, Jenkins NA, Hara T, Miyajima A. EMBO J. 1996;15:1055–1063. [PMC free article] [PubMed] [Google Scholar]
- 21.Ma Y, Streiff RJ, Liu J, Spence MJ, Vestal RE. Nucleic Acids Res. 1999;27:4649–4657. doi: 10.1093/nar/27.23.4649. [DOI] [PMC free article] [PubMed] [Google Scholar]
- 22.Becknell B, Caligiuri MA. Adv. Immunol. 2005;86:209–239. doi: 10.1016/S0065-2776(04)86006-1. [DOI] [PubMed] [Google Scholar]
- 23.Yu CR, Lin JX, Fink DW, Akira S, Bloom ET, Yamauchi A. J. Immunol. 1996;157:126–137. [PubMed] [Google Scholar]
- 24.Chughtai N, Schimchowitsch S, Lebrun JJ, Ali S. J. Biol. Chem. 2002;277:31107–31114. doi: 10.1074/jbc.M200156200. [DOI] [PubMed] [Google Scholar]
- 25.Onishi M, Nosaka T, Misawa K, Mui AL-F, Gorman D, McMahon M, Miyajima A, Kitamura T. Mol. Cell Biol. 1998;18:3871–3879. doi: 10.1128/mcb.18.7.3871. [DOI] [PMC free article] [PubMed] [Google Scholar]
- 26.Pfitzner E, Jahne R, Wissler M, Stoecklin E, Groner B. Mol. Endocrinol. 1998;12:1582–1593. doi: 10.1210/mend.12.10.0180. [DOI] [PubMed] [Google Scholar]
- 27.Frank DA, Robertson M, Bonni A, Ritz J, Greenberg ME. Proc. Natl. Acad. Sci. U. S. A. 1995;92:7779–7783. doi: 10.1073/pnas.92.17.7779. [DOI] [PMC free article] [PubMed] [Google Scholar]
- 28.Cho SS, Bacon CM, Sudarshan C, Rees RC, Finbloom D, Pine R, O’Shea JJ. J. Immunol. 1996;157:4781–4789. [PubMed] [Google Scholar]
- 29.Bream JH, Hodge DL, Gonsky R, Spolski R, Leonard WJ, Krebs S, Targan S, Morinobu A, O’Shea JJ, Young HA. J. Biol. Chem. 2004;279:41249–41257. doi: 10.1074/jbc.M401168200. [DOI] [PubMed] [Google Scholar]
- 30.Rascle A, Lees E. Nucleic Acids Res. 2003;31:6882–6890. doi: 10.1093/nar/gkg907. [DOI] [PMC free article] [PubMed] [Google Scholar]
- 31.Calo V, Migliavacca M, Bazan V, Macaluso M, Buscemi M, Gebbia N, Russo A. J. Cell Physiol. 2003;197:157–168. doi: 10.1002/jcp.10364. [DOI] [PubMed] [Google Scholar]
- 32.Carroll JS, Liu XS, Brodsky AS, Li W, Meyer CA, Szary AJ, Eeckhoute J, Shao W, Hestermann EV, Geistlinger TR, Fox EA, Silver PA, Brown M. Cell. 2005;122:33–43. doi: 10.1016/j.cell.2005.05.008. [DOI] [PubMed] [Google Scholar]
- 33.Cawley S, Bekiranov S, Ng HH, Kapranov P, Sekinger EA, Kampa D, Piccolboni A, Sementchenko V, Cheng J, Williams AJ, Wheeler R, Wong B, Drenkow J, Yamanaka M, Patel S, Brubaker S, Tammana H, Helt G, Struhl K, Gingeras TR. Cell. 2004;116:499–509. doi: 10.1016/s0092-8674(04)00127-8. [DOI] [PubMed] [Google Scholar]
- 34.Martone R, Euskirchen G, Bertone P, Hartman S, Royce TE, Luscombe NM, Rinn JL, Nelson FK, Miller P, Gerstein M, Weissman S, Snyder M. Proc. Natl. Acad. Sci. U. S. A. 2003;100:12247–12252. doi: 10.1073/pnas.2135255100. [DOI] [PMC free article] [PubMed] [Google Scholar]
- 35.LeBaron MJ, Xie J, Rui H. Mol. Cancer. 2005;4:6. doi: 10.1186/1476-4598-4-6. [DOI] [PMC free article] [PubMed] [Google Scholar]
- 36.Kapranov P, Cawley SE, Drenkow J, Bekiranov S, Strausberg RL, Fodor SP, Gingeras TR. Science. 2002;296:916–919. doi: 10.1126/science.1068597. [DOI] [PubMed] [Google Scholar]
- 37.Walmod PS, Kolkova K, Berezin V, Bock E. Neurochem. Res. 2004;29:2015–2035. doi: 10.1007/s11064-004-6875-z. [DOI] [PubMed] [Google Scholar]
- 38.Crnic I, Strittmatter K, Cavallaro U, Kopfstein L, Jussila L, Alitalo K, Christofori G. Cancer Res. 2004;64:8630–8638. doi: 10.1158/0008-5472.CAN-04-2523. [DOI] [PubMed] [Google Scholar]
- 39.Perl AK, Dahl U, Wilgenbus P, Cremer H, Semb H, Christofori G. Nat. Med. 1999;5:286–291. doi: 10.1038/6502. [DOI] [PubMed] [Google Scholar]
- 40.Kaiser U, Auerbach B, Oldenburg M. Leuk. Lymphoma. 1996;20:389–395. doi: 10.3109/10428199609052420. [DOI] [PubMed] [Google Scholar]
- 41.Takasaki S, Hayashida K, Morita C, Ishibashi H, Niho Y. Cell Biol. Int. 2000;24:101–108. doi: 10.1006/cbir.1999.0457. [DOI] [PubMed] [Google Scholar]
- 42.Nitta T, Yagita H, Sato K, Okumura K. J. Exp. Med. 1989;170:1757–1761. doi: 10.1084/jem.170.5.1757. [DOI] [PMC free article] [PubMed] [Google Scholar]
- 43.Fehniger TA, Shah MH, Turner MJ, VanDeusen JB, Whitman SP, Cooper MA, Suzuki K, Wechser M, Goodsaid F, Caligiuri MA. J. Immunol. 1999;162:4511–4520. [PubMed] [Google Scholar]
- 44.Zhang X, Darnell JE., Jr. J. Biol. Chem. 2001;276:33576–33581. doi: 10.1074/jbc.M104978200. [DOI] [PubMed] [Google Scholar]
- 45.Nobrega MA, Ovcharenko I, Afzal V, Rubin EM. Science. 2003;302:413. doi: 10.1126/science.1088328. [DOI] [PubMed] [Google Scholar]