

Abstract
Functional neurosurgery has afforded the opportunity to assess interactions between populations of neurons in the human cerebral cortex and basal ganglia in patients with Parkinson's disease (PD). Interactions occur over a wide range of frequencies, and the functional significance of those >30 Hz is particularly unclear. Do they improve movement, and, if so, in what way? We acquired simultaneously magnetoencephalography and direct recordings from the subthalamic nucleus (STN) in 17 PD patients. We examined the effect of synchronous and sequential finger movements and of the dopamine prodrug levodopa on induced power in the contralateral primary motor cortex (M1) and STN and on the coherence between the two structures. We observed discrete peaks in M1 and STN power at 60–90 Hz and at 300–400 Hz. All these power peaks increased with movement and levodopa treatment. Only STN activity at 60–90 Hz was coherent with activity in M1. Directionality analysis showed that STN gamma activity at 60–90 Hz tended to drive gamma activity in M1. The effects of levodopa on both local and distant synchronization at 60–90 Hz correlated with the degree of improvement in bradykinesia-rigidity as did local STN activity at 300–400 Hz. Despite this, there were no effects of movement type, nor interactions between movement type and levodopa in the STN, nor in the coherence between STN and M1. We conclude that synchronization at 60–90 Hz in the basal ganglia cortical network is prokinetic but likely through a modulatory effect rather than any involvement in explicit motor processing.
Introduction
There has been considerable recent interest in the exaggerated beta band (13–35 Hz) oscillations found in the cortico-basal ganglia loop of patients with untreated Parkinson's disease (PD) (Uhlhaas and Singer, 2006; Hammond et al., 2007; Eusebio and Brown, 2009; Weinberger et al., 2009). Mounting evidence suggests that this activity may contribute to slowness and stiffness in PD (Kühn et al., 2006, 2008, 2009; Weinberger et al., 2006; Ray et al., 2008; Chen et al., 2010). In contrast, less is known about oscillatory dynamics at higher frequencies in the cortico-basal ganglia loop. Several rhythmic activities have been reported and are increased after treatment with the dopamine prodrug levodopa and with voluntary movement. Within the gamma frequency band, discrete peaks may occur centered between 60 and 90 Hz in local field potential (LFP) activity and in the coherence between different nodes within the basal ganglia loop (Brown et al., 2001; Cassidy et al., 2002; Williams et al., 2002; Fogelson et al., 2005; Alonso-Frech et al., 2006). An additional discrete peak in the subthalamic nucleus (STN) LFP may be seen in the high gamma (150–350 Hz) band (Foffani et al., 2003; Kane et al., 2009), which shifts in frequency with dopaminergic therapy (Ozkurt et al., 2011). These activities in the gamma and high gamma bands have been considered prokinetic (Brown, 2003; Foffani and Priori, 2006; Ozkurt et al., 2011). However, only some features of (high) gamma band activity represent a prokinetic neurophysiological marker of levodopa-induced motor improvement in PD (López-Azcárate et al., 2010; Ozkurt et al., 2011). Our first aim was therefore to test the hypothesis that gamma activity at 60–90 Hz facilitates movement by seeking an inverse correlation between gamma activity and motor impairment.
It has been suggested that any prokinetic actions of gamma activity might relate to changes in arousal or motor vigor rather than to improvements in explicit motor processing (Kempf et al., 2009). This fits well with the view from studies in nonhuman primates suggesting that interactions between the basal ganglia and cortex are primarily modulatory in nature (Gatev and Wichmann, 2009). Our second aim was therefore to test the hypothesis that gamma activity is modulatory by comparing its reactivity during finger movements performed synchronously or asynchronously. Gamma increases of similar amplitude and duration at movement outset might be expected with modulatory processes such as arousal or motor vigor (Mazzoni et al., 2007), whereas more sustained increases in gamma activity might be predicted during sequential movements, if gamma is directly related to motor processing. In testing these hypotheses, we exploit recent methodological advances that permit the analysis of simultaneously recorded LFPs from deep neurosurgical targets and magnetoencephalographic (MEG) activity from the cortical mantle (Litvak et al., 2010; Hirschmann et al., 2011). The present report complements recent studies of cortico-subthalamic connectivity at rest in this (Litvak et al., 2011a) and other (Hirschmann et al., 2011) cohorts.
Materials and Methods
Patients and surgery.
Seventeen patients (55 ± 7 years old, six female, two left-handed) participated in the study. In one patient, the surgery was performed only on the right side. The study was approved by the joint ethics committee of the National Hospital for Neurology and Neurosurgery and the UCL Institute of Neurology, and the patients gave written informed consent before the study onset. Clinical details are given in Table 1. All patients were diagnosed with PD according the Queen Square Brain Bank criteria (Gibb and Lees, 1988). The indications, operative procedure, and beneficial clinical effects of STN stimulation have been described previously (Foltynie et al., 2011). Before surgery, the motor impairments of all patients were evaluated using part III of the Unified Parkinson's Disease Rating Scale (UPDRS) after omitting all dopaminergic medication overnight and after administration of at least 200 mg of levodopa. The patients were operated on after overnight withdrawal of levodopa medication and after dopamine agonists had been reduced and terminated during the 2 weeks before surgery.
Table 1.
Clinical features of patient cohort
| Case | Age (years)/sex | Disease duration (years) | Predominant symptoms (in addition to akinesia) | Preoperative medication (total daily dose) | UPDRS ON/OFF medication | UPDRS OFF medication/ON DBS | Remarks |
|---|---|---|---|---|---|---|---|
| 1 | 40/male | 10 | Gait impairment, tremor | 1200 mg of levodopa, 5 mg of pramipexole | 9/30 | 21 | Additional tics from age 12 |
| 2 | 55/male | 15 | Tremor, freezing, motor fluctuations | 1000 mg of levodopa, 16 mg of ropinirole, 10 mg of selegiline, 100 mg of amantadine | 5/19 | 18 | |
| 3 | 59/female | 13 | Gait freezing, dyskinesias | 500 mg of levodopa, 1 mg of cabergoline, 100 mg of amantadine, 2 mg of apomorphine | 10/36 | 11 | Recording done ON medication only; cluster headache |
| 4 | 45/female | 8 | Tremor | 27 mg of ropinirole | –/50 | 42 | DBS lead only in the right STN; the patient was intolerant of levodopa so recording done OFF medication only |
| 5 | 58/female | 14 | Gait freezing, pain, dyskinesias, motor fluctuations | 250 mg of levodopa, 4 mg of pramipexole | 18/71 | 15b | |
| 6 | 64/female | 8 | Tremor, dyskinesias | 500 mg of levodopa, 17 mg of ropinirole, 300 mg of amantadine, 1 mg of rasagline | 18/51 | 23a | Recording done ON medication only; hypothyroidism |
| 7 | 51/male | 9 | Gait impairment, tremor | 800 mg of levodopa, 1 mg of rasagiline | 21/49 | 19c | REM sleep disorder; previous DOPA dysregulation |
| 8 | 60/male | 15 | Dyskinesias, gait freezing, tremor | 1300 mg of levodopa, 18 mg of ropinirole, 10 mg of selegiline, 2 mg of amantadine | 10/56 | 23 | |
| 9 | 54/male | 8 | Gait impairment, dyskinesias | 1200 mg of levodopa, 4 mg of cabergoline, 800 mg of entacapone, 300 mg of amantadine | 9/38 | 15a | |
| 10 | 66/male | 8 | Freezing, motor fluctuations, dyskinesias, tremor | 800 mg of levodopa, 2 mg of pramipexole, 1 mg of rasagline, 200 mg of amantadine, 4–8 mg of apomorphine | 18/72 | 21a | Recording done ON medication only |
| 11 | 48/male | 11 | Gait freezing, tremor | 1250 mg of levodopa, 1 mg of rasagiline, 500 mg of entacapone | 16/72 | 25c | |
| 12 | 63/female | 9 | Tremor, pain | 4 mg of rotigotine, 1 mg of rasagiline | –/51 | 12d | LRRK2 mutation; patient was intolerant to levodopa, so recording was done OFF medication only |
| 13 | 61/male | 9 | Gait freezing, tremor | 1800 mg of levodopa, 500 μg of pramipexole | 5/28 | 19 | |
| 14 | 58/female | 10 | Dystonia, dyskinesia, motor fluctuations | 450 mg of levodopa, 3 mg of pramipexole, 2 mg of rasagiline | 16/55 | 16c | |
| 15 | 52/male | 12 | Dystonia | 950 mg of levodopa, 4 mg of rotigotine, 1 mg of rasagiline | 10/35 | 26 | |
| 16 | 58/male | 13 | Gait freezing | 1200 mg of levodopa, 400 mg of amantadine, 600 mg of entacapone, 1 mg of rasagiline | 25/43 | 17 | |
| 17 | 57/male | 17 | Gait impairment, pain, dyskinesias | 1550 mg of levodopa, 1600 mg of entacapone, 10 mg of selegiline, 200 mg of amantadine | 14/54 | 32 |
All patients received bilateral STN DBS electrodes except for case 4. The dose of pramipexole is given as a salt. Psychiatric comorbidities were mania and compulsivity (1 case), hypersexuality (2 cases), depression (1 case), past history of gambling on dopamine agonist (1 case). UPDRS scores OFF medication/ON DBS were assessed at 6 months (a), 8 months (b), 10 months (c), or 1 year (unmarked) post-operatively. Subject 12 was assessed on 1 mg of rasagiline ON DBS (d).
The deep brain stimulation (DBS) electrodes were model 3389 (Medtronic) with four platinum–iridium cylindrical surfaces of 1.27 mm diameter, 1.5 mm length, and 2 mm center-to-center separation. The contacts were numbered 0 (lowermost, targeted to 2 mm below the center of the STN) to 3 (uppermost).
Surgical targeting of the DBS electrode was based on stereotactic magnetic resonance images (MRIs). Fast acquisition T2-weighted 2-mm-thick contiguous axial slices were acquired with a stereotactic Leksell Frame (Elekta). The STN [especially its medial border (Hariz et al., 2003)] was examined on the axial image containing the largest diameter of the ipsilateral red nucleus. The center of the STN was identified in a plane 0–1 mm behind the anterior border of the ipsilateral red nucleus (Bejjani et al., 2000). Cartesian coordinates of the target point were calculated using Framelink software (Medtronic). A double oblique trajectory was planned on reconstructed three-dimensional images to avoid sulci and ventricles. This surgical procedure has been described previously (Zrinzo et al., 2009; Foltynie et al., 2011). After implantation, electrodes were connected to an accessory kit, typically with both connectors being tunneled to the left temporoparietal area and externalized through the frontal region. No microelectrode recordings were made.
The locations of the electrodes were confirmed with immediate postoperative stereotactic imaging. Fast spin-echo T2-weighted 2-mm-thick contiguous axial slices were acquired with the Leksell frame still in situ. One patient was unable to tolerate a postoperative MRI and underwent stereotactic computed tomography scanning instead.
The patients were studied in the interval between DBS electrode implantation and subsequent connection to a subcutaneous stimulator between 2 and 7 d postoperatively.
Between 6 and 12 months postoperatively, the UPDRS assessment was repeated during DBS stimulation after overnight withdrawal of dopaminergic medication (Table 1, UPDRS OFF medication/ON DBS).
Experimental paradigm.
The experiment was divided into blocks of several minutes of recording. The patients could rest or fidget between the blocks. Each block comprised either rest or a movement task. During rest blocks, the subjects were instructed to remain still with their eyes open for 3 min (see Litvak et al., 2011a). During movement blocks, the subjects performed either simultaneous button presses with index, middle, and ring finger (SYN) or sequential button presses with index, ring, and then middle finger (SEQ), with either left or right hand (one kind of movement with the same hand within a block). The movements were self-paced. The subjects were instructed to move when they wanted but not to do it too frequently and to take ∼15 s between movements without counting silently. Feedback to the subjects was presented visually, using MATLAB (MathWorks) and a custom script based on Cogent (http://www.vislab.ucl.ac.uk/cogent.php). This script monitored the movement times and displayed messages on the screen when the intermovement interval was shorter than 12 s or a movement sequence was incomplete. When performing correctly, the subjects did not get any feedback and the screen just showed a fixation cross. In the case of incorrect performance, the script waited to collect another movement so that it ran until eight correctly performed movements were collected or at most for a total of 7 min. The subjects could usually complete a movement block in 3–4 min. A neurologist was present in the magnetically shielded room during the experiments to monitor the patients and performance of the task. The order of the conditions was pseudorandomized separately for blocks 1–9 and blocks 10–18, so that each half would contain one rest block and two movement blocks of each type. In all experiments, at least nine blocks were recorded, but only in two experiments did the patients successfully perform all 18 blocks. A single recording session lasted ∼1.5–2.5 h (including preparation).
The whole experiment was repeated twice: after overnight withdrawal of dopaminergic medication (OFF drug) and after the patients took ≥200 mg of levodopa (ON drug). The order of these drug conditions was counterbalanced over patients. Twelve patients were able to complete both experiments, three were only recorded ON drug, and two patients could not tolerate levodopa and were therefore only recorded OFF drug. Note that overnight withdrawal of dopaminergic medication is unlikely to lead to complete absence of dopaminergic input to the basal ganglia, because some dopaminergic effects may persist and some medications, particularly dopamine agonists, are long acting. Hence, the difference between the OFF and ON states is relative rather than absolute.
The two movement patterns differed in several regards, although the same fingers were used to enact the same key presses. In the SYN task, all three fingers simultaneously depressed three keys, whereas in the SEQ task, only one finger at a time was used to depress one key. Consequently, the conditions differed in the initial parameterization of force, which was greater in the SYN task. Nevertheless, the same three keys were eventually depressed in the SEQ task, which therefore went on for longer than synchronous button presses. Accordingly, activities directly related to motor processing might be expected to differ between tasks, reflecting their differential force profiles and durations. Moreover, the sequential movement was chosen to elicit motor-related processing in the basal ganglia, which are thought to be engaged by sequential movements (Benecke et al., 1987).
LFP–MEG recordings.
MEG recordings were obtained with a 275-channel system (CTF/VSM MedTech). Simultaneously, STN-LFP, electro-oculographic (EOG), and electromyographic (EMG) signals were recorded using an integrated EEG system (1× amplification, ±125 mV dynamic range) and high-pass filtered (in hardware) >1 Hz to avoid saturation of the amplifiers attributable to DC offsets. All signals were low-pass filtered in hardware <600 Hz. The data were sampled at 2400 Hz and stored to disk. Four intracranial LFP channels were recorded from each electrode, on each side, and referenced to a cephalic reference (forehead for the first two patients, right mastoid for the rest). LFP recordings were converted offline to a bipolar montage between adjacent contacts (three bipolar channels per hemisphere; 01, 12, and 23) to limit the effects of volume conduction from distant sources. EMG data were recorded from right and left first dorsal interosseous muscles with a reference at the muscle tendon. Button presses were also recorded in all subjects.
Head location was monitored using three head-position indicator (HPI) coils attached to the subject's nasion and pre-auricular points. For all but the first subject, we used continuous head localization and recorded the head locations throughout the experiment. Loss of head tracking occurred intermittently in some patients, possibly as a result of metal artifacts disrupting the head-tracking function of the MEG sensors. During offline processing, we compared the instantaneous distances between HPI coils with the distances based on the robust average (Holland and Welsch, 1977) of locations across the whole continuous recording. Time frames in which discrepancies were detected were discarded and replaced with linear interpolation based on the other time frames. This method works well when the tracking is valid for more than half of the recording, which was the case for all recordings reported here.
Data analyses.
In our previous study (Litvak et al., 2010), we detailed the challenges posed by the presence of metal artifacts in the MEG and our use of beam forming to suppress these artifacts. Here, we recap the main points and then focus on the details of the analysis specific to the present study.
Briefly, we used beamforming methods to localize the hand area of the primary motor cortex (M1) contralateral to the movement individually in each patient and extract virtual electrode time series from these locations. We then computed time–frequency images of M1 and STN power and M1–STN coherence around the times of the button presses by the contralateral hand and subjected these images to statistical analysis (see below, Statistical analysis). In the following sections, we describe the technical details of the beamforming and spectral analyses.
The data were analyzed using custom MATLAB scripts based on SPM8 (Litvak et al., 2011b) and Fieldtrip (Oostenveld et al., 2011) toolboxes (the Fieldtrip code we used is included in the SPM8 distribution).
Cortical source reconstruction.
For the purposes of M1 localization, we used a multivariate beamforming approach (Soto et al., 2009; Barnes et al., 2011). The motivation for using this approach was the ability to simultaneously examine a number of covarying spectral changes over a wide frequency range (5–100 Hz). When the induced responses at high (gamma) and low (alpha and beta) frequencies are localized separately (Jurkiewicz et al., 2006; Cheyne et al., 2008; Litvak et al., 2010), one is likely to get two separate peaks, and it is not clear which of them to use for virtual electrode placement. If gamma and alpha are covariant, then the optimal test is a multivariate one, which produces a statistic of the amount of variance (in the design) explained by a weighted linear combination of these two (or any N) spectral features. In this case, we used a feature space corresponding to the first five principal components of the power spectra at each virtual electrode location. For each patient and hemisphere, all contralateral movement trials were used together. The sensor locations were recomputed based on continuous head localization data (if available) to correspond to the mean location across the trials included in the analysis. Source time series were estimated with a linearly constrained minimum variance (LCMV) beamformer (Van Veen et al., 1997). The multivariate analysis contrasted two time windows: 0 to 1 s (activation) and −6 to −5 s (baseline) relative to the button press. The activation window was chosen as the period containing strong movement-related changes in power in both gamma and beta bands (see Results). The baseline window—matching the length of the activation window—was placed at the end of the baseline period used for time–frequency analysis (see below). χ2 statistical images were computed on a grid defined in Montreal Neurological Institute (MNI) space with spacing of 5 mm and restricted to the points within the inner skull boundary. Values on the grid were then interpolated using linear interpolation to produce volumetric images with 2 mm resolution. The resulting images were further smoothed with a 5 mm isotropic Gaussian kernel to remove spurious local maxima. We chose as individual M1 location the local maximum closest to the location defined in the literature (Mayka et al., 2006) [MNI coordinates: left M1, (−37, −18, 53); right M1, (37, −18, 53)].
Estimates of cortical source activity in these beamformer-identified M1 hand areas were examined in more detail using epochs from 10 s before to 10 s after button presses. Again, virtual electrode time series were estimated with LCMV beamformer (Van Veen et al., 1997). The source orientation was set in the anteroposterior direction to be approximately normal to the cortical surface in the central and precentral sulcus.
When computing covariances for beamforming, it is necessary to account for head movement. Ideally, one should use as much data as possible (Brookes et al., 2008). For instance, when looking at movement-related activity, it would be desirable to use all movement trials. However, when the head location varies across trials, the sources seen by a particular MEG sensor may differ and pooling over trials may then degrade covariance estimates. In experiments with healthy volunteers, this is a minor issue because head movements do not usually exceed 1 cm (which is of the order of the sensor coil radius in our MEG system). In our case, however, some patients found it difficult to keep still because of involuntary dyskinesias, especially when on dopaminergic medication. Thus, displacements of ∼3 cm between trials were not uncommon. We, therefore, computed beamformer filters for each trial separately. This is also the most generic approach accommodating varying numbers of trials across subjects. In all cases, the sensor positions were recomputed to correspond to the average head location for each trial. We also tested two alternative approaches—computing filters based on all the trials in an experiment and on all the trials in each block—and obtained qualitatively similar results. Furthermore, we tested a range of regularization values that constrain the beamformer estimates. This indicated that the minimum regularization value yielding consistent results was 0.01% of the signal variance (averaged over channels).
Preprocessing of virtual electrode and LFP data.
The virtual electrode channels derived from the MEG sometimes contained discontinuous jumps, whose origin could be traced to occasional resets of the sensor circuitry. These jumps were detected by thresholding the differences between adjacent samples. When a jump was detected, the values from 20 samples before to 20 samples after the jump were replaced by the median difference over this segment and the modified difference time series were summed again to produce the original time series with the jump corrected.
The corrected data were digitally filtered (1 Hz fifth-order high pass and fourth-order notch filters for 50 Hz and all harmonics up to 550 Hz, zero-phase Butterworth in all cases). Finally, before spectral analysis, the channel data were standardized by subtracting the mean and dividing by the standard deviation (SD) for each channel and trial separately. This ensured that all trials contributed equally to estimates of source activity.
Artifact suppression.
High-frequency modulations in power, particularly wide-band modulations, could result from artifacts in the forms of short “spikes” or “jumps” in the data. In our case, LFP, EMG, and EOG data were contaminated by occasional brief electrical discharges attributable to a grounding problem that could not be completely resolved at the hardware level.
To rule out high-frequency artifacts as an explanation for our results, the pre-processed LFP and virtual electrode data and their first derivative (difference) time series were examined for the presence of outliers by thresholding. The thresholds were set such that they could separate the artifacts from the remaining data. These thresholds were 5 SDs for the original data, 4 SDs for STN–LFP derivative, and 1.5 SDs for M1 derivative (Fig. 1A,C).
Figure 1.

Artifact rejection criteria and validation of robust averaging. A, Fifty trials from one subject showing the spike artifacts in STN–LFP. The red lines indicate the rejection threshold that was used for STN–LFP data (5 SDs). B, Distribution of STN–LFP artifacts in trial time. The rate of artifact occurrence increased around the button press, peaking at ∼0.5%. If an artifact occurred within the boundaries marked by the red lines, the corresponding trial was excluded from analysis of power. C, Difference time series for 50 trials of M1 virtual electrode data. The red lines indicate the rejection threshold that was used for these data (1.5 SDs). D, Distribution of M1 artifacts in trial time. The rate of artifact occurrence increased around the button press, peaking below 1%. If an artifact occurred within the boundaries marked by the red lines, the corresponding trial was excluded from analysis of power. E, Results of simulations aimed at validating the robust averaging method. The top row shows the results of time–frequency analysis for synthetic data contaminated with artifacts taken from the real data. The second row shows similar analysis on simulated data without artifacts, and the third row shows the results of analysis of contaminated data when using robust averaging. The simulated data were based on real data from all the subjects used in the actual data analysis and one experimental condition (synchronous button presses with the right-hand ON drug). To assess reproducibility of these results, the simulation was repeated with eight different sets of artifacts taken from all the eight experimental conditions. The results were summarized by averaging the power and coherence in 15–35 Hz range. The bottom row shows the mean and SD of these eight repetitions for contaminated signals (black), clean signals (red), and robust averaging results (green). The units in all plots are change from baseline in percentage.
Figure 1A shows an example of LFP recording containing spikes from a single experiment, and Figure 1C shows an example of M1 signal derivative also evidencing artifacts in some trials. Examining the timing of the artifacts relative to the button press showed that their occurrence rate was fairly uniform, with the exception of a short segment around the button press, in which the incidence of spikes increased (Fig. 1B,D). To preclude contribution of spikes to the button-press response, trials with artifacts in this period (−0.2 to 1.5 s) were excluded from the analysis of event-related power. The effects of the remaining spikes were suppressed by robust averaging (see below). Trial exclusion was performed separately for M1 and STN channels to minimize data loss. For the analysis of event-related coherence, we used all the trials. This was motivated by simulations showing that high-frequency artifacts in only one of the channels had a minor effect on coherence estimates and were further suppressed by our robust procedure for coherence computation (see below, Robust averaging).
The numbers of trials included in the analysis for each subject, hemisphere, and condition are reported in Table 2.
Table 2.
Details of hemispheres included in the analysis
| Case | Side | Selected STN channel | Dominant hemisphere | Numbers of trials (M1 power/STN power/Coherence) |
MNI coordinates of M1 source | Footnotes | |||||
|---|---|---|---|---|---|---|---|---|---|---|---|
| SYN OFF | SEQ OFF | SYN ON | SEQ ON | ||||||||
| 1 | Left | L23 | No | 30/31/32 | 14/14/14 | 14/15/16 | 15/15/15 | −46 | −22 | 56 | f |
| 1 | Right | R23 | Yes | 24/23/24 | 23/22/24 | 15/16/16 | 14/14/16 | 40 | −8 | 58 | |
| 2 | Left | L12 | Yes | 16/14/16 | 12/12/13 | 24/23/24 | 12/12/12 | −24 | −28 | 48 | |
| 2 | Right | R12 | No | 13/13/14 | 13/16/16 | 17/10/17 | 14/7/16 | 16 | −2 | 68 | |
| 3 | Left | L23 | Yes | –/15/15 | –/6/6 | −56 | −10 | 44 | a, d | ||
| 3 | Right | R12 | No | –/13/13 | –/13/13 | 44 | 0 | 52 | a, d | ||
| 4 | Right | R23 | No | 9/16/16 | 21/24/24 | 30 | −10 | 40 | b | ||
| 5 | Left | L23 | Yes | –/21/21 | –/16/16 | –/15/16 | –/15/16 | −36 | −2 | 46 | d, e1 |
| 5 | Right | R23 | No | –/19/20 | –/15/16 | –/16/16 | –/15/16 | 36 | 12 | 56 | d, e2, f |
| 6 | Left | L23 | Yes | 15/13/16 | 22/22/23 | −34 | −10 | 44 | a | ||
| 6 | Right | R23 | No | 16/16/16 | 16/14/16 | 28 | −8 | 72 | a | ||
| 7 | Left | L01 | Yes | 14/15/16 | 16/15/16 | 14/13/15 | 15/16/16 | −32 | −38 | 52 | |
| 7 | Right | R12 | No | 16/16/16 | 12/12/12 | 15/9/15 | 16/4/16 | 50 | −38 | 48 | |
| 8 | Left | L23 | Yes | 15/14/15 | 16/16/16 | 14/14/15 | 16/16/16 | −40 | −12 | 54 | |
| 8 | Right | R23 | No | 16/16/16 | 15/14/16 | 8/13/14 | 14/16/16 | 42 | −6 | 58 | |
| 9 | Left | L23 | Yes | 12/15/16 | 11/14/16 | 15/16/16 | 16/16/16 | −30 | −8 | 60 | |
| 9 | Right | R23 | No | 8/16/16 | 3/16/16 | 14/14/16 | 13/20/20 | 50 | −36 | 46 | |
| 10 | Left | L12 | Yes | 19/15/23 | 19/16/24 | −36 | −10 | 60 | a, f | ||
| 10 | Right | R12 | No | –/15/24 | –/14/16 | 34 | −4 | 62 | a, d, f | ||
| 11 | Left | L12 | No | 16/15/16 | 16/14/16 | 32/29/32 | 31/20/32 | −32 | −2 | 56 | e3 |
| 11 | Right | R23 | Yes | 16/15/16 | 16/16/16 | 31/29/32 | 32/32/32 | 38 | 2 | 58 | e4 |
| 12 | Left | L01 | Yes | 14/15/16 | 15/14/16 | −20 | −8 | 36 | b | ||
| 12 | Right | R12 | No | 15/14/16 | 15/14/16 | 48 | −28 | 58 | b | ||
| 13 | Left | L01 | Yes | 16/23/24 | 12/14/16 | 1/15/16 | 12/15/16 | −26 | −8 | 36 | |
| 13 | Right | R12 | No | 13/10/24 | 15/9/24 | 12/15/15 | 14/15/16 | 38 | −32 | 46 | |
| 14 | Left | L23 | Yes | –/16/16 | –/16/16 | –/16/16 | –/16/16 | −54 | −18 | 48 | d, e5 |
| 14 | Right | R12 | No | –/16/16 | –/15/16 | –/16/16 | –/16/16 | 14 | −32 | 72 | d |
| 15 | Left | L12 | Yes | 13/15/15 | 16/16/16 | −20 | −18 | 48 | c | ||
| 15 | Right | R23 | No | 15/16/16 | 16/14/16 | 40 | −36 | 46 | c | ||
| 16 | Left | L23 | Yes | 16/16/16 | 16/16/16 | 16/16/16 | 14/15/16 | −26 | −10 | 34 | |
| 16 | Right | R23 | No | 16/15/16 | 16/15/16 | 13/16/16 | 9/15/16 | 42 | −6 | 56 | |
| 17 | Left | L01 | Yes | –/15/16 | –/14/16 | –/16/16 | –/16/16 | −20 | −14 | 50 | d |
| 17 | Right | R01 | No | 16/15/16 | 16/16/16 | 16/16/16 | 14/16/16 | 44 | −12 | 58 | |
The numbers of trials refer to the movement with the contralateral hand.
aRecording performed ON drug only.
bRecording performed OFF drug only.
cON drug recording excluded from analysis because of high-frequency responses present in the average (see Materials and Methods).
dM1 recording excluded from analysis because of high-frequency responses present in the average (see Materials and Methods).
eDistinct 60–90 Hz peak in drug effect on coherence (see Fig. 7).
fDistinct 300–400 Hz peak in STN power.
1Individual frequency window, 65–85 Hz; peak coherence, (−20, 44, 2).
2Individual frequency window, 65–90 Hz; peak coherence, (46, 40, −12).
3Individual frequency window, 65–85 Hz; peak coherence, (−30, −4, 64).
4Individual frequency window, 65–80 Hz; peak coherence, (22, 6, 78).
5Individual frequency window, 55–75 Hz; peak coherence, (−30, −6, 64).
Spectral analyses.
For efficient spectral estimation from a relatively small number of trials, we used multitaper spectral analysis (Thomson, 1982). This method is based on pre-multiplying the data with a series of tapers optimized for producing uncorrelated estimates of the spectrum in a given frequency band. This sacrifices some of the frequency resolution, in a controlled manner, to increase the signal-to-noise ratio. It does this by effectively multiplying the number of trials by the number of tapers used. We estimated the spectra between −8 and 8 s relative to the first button press of each trial, in overlapping windows of 400 ms (shifted by 50 ms). The frequency resolution was set to the inverse of the time window (2.5 Hz) for up to 25 Hz, then 0.1 times the frequency for 25 to 50 Hz, and then to a constant 5 Hz resolution. These settings resulted in a single taper being used for 2.5–30 Hz, two tapers for 32.5–42.5 Hz, and three tapers for ≥45 Hz. The resulting time–frequency images had no discontinuities thanks to the continuous frequency resolution function.
The time–frequency images were then averaged using robust averaging (Holland and Welsch, 1977; Wager et al., 2005; for details, see below), and percentage change time–frequency responses were obtained by normalizing to the baseline (−8 to −5 s) before button press.
Coherence was estimated using a similar spectral estimation procedure except that robust averaging was used during coherence computation and was applied separately to the absolute values of the cross-spectral density and to the power of the two sources. In the case of cross-spectra, the weights computed from the absolute values were then applied to the complex cross-spectra when computing the mean coherency over trials. Percentage changes in cross-spectral responses were computed as above.
For the purposes of data reduction, we only selected one of the three STN bipolar channels on each side. The initial selection was done based on the greatest movement-related beta event-related desynchronization (ERD)/event-related synchronization (ERS). We then also examined the average baseline-corrected spectra around the button press to ensure that no other spectral features were completely omitted by selecting this particular channel and changed the selection to a more representative channel if necessary. The same channel was also used for coherence computation. This approach is based on the fact that the highest beta activity in the subthalamic region localizes to the STN, particularly its dorsal “motor” part, as judged by microelectrode recordings of neuronal discharges and LFPs in parkinsonian models (Sharott et al., 2005; Mallet et al., 2008; Degos et al., 2009) and patients (Kühn et al., 2005; Chen et al., 2006; Trottenberg et al., 2006; Weinberger et al., 2006; Moran et al., 2008; Yoshida et al., 2010; Zaidel et al., 2010).
Robust averaging.
Robust averaging is a special and simple case of the robust general linear model (Holland and Welsch, 1977; Wager et al., 2005). The idea is that, for each time–frequency bin, the distribution of values over trials is considered and the outliers are down-weighted when computing the average. This makes it possible to suppress artifacts restricted to narrow time and frequency ranges without rejecting whole trials. Moreover, a clean average can be computed with no clean trials, provided that artifacts do not overlap systematically. This was the case for our data, except in some trials around the button press, in which we excluded artifacts by thresholding (see above).
To verify the validity of robust averaging for our data, we applied it to simulated data combined with spike artifacts from the STN–LFP recordings. The simulated data were derived from the original data; STN–LFP data for each trial were replaced by a simulated signal generated as follows. The amplitude of bandpass-filtered (15–35 Hz) noise was modulated to create an increase in amplitude by 50% around time 0. The amplitude modulation was Gaussian, with SD of 250 ms. This narrow-band noise was added to white noise (in equal proportions). The resulting signal was standardized by subtracting the mean and dividing by the SD for each channel and trial separately to create the “clean” reference LFP signal (henceforth “clean signal”). Contaminated LFP signal (henceforth “contaminated signal”) was created by adding the spikes from the original pre-processed LFP data from the corresponding trial to the clean signal. The spikes were separated from physiological signal by setting the values with amplitude <5 SDs to 0. For the purposes of estimating coherence, the clean signal was added to real M1 virtual electrode signal to create a signal coherent with the clean and the contaminated signals (henceforth “coherent signal”). We then subjected the synthetic signals to the same time–frequency analysis as real data with and without the use of robust averaging for power and coherence computation. The simulated data were generated using real data from all subjects and one experimental condition (synchronous button presses with the right hand ON drug). To assess reproducibility of the results, the simulation was repeated with eight different sets of artifacts taken from all eight experimental conditions. For the purposes of the simulation, we used all the original trials, including the trials with artifacts around the button press, which makes the results for power conservative with respect to the actual analysis.
Figure 1E shows the simulation results. For power estimates, spike artifacts strongly affect the results as would be expected. However, robust averaging enables one to recover the simulated power increase. For coherence estimates, the simulated effect can still be seen even when contaminated data are used. The reason for this is that the power associated with a spike in one channel only affects the relative amount of shared power at any given frequency. However, robust averaging is also advantageous in this case, because it reduces the variance in coherence estimates (Fig. 1E, bottom row), thereby increasing the sensitivity of the statistical analysis.
Based on the results of these simulations, trials with artifacts in the window from −0.2 to 1.5 s around the button press were excluded from the analysis of power but retained for the analysis of coherence (except in Figs. 7 and 9).
Figure 7.

Narrow band coherence peaks in the gamma range were not caused by artifacts. Coherence computation was repeated for the data ON drug from the five hemispheres showing clear gamma coherence peaks after excluding trials with artifacts in the window −1 to 1 s relative to the button press in either M1 or STN signal. The criteria for exclusion were the same as for power analysis (see Materials and Methods and Fig. 1). Time–frequency decomposition was the same as for Figures 5 and 6, and the coherence values were averaged between −0.5 and 0.5 s relative to the button press. Raw data for all the trials are shown as well as the coherence spectra. The subject identification numbers and the trial numbers are detailed on the right.
Figure 9.

Directionality of M1–STN coupling. Coherence and nonparametric Granger causality were computed for individual hemispheres (the data were combined across conditions). This analysis was done for two 1 s windows: baseline, −6 to −5 s, and movement, −0.5 to +0.5 s relative to the button press. Note that, in the baseline period, coherence is present in the beta band with the predominant direction being from M1 to STN, whereas in the movement period, coherence is present in the gamma band with the predominant direction being from STN to M1. In both cases, there is clear correspondence between coherence and Granger causality results.
Excluding data with high frequencies in the evoked response.
To further ensure that the phenomena we report pertain to induced rather than evoked responses, we computed the averages of both the movement-related LFP and virtual electrode data in the time domain and performed time–frequency analysis of these evoked responses using the same settings as for single trials. Even after exclusion of trials containing artifacts, for some hemispheres, we found high-frequency activity around the button press. All of these cases were from M1 virtual electrode data and not from STN–LFPs. Not all of this activity was clearly artifactual, but because this was a likely explanation, we excluded all hemispheres in which such activity was found from our analysis of M1 power. Eight hemispheres were excluded, and, for one additional subject (two hemispheres), only the data recorded ON medication were excluded. Table 2 details the data included in the analysis.
Statistical analyses.
To make inferences about the spectral responses and effects of task and drug, we used statistical parametric mapping (as implemented in SPM8). This treats the time–frequency matrices as images and allowed the identification of regions of time–frequency space showing significant effects over subjects, while controlling for the implicit multiple comparisons using random field theory (Kilner et al., 2005; Kilner and Friston, 2010).
The results of time–frequency analysis were exported to Neuroimaging Informatics Technology Initiative format and smoothed with a Gaussian smoothing kernel with full-width half-maximum of 7.5 Hz by 500 ms for frequencies 0–100 Hz and 25 Hz by 500 ms for frequencies 100–600 Hz.
All the reported findings are significant with familywise error (FWE) correction at the cluster level (p < 0.01 corrected, cluster forming threshold p < 0.05 uncorrected).
Significant features of the mean responses were determined by subjecting mean images across conditions for power and coherence to a single-sample t test across subjects. t tests were performed separately for dominant and nondominant hemispheres so that data from each subject were only used once in each test.
To test for the effects of experimental conditions, we performed repeated-measures ANOVA, treating the experiment as a 2 × 2 factorial design with the factors “task” (SYN vs SEQ) and “drug” (ON vs OFF). Here, data from dominant and nondominant hemispheres were pooled and modeled as dependent to account for the resulting correlations in the error.
To test for correlation with clinical scores, we added to the ANOVA described above a regressor with contralateral hemibody bradykinesia-rigidity scores. This analysis was done separately because the effect of drug is highly correlated with these scores. The scores comprised the sum of items 22–26 of the UPDRS part III score. Motor examination was performed preoperatively, after withdrawal from medication overnight, in a practically defined off state (so that patients had their last antiparkinsonian medication 9–12 h before testing). Motor examination was repeated on the same day 1 h after their usual antiparkinsonian treatment, provided that the levodopa dose was ≥200 mg. When this was not the case, the patient's standard antiparkinsonian medication was replaced by a single dose of 200 mg of levodopa. The contralateral hemibody bradykinesia-rigidity score was selected as the clinical regressor because, unlike contralateral tremor score, this has been found repeatedly to correlate with LFP (beta-band) activity in the subthalamic region (Kühn et al., 2006, 2009; Ray et al., 2008; Chen et al., 2010).
Localization of gamma coherence.
For localization of gamma coherence in several example subjects, source localization was performed using the dynamic imaging of coherent sources (DICS) beamforming method (Gross et al., 2001; Litvak et al., 2010). Before beamforming, trials with artifacts in the LFP data were excluded by thresholding the (nonstandardized) LFP at 20 μV. Beamformer settings were as for the multivariate beamformer (see above).
Directionality analyses.
To determine the directionality of functional coupling, we compared coherence with nonparametric variant of Granger causality (Brovelli et al., 2004). Both measures were computed based on multitaper spectral analysis of two time windows: baseline (−6 to −5 s) and movement (−0.5 to +0.5 s) relative to the button press with spectral resolution of 5 Hz. The directionality analysis did not use robust averaging, and trials in which deflections exceeding 5 SDs occurred in the analysis window were excluded from the analysis.
Results
Localization of M1
Seventeen patients participated in the study. In one of them, LFP recording was only possible from one hemisphere. Thus, localization of M1 using the multivariate beamformer was performed in 33 hemispheres. Locations of individual beamformer peaks for each hemisphere are reported in Table 2. The distance from individual beamformer peaks transformed to MNI space to the location of hand area of M1 was 18.6 ± 6.1 mm (mean ± SD; 6.8 mm minimum, 33 mm maximum).
Responses in M1 and STN induced by voluntary movement
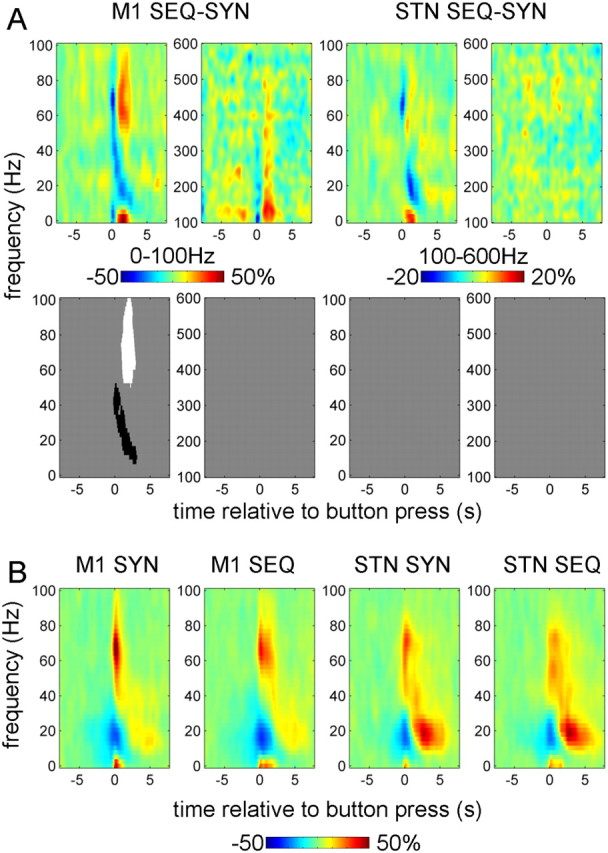
Figure 2 shows the power changes induced by button presses with the contralateral hand (relative to baseline; mean over all conditions). The top row of Figure 2A shows (unthresholded) time–frequency images, and the bottom row reports the corresponding significant clusters.
Figure 2.

Power responses induced by the button press in contralateral M1 and STN. A, Average time–frequency images. Induced responses were baseline corrected (baseline −8 to −5 s) and averaged across conditions. Separate t tests were performed for dominant and nondominant hemispheres and for 0–100 and 100–600 Hz ranges (each condition has 2 spectrograms). The top row shows unthresholded mean time–frequency images relating to M1 (leftmost 4 panels) and STN power change (rightmost 4 panels), and the bottom row reports the corresponding significant positive (white) and negative (black) clusters (p < 0.01, cluster-level FWE correction). B, Induced responses of individual hemispheres. The individual responses whose averages are presented in A were averaged between 0 and 1 s relative to the button press. Dominant and nondominant hemispheres are presented together. Note the presence of clear gamma activity in the 40–90 Hz range in many of the individual hemispheres as well as 300–400 Hz activity clearly present in four hemispheres (for details see Table 2).
Separate t tests were performed for 0–100 and 100–600 Hz ranges. A significant ERD in the beta band and an ERS in a broad (40–250 Hz for M1, 40–600 Hz for STN) gamma band occurred at the time of the movement onset in both the M1 and STN contralateral to the movement. In both dominant and nondominant STNs, there was a distinct peak in the ERS between 300 and 400 Hz.
Figure 2B shows induced responses for individual hemispheres averaged between 0 and 1 s relative to the button press. In M1, most hemispheres displayed a distinct peak in the 50–100 Hz range.
In the STN, discrete peaks in individual subjects were observed under 100 Hz and in the 300–400 Hz range. The 300–400 Hz activity in response to movement was observed in four hemispheres (three subjects) detailed in Table 2. In both M1 and STN, patients with and without a given spectral profile did not differ in terms of disease duration, disease severity, or dominance of tremor or akinesia rigidity (data not shown).
Effects of experimental condition on induced responses
The effect of drug at M1 was manifest as a wide-band increase in induced activity around first button press (Fig. 3). The response in STN was also wide band but more extended in time and with distinct peaks around 10, 70, and 300 Hz.
Figure 3.

Effect of drug on power responses induced by button press in the contralateral M1 and STN. The top row shows the unthresholded contrast images corresponding to the effect of drug in the ANOVA, and the bottom row reports the corresponding significant clusters (p < 0.01, cluster-level FWE correction).
The effect of task on M1 gamma was observed in two different time windows with opposite directions (Fig. 4A). Figure 4B shows the induced responses in the 0–100 Hz range for each task separately (averaged over drug conditions) to aid interpretation of the difference image. Around the time of the first button press, the broad gamma band ERS was reduced during sequential relative to synchronous button presses, but this effect did not reach significance above 50 Hz. The greater gamma activity time-locked to the initial button press in the SYN task may have related directly or indirectly to the greater force required at this point in time in this task. This potentially force-related processing was seen in M1 and the STN but was more marked in M1. Note, however, that gamma power increased relative to the baseline in both cases, and the negative effect emerges because we are considering the difference image between two conditions. After the initial button press, the gamma response in the sequential task was significantly stronger than with synchronous button press. The beta ERS during sequential button press was reduced relative to that during synchronous button presses. In the STN, similar differences were observed but they were much weaker and none reached significance. Notably, the gamma response in the STN is prolonged in both SYN and SEQ tasks in contrast to the brief gamma response in M1 for the SYN task. This difference cannot be explained by exclusion of some of the hemispheres from the M1 power analysis, because excluding the same hemispheres from the STN analysis had no effect on the results (data not shown). There were no significant interactions between drug and task effects.
Figure 4.
Effect of task on power responses induced by button press in the contralateral M1 and STN. A, The top row shows the unthresholded contrast images [in pairs of low (0–100 Hz) and high (100–600 Hz) frequency spectrograms] corresponding to the effect of task in the ANOVA, and the bottom row reports the corresponding significant clusters (p < 0.01, cluster-level FWE correction). B, Averaged power responses (in the 0–100 Hz band only) in M1 and STN for each of the two tasks separately.
Reactivity patterns of M1–STN coherence differ from those of local synchronization
Figure 5 shows baseline corrected M1–STN coherence contralateral to movement. There was an increase in coherence over a narrow gamma band from 65 to 80 Hz at the time of the first button press and shortly thereafter. This effect only reached significance for the dominant hemispheres. For both dominant and nondominant hemispheres, there was also a significant coherence increase in the beta band starting at ∼2 s after the button press, which might be related to the beta band power increase at this time.
Figure 5.
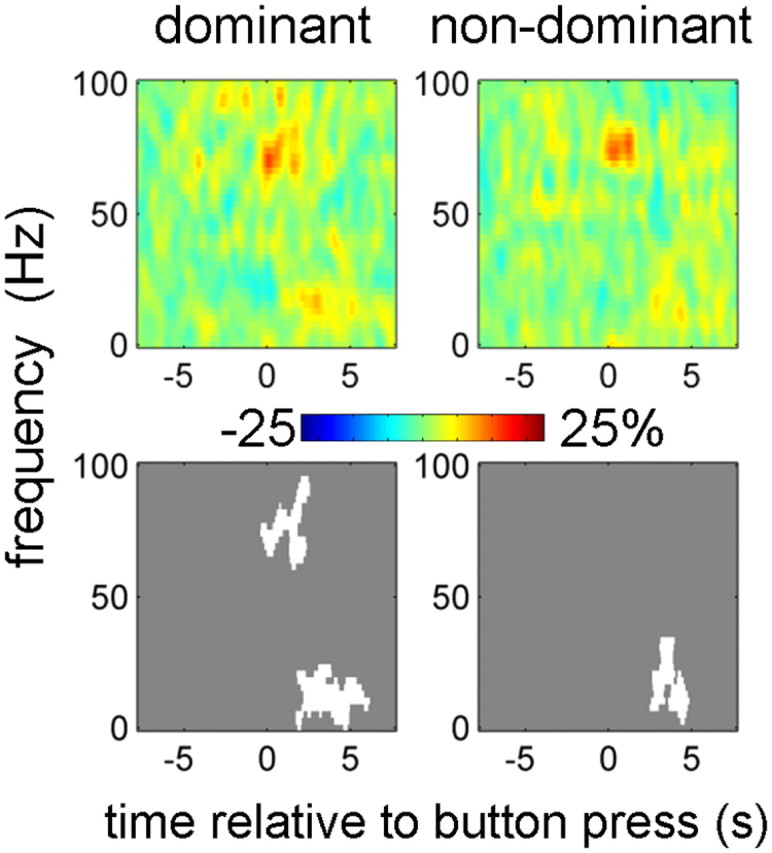
Contralateral M1–STN coherence responses induced by the button press. Coherence images were baseline corrected (baseline −8 to −5 s) and averaged across conditions. Separate t tests were performed for dominant and nondominant hemispheres and for 0–100 and 100–600 Hz ranges. Only 0–100 Hz results are shown because for 100–600 Hz there were no significant effects. The top row shows unthresholded mean time–frequency images, and the bottom row reports the corresponding significant clusters (p < 0.01, cluster-level FWE correction).
Figure 6 shows the effects of experimental condition on coherence. The increase in narrow gamma (65–80 Hz) band coherence at the time of button press was further increased by treatment with dopaminergic medication. For five hemispheres (three subjects), this effect could be seen as distinct peak in the difference between ON and OFF drug spectra (Fig. 6B; for details, see Table 2). To confirm that this effect was specific to M1, we localized the gamma coherence for these hemispheres with DICS. For the purposes of localization, we used combined data from both tasks ON drug, time window of −0.5 to 0.5 s relative to the button press and frequency windows centered around the individual coherence peaks. In three of these hemispheres, the topography of the narrow gamma band coherence with depth LFPs was centered on ipsilateral M1, but in two (from the same subject), coherence was centered a few centimeters anterolateral to M1. The peak values are given in Table 2 (footnotes), and an example is shown in Figure 6C. There were no significant effects of task and no significant interaction of task and drug.
Figure 6.
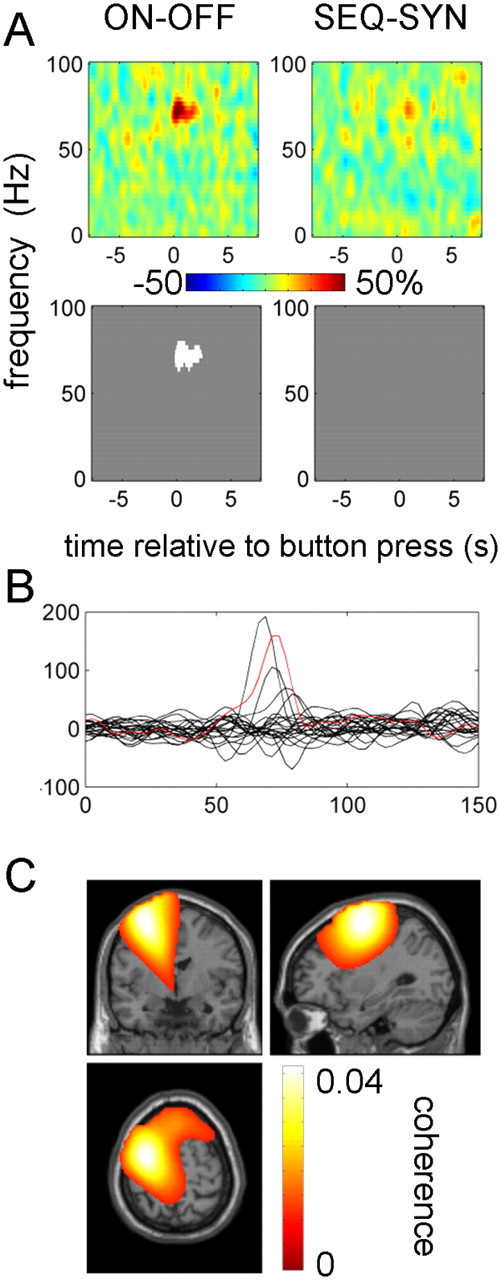
Effects of experimental condition on M1–STN coherence responses. A, The top row shows the unthresholded contrast of M1–STN coherence images corresponding to the effects of drug and task in the ANOVA, and the bottom row reports the corresponding significant clusters (p < 0.01, cluster-level FWE correction). B, Effect of drug on coherence responses in individual hemispheres. Differences between ON and OFF drug coherence images (collapsed across the task factor) were averaged between −0.5 and 0.5 s relative to the button press. The red line corresponds to the localization results in C. C, Localization of gamma coherence in an individual subject (subject 11 left hemisphere). DICS beamformer was applied to button presses with the contralateral hand ON drug pooled across tasks. The time range for the analysis was −0.5 to 0.5 s relative to the button press, and the frequency range was 65–85 Hz. The image was transformed to MNI template space and overlaid on the template structural image. The peak coherence was observed at MNI coordinates (−30, −4, 64).
To further verify that narrow band gamma coherence in our data was not caused by spike artifacts, we repeated the coherence computation for the data ON drug from the five hemispheres showing clear coherence peaks after excluding trials with artifacts in the window −1 to 1 s relative to the button press in either M1 or STN signal. The criteria for exclusion were the same as for power analysis (see Materials and Methods and Fig. 1). The resulting raw data and coherence spectra (without baseline correction) are shown in Figure 7. The coherence peaks in the gamma range were preserved and therefore could not be explained by artifacts. Note that we could not apply the same exclusion criteria to all the data because this would result in too few trials for some subject–condition combinations.
Correlations with motor state
To assess the possible clinical relevance of the spectral changes described above, we performed ANCOVA with the contralateral hemibody bradykinesia-rigidity scores as an additional regressor (Fig. 8). The sign of the scores was flipped so that positive correlations mean that drug-induced increase in reactivity of power or coherence during movement correlates with drug-induced behavioral improvement. No significant correlations were found with M1 power. Significantly correlated clusters of STN power and M1–STN coherence were identified in the 60–90 Hz band around the time of, and just after, the initial button press. These were the same times and frequencies for which there were also significant effects of drug. There was also a significant positive correlation with the 300 Hz power in the STN after the button press. Finally, there was a negative correlation with M1–STN coherence between 15 and 45 Hz at the time of the button press. The same features were observed with pure bradykinesia hemibody scores as a regressor (data not shown). To demonstrate that the correlations with STN power and M1–STN coherence in the 60–90 Hz range were not driven by outliers, we also plotted the relations between these effects and clinical improvement for individual hemispheres (Fig. 8B).
Figure 8.

Correlations between drug-induced changes in power and coherence responses with drug-induced changes in clinical scores. Repeated measures ANCOVA was performed with contralateral hemibody bradykinesia-rigidity scores as an additional regressor. The sign of the scores was changed to negative so that positive correlations would correspond to clinical improvement. A, The top row shows unthresholded contrast images corresponding to the effect of clinical score in the ANCOVA (the units are percentage change from baseline per unit change in motor UPDRS), and the bottom row reports the corresponding significant positive (white) and negative (black) clusters (p < 0.01, cluster-level FWE correction). B, Relationship between the effects of drug in STN power and coherence responses in the 60–90 Hz range and clinical improvement. Power and coherence responses were averaged over −0.5 to 0.5 s window. The solid lines show linear fit to the data (for STN power, r2 = 0.27, p = 0.01; for coherence, r2 = 0.42, p = 0.001).
Directionality analyses
To determine the directionality of the interactions between M1 and STN, we compared coherence computed for individual hemispheres with nonparametric Granger causality analysis. This analysis was done for two 1 s windows: baseline (−6 to −5 s) and movement (−0.5 to +0.5 s) relative to the button press. The results are shown in Figure 9. The baseline coherence spectrum is dominated by beta coherence, with Granger causality indicating a predominant M1 to STN direction as confirmed by a paired t test between averages of Granger causality for the two directions in the 15–30 Hz range (p < 0.02). The movement window is characterized by the presence of 60–90 Hz peaks with STN to M1 directionality. Paired t test between averages of Granger causality for the two directions in the 60–90 Hz range showed this effect only as a trend (p < 0.1) because of the small number of hemispheres with clear directional peaks in the gamma range.
Discussion
In this study of patients with PD, we focused on local and long-range synchronization in the gamma frequency band. Such activity was polymorphic with several features, distinguished by their extent and reactivity. These consisted of discrete peaks in STN power at 60–90 and 300–400 Hz and a wide-band spectral shift extending to 600 Hz. All increased with movement and levodopa treatment. Only STN gamma activity at 60–90 Hz was coherent with activity in M1, which it tended to drive. We obtained some evidence that this coherence could be specific to the motor areas ipsilateral to the STN. However, because our paradigm was not optimal for collecting sufficient data to localize coherence, additional studies are necessary to confirm this finding. Drug effects on both local and distant synchronization at 60–90 Hz correlated with the degree of improvement in contralateral bradykinesia, as did local STN activity at 300–400 Hz. Although correlation does not necessarily imply causation, this finding does provide support for the hypothesis that such high-frequency activities are prokinetic in function. Thus, greater increases in power and coherence are associated with less clinical impairment, in contrast to the opposite findings in the beta frequency band made here and previously (Doyle et al., 2005). These relationships were significant despite the long interval between clinical assessments and recordings and the possible confound of postoperative “stun” or microlesional effects (Chen et al., 2006).
Previously, the only evidence in favor of a “prokinetic” action of the 60–90 Hz activity was its increase with voluntary movement and after treatment with levodopa (Brown et al., 2001; Cassidy et al., 2002; Alegre et al., 2005; Fogelson et al., 2005; Alonso-Frech et al., 2006; Devos et al., 2006; Androulidakis et al., 2007) and a trend toward a correlation between treatment-related increases in background 60–90 Hz power in the STN and clinical improvement (Kühn et al., 2006; Trottenberg et al., 2006). Our findings are all the more remarkable given that high-frequency synchronization has primarily been observed in short-range corticocortical interactions and usually in the context of perception (Fries, 2009). Although several previous studies reported long-range gamma synchronization (Williams et al., 2002; Schoffelen et al., 2005; Lalo et al., 2008), it is still often presumed that synchronization over long distances is unlikely to occur at high frequencies (Kopell et al., 2000; Ray and Maunsell, 2010). A previous study investigating the coupling between the STN–LFP and cerebral cortex during phasic movements in PD patients only sampled EEG from a limited number of sites, obviating even approximate cortical localization, and averaged movement periods with intervening periods without movement in a block design (Lalo et al., 2008).
Interestingly, the 60–90 Hz activity in STN and corresponding coherence, unlike activity at similar frequencies in M1, was unaffected by the type of movement performed. Thus, the increase in gamma activity was little different in terms of its size or duration between synchronous and sequential finger movements. The stereotyped nature of the induced gamma activity across tasks suggests that it might underlie some modulatory feature common to both motor acts, such as phasic arousal or attention (Kempf et al., 2009). The correlation with general motor state would be consistent with a modulatory function, as would the observation that the 60–90 Hz activity was not necessary for movement insofar as it was not always observed. Such 60–90 Hz activity has been identified in and between several sites in the basal ganglia–cortical loop across several disease states, suggesting that it may be primarily physiological rather than pathological (Brown et al., 2001; Cassidy et al., 2002; Kempf et al., 2009). It is modulated by movement and, importantly, varies over the sleep–wake cycle (Brown et al., 2001; Kempf et al., 2009). Moreover, it is enhanced by startle-eliciting stimuli (Kempf et al., 2009), consistent with modulation by arousal state.
The notion that basal ganglia input to motor cortical areas may be related to arousal is not new: Hassler (1978) first proposed that the brainstem reticular activating system impacted on the basal ganglia and thereby motor cortical areas, through the thalamus. Our studies support this hypothesis and suggest that 60–90 Hz activity may mediate this effect. Accordingly, we have demonstrated a phasic (direct or indirect) drive from the STN to the motor cortex in the gamma band around the time of movement. Consistent with this, Williams et al. (2002) showed that STN activity in this frequency band led coupled activity in the cerebral cortex in parkinsonian patients with prominent gamma activity at rest.
In line with previous studies, we also found a spectral peak at ∼300 Hz, which increased after levodopa and correlated with contralateral motor state (Foffani et al., 2003; Kane et al., 2009; López-Azcárate et al., 2010; Ozkurt et al., 2011). There was no evidence for STN–M1 coherence at these very high frequencies, suggesting that they are features of local processing rather than coupled activities in the distributed subcortico-cortical network.
The other gamma band feature was a movement-induced wide-band spectral power increase. This was evident in both M1 and STN. In the latter, it could occur with or without more discrete peaks at 60–90 and 300–400 Hz. The wide-band power change was promoted at both levels by treatment with levodopa. Such high-frequency changes in spectral power have been reported previously and hypothesized to be an LFP correlate of population firing rate (Manning et al., 2009; Miller et al., 2009; Ray and Maunsell, 2010).
The different forms of gamma activity were not evident in all our patients. This might reflect phenotypic variation or disease severity, although no clear association was apparent. Additional studies will be necessary to explore these potential sources of variation in a larger patient cohort. Alternatively, the variability in spectra between patients might be attributable to targeting variance, sampling error given the rather focal source of the gamma activity (Trottenberg et al., 2006), postoperative stun effects (Chen et al., 2006), or insufficient doses of levodopa in some cases. Note that all these activities were identified through their phasic relationship to movement, explaining why previous analyses of resting MEG data failed to identify clear cortical sources of gamma activity that were coherent with STN activity (Hirschmann et al., 2011; Litvak et al., 2011a).
The coherence between some STN and M1 activities raises the possibility of volume conduction. Many arguments have been put forward against this (Brown and Williams, 2005): most convincing is that the discharge of neurons in the STN tends to be locked to those oscillations in the STN–LFP that are coherent with cortex (Levy et al., 2002; Kühn et al., 2005; Trottenberg et al., 2006; Weinberger et al., 2006). It is also worth commenting that the patterns of oscillatory responses were not identical between M1 and STN. This is additional evidence against far-field volume conduction effects being picked up by our subthalamic electrode and points to either functional specialization of the two sites or their differential involvement in the disease process. Thus, task-related local processing was more prominent in M1 than STN, as evidenced by the long duration of broad-band gamma power increases in M1 but not in STN in sequential movements.
It should be noted that coherence is only a measure of linear coupling, and its absence does not rule out the possibility of nonlinear coupling, which can be much more diverse in its mechanisms and therefore more difficult to detect (Jensen and Colgin, 2007). Here we focused on linear coupling, and examining other possibilities will be part of our future work.
Another important issue is the extent to which the effects of treatment and movement could be attributable to changes in sensory re-afference secondary to changes in movement patterns (e.g., reduced bradykinesia). Although this may contribute to differences in responses after movement onset (Muthukumaraswamy, 2010), it cannot explain the altered changes in local power (Kühn et al., 2004; Loukas and Brown, 2004; Doyle et al., 2005; Williams et al., 2005; Androulidakis et al., 2007; Kempf et al., 2007; Alegre et al., 2010) and cortico-STN coherence (Cassidy et al., 2002), which start before the movement in both the beta and 60–90 Hz bands. Consistent with this, reactivity of STN–LFP power and cortico-STN coherence in the beta band still occurs in imagined movements (Kühn et al., 2006), during movement observation (Alegre et al., 2010), and is greatly attenuated during passive movements (Cassidy et al., 2002). Thus, at least some of the changes in spectral responses are likely to have been primary and not an epiphenomenon of re-afference, although the latter remains a possibility with respect to the movement-induced wide-band spectral shift and activity centered on 300 Hz.
In conclusion, we have demonstrated several movement-related increases in the gamma band. Of these, the 60–90 Hz band power in STN and corresponding coherence with M1 correlates with contralateral bradykinesia rigidity in patients with PD, supporting the prokinetic nature of this form of synchronization. That said, this synchronization was independent of the type of movement performed and may therefore underpin a general feature of motor control.
Footnotes
This study was funded by Marie Curie Intra European Fellowship MEIF-CT-2006-038858 and a Coleman-Cohen fellowship of the British Technion Society to V.L. A.J. is supported by a training fellowship from Parkinson's UK, and M.I.H., L.Z., T.F., and P.L. are supported by the UK Parkinson's Appeal. P.B. is supported by the Medical Research Council, Rosetrees Trust, and the National Institute of Health Research Biomedical Research Centre, Oxford. V.L., K.F., and A.E. are supported by the Wellcome Trust. We thank David Bradbury, Janice Glensman, and Zoe Chen for their assistance conducting the experiments.
References
- Alegre M, Alonso-Frech F, Rodríguez-Oroz MC, Guridi J, Zamarbide I, Valencia M, Manrique M, Obeso JA, Artieda J. Movement-related changes in oscillatory activity in the human subthalamic nucleus: ipsilateral vs. contralateral movements. Eur J Neurosci. 2005;22:2315–2324. doi: 10.1111/j.1460-9568.2005.04409.x. [DOI] [PubMed] [Google Scholar]
- Alegre M, Rodríguez-Oroz MC, Valencia M, Pérez-Alcázar M, Guridi J, Iriarte J, Obeso JA, Artieda J. Changes in subthalamic activity during movement observation in Parkinson's disease: is the mirror system mirrored in the basal ganglia? Clin Neurophysiol. 2010;121:414–425. doi: 10.1016/j.clinph.2009.11.013. [DOI] [PubMed] [Google Scholar]
- Alonso-Frech F, Zamarbide I, Alegre M, Rodríguez-Oroz MC, Guridi J, Manrique M, Valencia M, Artieda J, Obeso JA. Slow oscillatory activity and levodopa-induced dyskinesias in Parkinson's disease. Brain. 2006;129:1748–1757. doi: 10.1093/brain/awl103. [DOI] [PubMed] [Google Scholar]
- Androulidakis AG, Kühn AA, Chen CC, Blomstedt P, Kempf F, Kupsch A, Schneider GH, Doyle L, Dowsey-Limousin P, Hariz MI, Brown P. Dopaminergic therapy promotes lateralized motor activity in the subthalamic area in Parkinson's disease. Brain. 2007;130:457–468. doi: 10.1093/brain/awl358. [DOI] [PubMed] [Google Scholar]
- Barnes GR, Litvak V, Brookes MJ, Friston KJ. Controlling false positive rates in mass-multivariate tests for electromagnetic responses. Neuroimage. 2011;56:1072–1081. doi: 10.1016/j.neuroimage.2011.02.072. [DOI] [PMC free article] [PubMed] [Google Scholar]
- Bejjani BP, Dormont D, Pidoux B, Yelnik J, Damier P, Arnulf I, Bonnet AM, Marsault C, Agid Y, Philippon J, Cornu P. Bilateral subthalamic stimulation for Parkinson's disease by using three-dimensional stereotactic magnetic resonance imaging and electrophysiological guidance. J Neurosurg. 2000;92:615–625. doi: 10.3171/jns.2000.92.4.0615. [DOI] [PubMed] [Google Scholar]
- Benecke R, Rothwell JC, Dick JP, Day BL, Marsden CD. Disturbance of sequential movements in patients with Parkinson's disease. Brain. 1987;110:361–379. doi: 10.1093/brain/110.2.361. [DOI] [PubMed] [Google Scholar]
- Brookes MJ, Vrba J, Robinson SE, Stevenson CM, Peters AM, Barnes GR, Hillebrand A, Morris PG. Optimising experimental design for MEG beamformer imaging. Neuroimage. 2008;39:1788–1802. doi: 10.1016/j.neuroimage.2007.09.050. [DOI] [PubMed] [Google Scholar]
- Brovelli A, Ding M, Ledberg A, Chen Y, Nakamura R, Bressler SL. Beta oscillations in a large-scale sensorimotor cortical network: directional influences revealed by Granger causality. Proc Natl Acad Sci U S A. 2004;101:9849–9854. doi: 10.1073/pnas.0308538101. [DOI] [PMC free article] [PubMed] [Google Scholar]
- Brown P. Oscillatory nature of human basal ganglia activity: relationship to the pathophysiology of Parkinson's disease. Mov Disord. 2003;18:357–363. doi: 10.1002/mds.10358. [DOI] [PubMed] [Google Scholar]
- Brown P, Williams D. Basal ganglia local field potential activity: character and functional significance in the human. Clin Neurophysiol. 2005;116:2510–2519. doi: 10.1016/j.clinph.2005.05.009. [DOI] [PubMed] [Google Scholar]
- Brown P, Oliviero A, Mazzone P, Insola A, Tonali P, Di Lazzaro V. Dopamine dependency of oscillations between subthalamic nucleus and pallidum in Parkinson's disease. J Neurosci. 2001;21:1033–1038. doi: 10.1523/JNEUROSCI.21-03-01033.2001. [DOI] [PMC free article] [PubMed] [Google Scholar]
- Cassidy M, Mazzone P, Oliviero A, Insola A, Tonali P, Di Lazzaro V, Brown P. Movement-related changes in synchronization in the human basal ganglia. Brain. 2002;125:1235–1246. doi: 10.1093/brain/awf135. [DOI] [PubMed] [Google Scholar]
- Chen CC, Pogosyan A, Zrinzo LU, Tisch S, Limousin P, Ashkan K, Yousry T, Hariz MI, Brown P. Intra-operative recordings of local field potentials can help localize the subthalamic nucleus in Parkinson's disease surgery. Exp Neurol. 2006;198:214–221. doi: 10.1016/j.expneurol.2005.11.019. [DOI] [PubMed] [Google Scholar]
- Chen CC, Hsu YT, Chan HL, Chiou SM, Tu PH, Lee ST, Tsai CH, Lu CS, Brown P. Complexity of subthalamic 13–35 Hz oscillatory activity directly correlates with clinical impairment in patients with Parkinson's disease. Exp Neurol. 2010;224:234–240. doi: 10.1016/j.expneurol.2010.03.015. [DOI] [PubMed] [Google Scholar]
- Cheyne D, Bells S, Ferrari P, Gaetz W, Bostan AC. Self-paced movements induce high-frequency gamma oscillations in primary motor cortex. Neuroimage. 2008;42:332–342. doi: 10.1016/j.neuroimage.2008.04.178. [DOI] [PubMed] [Google Scholar]
- Degos B, Deniau JM, Chavez M, Maurice N. Chronic but not acute dopaminergic transmission interruption promotes a progressive increase in cortical beta frequency synchronization: relationships to vigilance state and akinesia. Cereb Cortex. 2009;19:1616–1630. doi: 10.1093/cercor/bhn199. [DOI] [PubMed] [Google Scholar]
- Devos D, Szurhaj W, Reyns N, Labyt E, Houdayer E, Bourriez JL, Cassim F, Krystkowiak P, Blond S, Destée A, Derambure P, Defebvre L. Predominance of the contralateral movement-related activity in the subthalamo-cortical loop. Clin Neurophysiol. 2006;117:2315–2327. doi: 10.1016/j.clinph.2006.06.719. [DOI] [PubMed] [Google Scholar]
- Doyle LM, Kühn AA, Hariz M, Kupsch A, Schneider GH, Brown P. Levodopa-induced modulation of subthalamic beta oscillations during self-paced movements in patients with Parkinson's disease. Eur J Neurosci. 2005;21:1403–1412. doi: 10.1111/j.1460-9568.2005.03969.x. [DOI] [PubMed] [Google Scholar]
- Eusebio A, Brown P. Synchronisation in the beta frequency-band: the bad boy of parkinsonism or an innocent bystander? Exp Neurol. 2009;217:1–3. doi: 10.1016/j.expneurol.2009.02.003. [DOI] [PMC free article] [PubMed] [Google Scholar]
- Foffani G, Priori A. Deep brain stimulation in Parkinson's disease can mimic the 300 Hz subthalamic rhythm. Brain. 2006;129 doi: 10.1093/brain/awl209. author reply e60. [DOI] [PubMed] [Google Scholar]
- Foffani G, Priori A, Egidi M, Rampini P, Tamma F, Caputo E, Moxon KA, Cerutti S, Barbieri S. 300-Hz subthalamic oscillations in Parkinson's disease. Brain. 2003;126:2153–2163. doi: 10.1093/brain/awg229. [DOI] [PubMed] [Google Scholar]
- Fogelson N, Pogosyan A, Kühn AA, Kupsch A, van Bruggen G, Speelman H, Tijssen M, Quartarone A, Insola A, Mazzone P, Di Lazzaro V, Limousin P, Brown P. Reciprocal interactions between oscillatory activities of different frequencies in the subthalamic region of patients with Parkinson's disease. Eur J Neurosci. 2005;22:257–266. doi: 10.1111/j.1460-9568.2005.04179.x. [DOI] [PubMed] [Google Scholar]
- Foltynie T, Zrinzo L, Martinez-Torres I, Tripoliti E, Petersen E, Holl E, Aviles-Olmos I, Jahanshahi M, Hariz M, Limousin P. MRI-guided STN DBS in Parkinson's disease without microelectrode recording: efficacy and safety. J Neurol Neurosurg Psychiatry. 2011;82:358–363. doi: 10.1136/jnnp.2010.205542. [DOI] [PubMed] [Google Scholar]
- Fries P. Neuronal gamma-band synchronization as a fundamental process in cortical computation. Annu Rev Neurosci. 2009;32:209–224. doi: 10.1146/annurev.neuro.051508.135603. [DOI] [PubMed] [Google Scholar]
- Gatev P, Wichmann T. Interactions between cortical rhythms and spiking activity of single basal ganglia neurons in the normal and parkinsonian state. Cereb Cortex. 2009;19:1330–1344. doi: 10.1093/cercor/bhn171. [DOI] [PMC free article] [PubMed] [Google Scholar]
- Gibb WR, Lees AJ. The relevance of the Lewy body to the pathogenesis of idiopathic Parkinson's disease. J Neurol Neurosurg Psychiatry. 1988;51:745–752. doi: 10.1136/jnnp.51.6.745. [DOI] [PMC free article] [PubMed] [Google Scholar]
- Gross J, Kujala J, Hamalainen M, Timmermann L, Schnitzler A, Salmelin R. Dynamic imaging of coherent sources: studying neural interactions in the human brain. Proc Natl Acad Sci U S A. 2001;98:694–699. doi: 10.1073/pnas.98.2.694. [DOI] [PMC free article] [PubMed] [Google Scholar]
- Hammond C, Bergman H, Brown P. Pathological synchronization in Parkinson's disease: networks, models and treatments. Trends Neurosci. 2007;30:357–364. doi: 10.1016/j.tins.2007.05.004. [DOI] [PubMed] [Google Scholar]
- Hariz MI, Krack P, Melvill R, Jorgensen JV, Hamel W, Hirabayashi H, Lenders M, Wesslen N, Tengvar M, Yousry TA. A quick and universal method for stereotactic visualization of the subthalamic nucleus before and after implantation of deep brain stimulation electrodes. Stereotact Funct Neurosurg. 2003;80:96–101. doi: 10.1159/000075167. [DOI] [PubMed] [Google Scholar]
- Hassler R. Cerebral correlates of conscious experience. Amsterdam: Elsevier–North Holland; 1978. Interaction of reticular activating system for vigilance and the truncothalamic and pallidal systems for directing awareness and attention under striatal control; pp. 110–129. [Google Scholar]
- Hirschmann J, Özkurt TE, Butz M, Homburger M, Elben S, Hartmann CJ, Vesper J, Wojtecki L, Schnitzler A. Distinct oscillatory STN-cortical loops revealed by simultaneous MEG and local field potential recordings in patients with Parkinson's disease. Neuroimage. 2011;55:1159–1168. doi: 10.1016/j.neuroimage.2010.11.063. [DOI] [PubMed] [Google Scholar]
- Holland PW, Welsch RE. Robust regression using iteratively reweighted least-squares. Commun Stat Theory Methods. 1977;6:813–827. [Google Scholar]
- Jensen O, Colgin LL. Cross-frequency coupling between neuronal oscillations. Trends Cogn Sci. 2007;11:267–269. doi: 10.1016/j.tics.2007.05.003. [DOI] [PubMed] [Google Scholar]
- Jurkiewicz MT, Gaetz WC, Bostan AC, Cheyne D. Post-movement beta rebound is generated in motor cortex: evidence from neuromagnetic recordings. Neuroimage. 2006;32:1281–1289. doi: 10.1016/j.neuroimage.2006.06.005. [DOI] [PubMed] [Google Scholar]
- Kane A, Hutchison WD, Hodaie M, Lozano AM, Dostrovsky JO. Dopamine-dependent high-frequency oscillatory activity in thalamus and subthalamic nucleus of patients with Parkinson's disease. Neuroreport. 2009;20:1549–1553. doi: 10.1097/WNR.0b013e32833282c8. [DOI] [PubMed] [Google Scholar]
- Kempf F, Kühn AA, Kupsch A, Brücke C, Weise L, Schneider GH, Brown P. Premovement activities in the subthalamic area of patients with Parkinson's disease and their dependence on task. Eur J Neurosci. 2007;25:3137–3145. doi: 10.1111/j.1460-9568.2007.05536.x. [DOI] [PubMed] [Google Scholar]
- Kempf F, Brücke C, Salih F, Trottenberg T, Kupsch A, Schneider GH, Doyle Gaynor LM, Hoffmann KT, Vesper J, Wöhrle J, Altenmüller DM, Krauss JK, Mazzone P, Di Lazzaro V, Yelnik J, Kühn AA, Brown P. Gamma activity and reactivity in human thalamic local field potentials. Eur J Neurosci. 2009;29:943–953. doi: 10.1111/j.1460-9568.2009.06655.x. [DOI] [PubMed] [Google Scholar]
- Kilner JM, Friston KJ. Topological inference for EEG and MEG. Ann Appl Stat. 2010;4:1272–1290. [Google Scholar]
- Kilner JM, Kiebel SJ, Friston KJ. Applications of random field theory to electrophysiology. Neurosci Lett. 2005;374:174–178. doi: 10.1016/j.neulet.2004.10.052. [DOI] [PubMed] [Google Scholar]
- Kopell N, Ermentrout GB, Whittington MA, Traub RD. Gamma rhythms and beta rhythms have different synchronization properties. Proc Natl Acad Sci U S A. 2000;97:1867–1872. doi: 10.1073/pnas.97.4.1867. [DOI] [PMC free article] [PubMed] [Google Scholar]
- Kühn AA, Williams D, Kupsch A, Limousin P, Hariz M, Schneider GH, Yarrow K, Brown P. Event-related beta desynchronization in human subthalamic nucleus correlates with motor performance. Brain. 2004;127:735–746. doi: 10.1093/brain/awh106. [DOI] [PubMed] [Google Scholar]
- Kühn AA, Trottenberg T, Kivi A, Kupsch A, Schneider GH, Brown P. The relationship between local field potential and neuronal discharge in the subthalamic nucleus of patients with Parkinson's disease. Exp Neurol. 2005;194:212–220. doi: 10.1016/j.expneurol.2005.02.010. [DOI] [PubMed] [Google Scholar]
- Kühn AA, Kupsch A, Schneider GH, Brown P. Reduction in subthalamic 8–35 Hz oscillatory activity correlates with clinical improvement in Parkinson's disease. Eur J Neurosci. 2006;23:1956–1960. doi: 10.1111/j.1460-9568.2006.04717.x. [DOI] [PubMed] [Google Scholar]
- Kühn AA, Kempf F, Brücke C, Gaynor Doyle L, Martinez-Torres I, Pogosyan A, Trottenberg T, Kupsch A, Schneider GH, Hariz MI, Vandenberghe W, Nuttin B, Brown P. High-frequency stimulation of the subthalamic nucleus suppresses oscillatory beta activity in patients with Parkinson's disease in parallel with improvement in motor performance. J Neurosci. 2008;28:6165–6173. doi: 10.1523/JNEUROSCI.0282-08.2008. [DOI] [PMC free article] [PubMed] [Google Scholar]
- Kühn AA, Tsui A, Aziz T, Ray N, Brücke C, Kupsch A, Schneider GH, Brown P. Pathological synchronisation in the subthalamic nucleus of patients with Parkinson's disease relates to both bradykinesia and rigidity. Exp Neurol. 2009;215:380–387. doi: 10.1016/j.expneurol.2008.11.008. [DOI] [PubMed] [Google Scholar]
- Lalo E, Thobois S, Sharott A, Polo G, Mertens P, Pogosyan A, Brown P. Patterns of bidirectional communication between cortex and basal ganglia during movement in patients with Parkinson disease. J Neurosci. 2008;28:3008–3016. doi: 10.1523/JNEUROSCI.5295-07.2008. [DOI] [PMC free article] [PubMed] [Google Scholar]
- Levy R, Ashby P, Hutchison WD, Lang AE, Lozano AM, Dostrovsky JO. Dependence of subthalamic nucleus oscillations on movement and dopamine in Parkinson's disease. Brain. 2002;125:1196–1209. doi: 10.1093/brain/awf128. [DOI] [PubMed] [Google Scholar]
- Litvak V, Eusebio A, Jha A, Oostenveld R, Barnes GR, Penny WD, Zrinzo L, Hariz MI, Limousin P, Friston KJ, Brown P. Optimized beamforming for simultaneous MEG and intracranial local field potential recordings in deep brain stimulation patients. Neuroimage. 2010;50:1578–1588. doi: 10.1016/j.neuroimage.2009.12.115. [DOI] [PMC free article] [PubMed] [Google Scholar]
- Litvak V, Jha A, Eusebio A, Oostenveld R, Foltynie T, Limousin P, Zrinzo L, Hariz MI, Friston K, Brown P. Resting oscillatory cortico-subthalamic connectivity in patients with Parkinson's disease. Brain. 2011a;134:359–374. doi: 10.1093/brain/awq332. [DOI] [PubMed] [Google Scholar]
- Litvak V, Mattout J, Kiebel S, Phillips C, Henson R, Kilner J, Barnes G, Oostenveld R, Daunizeau J, Flandin G, Penny W, Friston K. EEG and MEG data analysis in SPM8. Comput Intell Neurosci. 2011b;2011:852961. doi: 10.1155/2011/852961. [DOI] [PMC free article] [PubMed] [Google Scholar]
- López-Azcárate J, Tainta M, Rodríguez-Oroz MC, Valencia M, González R, Guridi J, Iriarte J, Obeso JA, Artieda J, Alegre M. Coupling between beta and high-frequency activity in the human subthalamic nucleus may be a pathophysiological mechanism in Parkinson's disease. J Neurosci. 2010;30:6667–6677. doi: 10.1523/JNEUROSCI.5459-09.2010. [DOI] [PMC free article] [PubMed] [Google Scholar]
- Loukas C, Brown P. Online prediction of self-paced hand-movements from subthalamic activity using neural networks in Parkinson's disease. J Neurosci Methods. 2004;137:193–205. doi: 10.1016/j.jneumeth.2004.02.017. [DOI] [PubMed] [Google Scholar]
- Mallet N, Pogosyan A, Sharott A, Csicsvari J, Bolam JP, Brown P, Magill PJ. Disrupted dopamine transmission and the emergence of exaggerated beta oscillations in subthalamic nucleus and cerebral cortex. J Neurosci. 2008;28:4795–4806. doi: 10.1523/JNEUROSCI.0123-08.2008. [DOI] [PMC free article] [PubMed] [Google Scholar]
- Manning JR, Jacobs J, Fried I, Kahana MJ. Broadband shifts in local field potential power spectra are correlated with single-neuron spiking in humans. J Neurosci. 2009;29:13613–13620. doi: 10.1523/JNEUROSCI.2041-09.2009. [DOI] [PMC free article] [PubMed] [Google Scholar]
- Mayka MA, Corcos DM, Leurgans SE, Vaillancourt DE. Three-dimensional locations and boundaries of motor and premotor cortices as defined by functional brain imaging: a meta-analysis. Neuroimage. 2006;31:1453–1474. doi: 10.1016/j.neuroimage.2006.02.004. [DOI] [PMC free article] [PubMed] [Google Scholar]
- Mazzoni P, Hristova A, Krakauer JW. Why don't we move faster? Parkinson's disease, movement vigor, and implicit motivation. J Neurosci. 2007;27:7105–7116. doi: 10.1523/JNEUROSCI.0264-07.2007. [DOI] [PMC free article] [PubMed] [Google Scholar]
- Miller KJ, Sorensen LB, Ojemann JG, den Nijs M. Power-law scaling in the brain surface electric potential. PLoS Comput Biol. 2009;5:e1000609. doi: 10.1371/journal.pcbi.1000609. [DOI] [PMC free article] [PubMed] [Google Scholar]
- Moran A, Bergman H, Israel Z, Bar-Gad I. Subthalamic nucleus functional organization revealed by parkinsonian neuronal oscillations and synchrony. Brain. 2008;131:3395–3409. doi: 10.1093/brain/awn270. [DOI] [PubMed] [Google Scholar]
- Muthukumaraswamy SD. Functional properties of human primary motor cortex gamma oscillations. J Neurophysiol. 2010;104:2873–2885. doi: 10.1152/jn.00607.2010. [DOI] [PubMed] [Google Scholar]
- Oostenveld R, Fries P, Maris E, Schoffelen JM. FieldTrip: open source software for advanced analysis of MEG, EEG, and invasive electrophysiological data. Comput Intell Neurosci. 2011;2011:156869. doi: 10.1155/2011/156869. [DOI] [PMC free article] [PubMed] [Google Scholar]
- Özkurt TE, Butz M, Homburger M, Elben S, Vesper J, Wojtecki L, Schnitzler A. High frequency oscillations in the subthalamic nucleus: a neurophysiological marker of the motor state in Parkinson's disease. Exp Neurol. 2011;229:324–331. doi: 10.1016/j.expneurol.2011.02.015. [DOI] [PubMed] [Google Scholar]
- Ray NJ, Jenkinson N, Wang S, Holland P, Brittain JS, Joint C, Stein JF, Aziz T. Local field potential beta activity in the subthalamic nucleus of patients with Parkinson's disease is associated with improvements in bradykinesia after dopamine and deep brain stimulation. Exp Neurol. 2008;213:108–113. doi: 10.1016/j.expneurol.2008.05.008. [DOI] [PubMed] [Google Scholar]
- Ray S, Maunsell JH. Differences in gamma frequencies across visual cortex restrict their possible use in computation. Neuron. 2010;67:885–896. doi: 10.1016/j.neuron.2010.08.004. [DOI] [PMC free article] [PubMed] [Google Scholar]
- Schoffelen JM, Oostenveld R, Fries P. Neuronal coherence as a mechanism of effective corticospinal interaction. Science. 2005;308:111–113. doi: 10.1126/science.1107027. [DOI] [PubMed] [Google Scholar]
- Sharott A, Magill PJ, Harnack D, Kupsch A, Meissner W, Brown P. Dopamine depletion increases the power and coherence of beta-oscillations in the cerebral cortex and subthalamic nucleus of the awake rat. Eur J Neurosci. 2005;21:1413–1422. doi: 10.1111/j.1460-9568.2005.03973.x. [DOI] [PubMed] [Google Scholar]
- Soto JL, Pantazis D, Jerbi K, Lachaux JP, Garnero L, Leahy RM. Detection of event-related modulations of oscillatory brain activity with multivariate statistical analysis of MEG data. Hum Brain Mapp. 2009;30:1922–1934. doi: 10.1002/hbm.20765. [DOI] [PMC free article] [PubMed] [Google Scholar]
- Thomson DJ. Spectrum estimation and harmonic analysis. Proc IEEE. 1982;70:1055–1096. [Google Scholar]
- Trottenberg T, Fogelson N, Kühn AA, Kivi A, Kupsch A, Schneider GH, Brown P. Subthalamic gamma activity in patients with Parkinson's disease. Exp Neurol. 2006;200:56–65. doi: 10.1016/j.expneurol.2006.01.012. [DOI] [PubMed] [Google Scholar]
- Uhlhaas PJ, Singer W. Neural synchrony in brain disorders: relevance for cognitive dysfunctions and pathophysiology. Neuron. 2006;52:155–168. doi: 10.1016/j.neuron.2006.09.020. [DOI] [PubMed] [Google Scholar]
- Van Veen BD, van Drongelen W, Yuchtman M, Suzuki A. Localization of brain electrical activity via linearly constrained minimum variance spatial filtering. IEEE Trans Biomed Eng. 1997;44:867–880. doi: 10.1109/10.623056. [DOI] [PubMed] [Google Scholar]
- Wager TD, Keller MC, Lacey SC, Jonides J. Increased sensitivity in neuroimaging analyses using robust regression. Neuroimage. 2005;26:99–113. doi: 10.1016/j.neuroimage.2005.01.011. [DOI] [PubMed] [Google Scholar]
- Weinberger M, Mahant N, Hutchison WD, Lozano AM, Moro E, Hodaie M, Lang AE, Dostrovsky JO. Beta oscillatory activity in the subthalamic nucleus and its relation to dopaminergic response in Parkinson's disease. J Neurophysiol. 2006;96:3248–3256. doi: 10.1152/jn.00697.2006. [DOI] [PubMed] [Google Scholar]
- Weinberger M, Hutchison WD, Dostrovsky JO. Pathological subthalamic nucleus oscillations in PD: can they be the cause of bradykinesia and akinesia? Exp Neurol. 2009;219:58–61. doi: 10.1016/j.expneurol.2009.05.014. [DOI] [PubMed] [Google Scholar]
- Williams D, Tijssen M, Van Bruggen G, Bosch A, Insola A, Di Lazzaro V, Mazzone P, Oliviero A, Quartarone A, Speelman H, Brown P. Dopamine-dependent changes in the functional connectivity between basal ganglia and cerebral cortex in humans. Brain. 2002;125:1558–1569. doi: 10.1093/brain/awf156. [DOI] [PubMed] [Google Scholar]
- Williams D, Kühn A, Kupsch A, Tijssen M, van Bruggen G, Speelman H, Hotton G, Loukas C, Brown P. The relationship between oscillatory activity and motor reaction time in the parkinsonian subthalamic nucleus. Eur J Neurosci. 2005;21:249–258. doi: 10.1111/j.1460-9568.2004.03817.x. [DOI] [PubMed] [Google Scholar]
- Yoshida F, Martinez-Torres I, Pogosyan A, Holl E, Petersen E, Chen CC, Foltynie T, Limousin P, Zrinzo LU, Hariz MI, Brown P. Value of subthalamic nucleus local field potentials recordings in predicting stimulation parameters for deep brain stimulation in Parkinson's disease. J Neurol Neurosurg Psychiatry. 2010;81:885–889. doi: 10.1136/jnnp.2009.190918. [DOI] [PubMed] [Google Scholar]
- Zaidel A, Spivak A, Grieb B, Bergman H, Israel Z. Subthalamic span of beta oscillations predicts deep brain stimulation efficacy for patients with Parkinson's disease. Brain. 2010;133:2007–2021. doi: 10.1093/brain/awq144. [DOI] [PubMed] [Google Scholar]
- Zrinzo L, van Hulzen AL, Gorgulho AA, Limousin P, Staal MJ, De Salles AA, Hariz MI. Avoiding the ventricle: a simple step to improve accuracy of anatomical targeting during deep brain stimulation. J Neurosurg. 2009;110:1283–1290. doi: 10.3171/2008.12.JNS08885. [DOI] [PubMed] [Google Scholar]