

Abstract
We measured the “druggability” of the ATP-dependent luciferase derived from the firefly Photuris pennsylvanica that was optimized using directed evolution (Ultra-Glo™, Promega). Quantitative high throughput screening (qHTS) was used to determine IC50’s of 198,899 samples against a formulation of Ultra-Glo luciferase (Kinase-Glo™). We found that only 0.1% of the Kinase-Glo inhibitors showed an IC50 < 10 μM compared to 0.9% found from a previous qHTS against the firefly luciferase from Photinus pyralis (lucPpy). Further, the maximum affinity identified in the lucPpy qHTS was 50 nM while for Kinase-Glo this value increased to 600 nM. Compounds with interactions stretching outside the luciferin binding pocket were largely lost with Ultra-Glo luciferase. Therefore, Ultra-Glo luciferase will show less compound interference when used as an ATP sensor compared to lucPpy. This study demonstrates the power of large-scale quantitative analysis of structure-activity relationships (>100K compounds) in addressing important questions such as a target's druggability.
Keywords: chemical profiling, enzyme assay, PubChem, luciferase, quantitative high-throughput screening
Firefly luciferase has been used to measure ATP concentration, the turnover of pro-luciferin substrates,1–3 and as a reporter of cell-based gene expression; this has enabled the development of high-throughput screens (HTS) for a wide variety of biological activities. Numerous assays have been developed for protein kinases,4,5 including measurement of phosphorylated peptide product using solid-phase supports as in SPA6 or IMAP7 as well as recent generic assays for ATPases that employ an ADP-specific antibody.8–10 Luciferase-coupled assays do not require antibodies or fluorescent labels thus providing a generic platform for screening that reduces assay development time and reagent costs.11–13 Therefore, luciferase-based assays remain one of the most ubiquitous technologies for the measurement of ATP concentrations in enzyme assays, particularly kinases – one of the largest, druggable enzyme families that includes sugar, lipid and protein kinases.11,12,14 In these assays, the ATP-dependence of firefly luciferase is used to measure the ATP concentration where the luminescence signal is inversely proportional to kinase activity.
A consideration in any assay that uses an enzyme as a reporter or coupled component is inadvertent inhibition of the reporter enzyme by compounds from the library.5,15–17 Ideally, enzyme reporters would be insensitive to compound inhibition but inhibition of firefly luciferase is commonly observed; both the ATP and luciferin binding sites can be bound by many scaffolds commonly found in compound libraries (e.g. benzimidazoles and benzthiazoles). The ATP-dependent luciferase enzyme from the firefly Photinus pyralis (lucPpy) is employed in several commercial formulations of firefly luciferase used for ATP detection. In a recent profiling screen of approximately 72,000 compounds (see PubChem AID: 411) against lucPpy contained in a formulation termed PK-Light™ (Lonza Corp), we found approximately 3% of this library showed inhibitory concentration-responses, of which 681 (0.9%) exhibited IC50s < 10 μM, well within typical compound screening concentration ranges.15 Investigation of the structure-activity relationships (SAR) of luciferase inhibitors as well as their mode of action revealed classes of luciferin and adenylate competitive compounds as well as large classes of compounds that were non-competitive with either ATP or luciferin. However, examination of representative compounds from the various inhibitor classes identified in the lucPpy qHTS showed that nearly all these were inactive in a luciferase formulation termed Kinase-Glo™(Promega Corp). Luciferase assay formulations such as PK-Light and Kinase-Glo all contain high amounts of luciferin (~mM) but lack ATP to allow for sensitive detection of ATP concentration. However, Kinase-Glo differs from other luciferase-based ATP detection formulations in that it contains an optimized luciferase derived from the firefly Photuris pennsylvanica (lucPpe)18 known as Ultra-Glo™ (Promega Corp).19 Wild-type lucPpe and lucPpy show 68% similarity.18 Therefore, one possibility to explain the reduced potency of lucPpy inhibitors in Kinase-Glo is that the Ultra-Glo luciferase simply possesses a different SAR and exhaustive profiling of Kinase-Glo would yield a similar number of inhibitors as obtained for the lucPpy formulation. Indeed, in our previous study we observed that small changes in structure (e.g., the addition of a methyl group) showed a marginal increase in Kinase-Glo inhibition (IC50 ~ 10 μM), supporting the idea that the Ultra-Glo luciferase had an altered SAR. Another possibility is that Ultra-Glo luciferase is genuinely more resistant to inhibitors and thus an analogous qHTS profile would show a reduction in the lucPpy inhibitors without a concomitant increase in new inhibitor classes. To explore both the amount and type of compounds associated with inhibition of Ultra-Glo luciferase we describe here the qHTS of this luciferase against 198,899 samples of the MLSMR that included all the compounds assayed previously against the lucPpy. The results show a marked loss of all inhibitor classes associated with lucPpy without a corresponding increase in new inhibitor chemotypes, thus providing evidence that Ultra-Glo luciferase is a more optimal enzyme reporter for ATP detection in HTS. Comparisons of the SAR derived from the qHTS of Kinase-Glo to that previously defined for lucPpy15 as well as analysis of representative inhibitors, illustrate that the reduced inhibitor susceptibility of Ultra-Glo luciferase is due to a loss of inhibitors whose interactions stretch outside the luciferin pocket including those that likely interact with the adenylate pocket.
MATERIAL AND METHODS
Reagents
ATP, BSA, Tween 20, potassium chloride, imidazole, D-luciferin and the luciferase control compound 1 (SIB 1757)20 were purchased from Sigma-Aldrich. Magnesium chloride was acquired from Quality Biological and dimethylsulfoxide (DMSO), certified A.C.S. grade, was purchased from Fisher. The Ultra-Glo luciferase-based detection reagents used were Kinase-Glo, Kinase-Glo Plus™ and Kinase-Glo Max™ (Promega; Madison, Wi). Purified wild-type lucPpy luciferase was obtained from Sigma (cat# L9506) and purified Ultra-Glo luciferase was provided as a gift from Promega.
Preparation of compound libraries and control plates
The 198,899 member library was collected from several sources: 185,021 compounds from the NIH MLSMR,21 1,280 compounds from Sigma-Aldrich (LOPAC1280), 1,120 compounds from Prestwick Chemical Inc., 361 purified natural products from TimTec (Newark, DE), three 1,000-member combinatorial libraries from Pharmacopeia (Princeton, NJ), libraries that include pharmacologically active compounds such as opioids, adrenergics, cholinergics, serotonergics, dopaminergics, histaminergics, and endocannabinioids from Tocris (1,105 compounds; Ellisville, Missouri), Biomol (256 compounds; Plymouth Meeting, PA), Spectrum (1,952 compounds; Gardena, CA), as well as 198 compounds synthesized at the NCGC, 1,957 compounds from the National Cancer Institute, 48 nucleoside and nucleotide-based compounds from Biolog Life Science Institute distributed by Axxora LLC (San Diego, CA) and from various Centers for Chemical Methodology and Library Development including 47 from the University of North Carolina, 81 from Texas A&M University, 96 from the University of Wisconsin, 252 from University of Pittsburg, 989 from the University of Pennsylvania, and 1,136 compounds from Boston University. Interplate dilutions of the libraries were prepared as described.22, 23
Controls were added from a separate 1,536-well compound plate as follows: Columns 1 and 2, sixteen-point titrations in duplicate of ATP and the control inhibitor 1 respectively (both beginning at 10 mM in DMSO); Column 3, the neutral control (DMSO); Column 4, the control inhibitor (10 mM in DMSO).
Luciferase assay and qHTS
Four μL/well of substrate/buffer (10 μM ATP, 50 mM KCl, 7 mM MgCl2, 0.05% BSA, 0.01% Tween 20, and 50 mM imidazole pH 7.2, final concentration) was dispensed into Kalypsys solid white 1,536-well plates using a bottle-valve solenoid-based dispenser (Kalypsys). Twenty-three nL of compound solution was transferred to the assay plate using a Kalypsys pin tool equipped with a 1,536-pin array24 containing 10 nL slotted pins (FP1S10, 0.457 mm diameter, 50.8 mm long; V&P Scientific). Following transfer, 2 μL/well of Kinase-Glo was dispensed for a final assay volume of 6 μL/well. Following an 8 min incubation at ambient temperature, luminescence was detected by a ViewLux (Perkin Elmer) using a 5 second exposure time and 1X binning. All screening operations were performed using a fully integrated Kalypsys robotic system containing one RX-130 and two RX-90 Staübli anthropomorphic robotic arms.25
qHTS Data and SAR Analysis
Screening data was processed using in-house developed software. Percent activity was computed from the median values of the uninhibited, or neutral, control (32 wells located in column 3) and the 40 μM of 1, or 100% inhibited, control (32 wells, column 4), respectively. For assignment of plate concentrations and sample identifiers, ActivityBase (ID Business Solutions Ltd, Guildford, UK) was used for compound and plate registrations. An in-house database was used to track sample concentrations across plates. Correction factors were generated from 33 control assay plates containing vehicle (DMSO) only that were inserted uniformly throughout the screen to monitor background systematic variation in assay signal. Curve fitting was performed using an in-house developed algorithm (a version of which is available online).26 Curve-fitting and SAR analysis was performed as described15,22 where the noise of the assay was estimated by calculating the standard deviation (SD) of the activity values obtained at the lowest tested compound concentration and outliers were identified and masked by modeling the Hill equation and determining if the differences exceeded the assay noise. The qHTS data was depicted using Origin (OriginLab). Data have been deposited in PubChem (AID 1379).
Synthesis of 2-phenylbenzothiazole compounds
To a mixture of 2-bromobenzo[d]thiazole or 2-bromo-6-methoxybenzo[d]thiazole (0.25 mmol) and selected arylboronic acids/boronates (0.325 mmol) in 2 mL DME in a microwave tube (2–5 mL capacity) was added Pd(PPh3)4 (5 mol %, 0.012 mmol) and a 2.0 M aqueous solution of K2CO3 (0.25 mmol). The mixture was irradiated with MW for 5–45 minutes at 150 °C, cooled, diluted with 25 mL ethyl acetate and filtered through celite. The solvent was evaporated and the crude material was purified on a Biotage® silica gel column. Gradient elution with ethyl acetate in hexanes (proportions changed based upon the Rf value of the products) gave the coupled products as solids.
Analytical QC of compounds
The entire library was subjected to purity analysis before plating (Galapagos Biofocus DPI, South San Francisco, CA). Active compounds that were obtained from commercial sources were re-analyzed for purity. For these re-supplied compounds the purity analysis was performed via LCMS analysis on a Waters ACQUITY reverse phase UPLC System and 1.7 μm BEH column (2.1 X 50 mm) using a linear gradient in 0.1% aqueous formic acid (5% ACN in water increasing to 95% over 3 minutes). Compound purity was measured based upon peak integration from both UV/Vis absorbance and ELSD, and compound identity was based upon mass analysis; all compounds passed purity criteria (>95%). See Supporting Information for proton and high-resolution mass spectral data of selected compounds.
Follow-up luciferase assays
A total of 39 compounds were obtained and subjected to several luciferase assays using a 1,536-well plate format. Purified firefly luciferases were assayed in a buffer containing 50 mM Tris-Acetate pH, 10 mM Mg-acetate, 0.01% Tween, 0.05% BSA, 10 μM D-luciferin, 10 μM ATP and luciferase at 10 nM. Alternatively, this same buffer and enzyme concentration was used to vary either D-luciferin or ATP concentrations to determine KM or concentration-response curves (CRCs). For assaying Kinase-Glo, Kinase-GloPlus, or Kinase-GloMax the same buffer used in the qHTS was used. Luminescence was collected on the Perkin Elmer Viewlux. Each compound was assayed in duplicate and this experiment repeated on two or three separate days.
RESULTS
Luciferase qHTS
We used a commercially available detection system containing Ultra-Glo luciferase, luciferin, and buffer components (Kinase-Glo) for the screen. This system showed linear performance of enzyme activity through a range of 2 to 10 μM of ATP in a manner similar to the lucPpy contained in PK-Light for which the previous qHTS was performed,15 supporting similar sensitivity to ATP between the two enzymes. Therefore, identical buffer systems containing 10 μM ATP and high (~50×KM) concentrations of luciferin could be used for both qHTS studies. The screen was performed in 1,536-well plate format with a final assay volume of 6 μL per well. Compound 1 (Figure 1), identified as an inhibitor of Ultra-Glo luciferase in our previous study, was used as an inhibitor control.
Figure 1. Summary of the qHTS.

a) Results of the Ultra-Glo luciferase qHTS. Concentration-response data are shown for active (red; percentage of actives noted) and inactive (blue) compounds. b). Results of the previous qHTS using the lucPpy formulation15 is shown for comparison. Activities for 352 compounds (green) in the lucPpy qHTS were reduced because of a partially blocked tip. Percentage of actives noted in red. c) Control inhibitor (1) titration response curves and structure of 1 are shown. d) Representation of class 1a, 1b and 2a CRCs derived from the Ultra-Glo luciferase qHTS. Data points are shown in red with the fitted CRC curves shown in blue.
The Ultra-Glo luciferase activity was screened against approximately 199K compounds using qHTS, where the activity is measured across multiple concentrations allowing the generation of CRCs for all library compounds.22 In the luciferase qHTS, the library was tested as a series of at least seven 5-fold dilutions at a beginning concentration of approximately 40 μM.
A total of 1,088 1,536-well microtiter plates were processed. The assay showed an average signal-to-background ratio = 8.1±2.9 and Z' = 0.74±0.13, indicating a performance that was comparable to the previous qHTS against lucPpy (Figure 1a, b). The inhibitor control titrations included on every plate were highly precise as the judged by the minimum significance ratio (MSR)27 for compound 1 that was calculated to be 1.89n=1,088 (Fig. 1c).
The qHTS resulted in titration-response profiles of 198,899 samples derived from approximately 1.53 million assayed wells (Fig. 1b). The screen was performed using an optimized 1,536-well protocol (Table 1) so that one CRC was generated per second on the Kalypsys automated system.25 Automated curve-fitting was performed to generate CRC fits to the data corresponding to each sample. The CRCs were then separated into four classes: (1) complete CRCs containing upper and lower asymptotes, (2) incomplete CRCs having an upper asymptote, (3) poorly fit CRCs or where the activity was observed only at the highest tested concentration, and (4) inactive where activity of all unmasked data points was below 30%. Each CRC class was further divided based on the efficacy of response (e.g. CRC classes “1a, 1b”; see Inglese et al.).22
Table 1.
Final 1536-well assay protocol
| Step | Parameter | Value | Description |
|---|---|---|---|
| 1 | Reagent | 4 μL | 10 μM ATP buffer |
| 2 | Library compounds | 23 nL | 40 μM to 0.24 nM dilution series |
| 3 | Controls | 23 nL | ATP, compound 1, DMSO |
| 4 | Reagent | 2 μL | Detection Buffer |
| 5 | Incubation time | 8 min | RT incubation |
| 6 | Assay readout | 5 sec | Luminescence read |
|
| |||
| Step | Notes | ||
|
| |||
| 1 | Medium-binding white solid Kalypsys plates. 100 μL pre-dispense, four tip dispense columns 1–48. Buffer: 50 mM KCl, 7 mM MgCl2, 10 μM ATP, 0.01% Tween, 0.05% BSA. Mixture kept on ice. | ||
| 2 | Pin-tool transfer compound library for a (final) range of 40 μM to 0.24 nM | ||
| 3 | Pin-tool transfer, Column 1 sixteen-point titrations in duplicate of ATP beginning at 10 μM (final), Column 2, sixteen-point titrations in duplicate of compound 1 beginning at 40μM (final), Column 4, compound 1 at 40 μM (final). Pin-tool transfer tip wash sequence: DMSO,iPA, MeOH, 3-s vacuum dry. | ||
| 4 | Kinase-Glo luminescent reagent containing Ultra-Glo luciferase and high 4 concentrations (~mM) of luciferin. 100 μL pre-dispense, four tip dispense columns 1–48 | ||
| 5 | RT incubation in auxilliary plate hotel | ||
| 6 | PE ViewLux, clear filter | ||
The screen identified 0.78% of the library samples as active (Class 1–3). The distribution of potencies within each CRC class is summarized in Table 2. Compounds associated with the highest quality CRCs, Class 1a, 1b and 2a, comprising 43, 11, and 232 samples, respectively, represented 0.15% of the collection (Fig. 1d; Table 2). Class 2b was the largest class of actives containing 837 samples (0.4%) while Class 3 totaled 413 samples (0.2%). Class 1 CRCs spanned a potency range from 0.6 μM to 10μM and included the positive control compound 1 that was present within the Tocris library. In contrast, the maximum inhibitor potency obtained in the lucPpy qHTS was 50 nM. Potencies for Class 2a and 3 should be considered approximations as they are extrapolated from incomplete CRCs.
Table 2.
Analysis of qHTS. Numbers in parenthesis represent the % of inhibitors found for this CRC class in the lucPpy qHTS
| Curve Classification | ||||||
|---|---|---|---|---|---|---|
| IC50 (μM) | 1a | 1b | 2a | 2b | 3 | Total |
| < 0.1 | 0 | 0 | 0 | 0 | 0 | 0 |
| 0.1 to 1 | 3 | 11 | 0 | 0 | 0 | 14 |
| 1 to 10 | 40 | 0 | 139 | 335 | 159 | 673 |
| 10 to 100 | 0 | 0 | 93 | 502 | 254 | 849 |
|
| ||||||
| Total per classification | 43 | 11 | 232 | 837 | 413 | 1,536 |
| % of Library | 0.02,(0.29) | 0.01,(0.19) | 0.12,(0.34) | 0.42,(1.79) | 0.21,(0.59) | 0.78,(3.19) |
Comparison of activity between lucPpy and Ultra-Glo luciferase
For the lucPpy qHTS we observed that 3.1% of the library samples were active (Class 1–3)15 whereas only 0.9% of the samples were active in the Ultra-Glo luciferase qHTS. Potent inhibitory compounds showing high quality CRCs were dramatically reduced in Ultra-Glo luciferase compared to the lucPpy formulation as only 0.15% of compounds in the Ultra-Glo luciferase qHTS had a CRC class 1a, 1b, or 2a CRC versus 0.82% for lucPpy qHTS (Table 2). Additionally, we found only 0.03% Class 1 CRCs in Ultra-Glo luciferase while 0.48% was found within this CRC class using the lucPpy formulation (Table 2). Further, of the Class 1 CRCs from the lucPpy luciferase qHTS 50% were found as inactive (class 4) in the Ultra-Glo luciferase qHTS.
The potency distribution between the qHTS against Ultra-Glo and lucPpy luciferase is summarized in Figure 2. Only 0.1% of the Ultra-Glo luciferase inhibitory compounds showed an IC50 < 10 μM compared to 0.9% using the lucPpy formulation. Overall, the Ultra-Glo luciferase qHTS showed an average potency that is seven-fold weaker than what was found in the lucPpy qHTS.
Figure 2. Difference in potency distribution between lucPpy and Ultra-Glo luciferase formulations.

Active compounds from the previous lucPpy qHTS and the Ultra-Glo luciferase qHTS were compared and the ΔLogAC50 values were calculated. Negative ΔLogAC50 values represent compounds that were less potent in the Ultra-Glo luciferase compared to the lucPpy qHTS, while positive ΔLogAC50 values represent compounds that were more potent in the Ultra-Glo luciferase compared to the lucPpy qHTS.
Characterization of selectivity between Ultra-Glo and lucPpy luciferases
We have identified several prominent scaffolds that act as luciferase inhibitors including several luciferin mimetic compounds such as those containing a benzothiazole core.15 The same chemical series were again identified in the Ultra-Glo luciferase screen but with greatly reduced activity (Figure 3). In general there was a marked loss of inhibitors containing benzoxazole (4), benzthiazole (5), or benzimidazole (6) cores (reduced by 93%, 80%, and 76%, respectively; Figure3) that likely bind at luciferyl-adenylate pocket of luciferase. We also noted that a potent inhibitor class containing a 3,5-diaryl-oxadiazole core (2, Figure 3), where we have found that the inhibition cannot be completely relieved by addition of high substrate concentrations, was also reduced but to a lesser extent (60% reduction). Similarly, the number of active compounds in the benzamide class (3, Figure 3) was reduced by 80% in the Ultra-Glo luciferase qHTS.
Figure 3. Comparison of inhibitor scaffold representation between lucPpy and Ultra-Glo luciferase formulations.

Center pie charts represent the amount of active (darker grey slices) and related inactive analogs (light grey area in each pie chart) for prominent luciferase inhibitor scaffolds (2–6) for the lucPpy (top pie) and Ultra-Glo luciferase (bottom pie) qHTS. The scaffolds and the associated analogs were determined as described in Auld et al.15 The number of lucPpy active analogs was reduced from 70 to 27 (2, 3,5-diaryl-oxadiazoles), 98 to 23 (3, benzamides), 21 to 5 (4, benzoxazoles), 89 to 6 (5, benzthiazoles), 55 to 11 (6, benzimidazoles) in the Ultra-Glo luciferase qHTS. The corresponding number of structurally related inactive analogs increased from 1,192 to 1,442 in the Ultra-Glo luciferase qHTS.
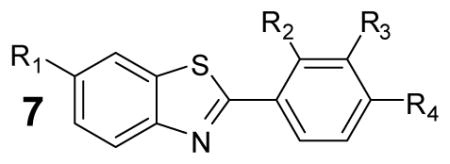
To investigate the reason for the reduced inhibitor fraction in the Ultra-Glo luciferase qHTS experiments we obtained represented compounds and characterized these against purified Ultra-Glo luciferase and lucPpy. We also measured activity of these compounds in several commercial preparations of Ultra-Glo luciferase. To explore the luciferin binding pocket, we examined twenty-two 2-phenylbenzothiazole (7) analogs against the two luciferases (Table 3). These compounds represented minimal luciferin mimetic analogs and were generally either unsubstituted or contained simple halogen or methyl group substitutions. We determined similar potency values for these compounds using either purified Ultra-Glo luciferase or lucPpy and KM levels of substrates against this series of analogs (Table 3). Therefore, the specificity within the luciferin pocket is similar between the two luciferases. Consistent with competitive behavior, we also noted that all these compounds showed greatly weakened inhibition or became inactive in the commercial Ultra-Glo luciferase-containing reagents that contain excess luciferin substrate (Table 3).
Table 3.
Characterization of selected 2-phenylbenzothiazole analogs
| |||||||||
|---|---|---|---|---|---|---|---|---|---|
| Analogue # | R1 | R2 | R3 | R4 | IC50Ultr aGlo | IC50lucPpy | IC50KinGlo | IC50KinGlo Plus | IC50KinGlo Max |
| a | H | H | H | dimethylamine | 0.32± 0.0 | 0.2±0.0 | 10.7±3.4 | Inactive | Inactive |
| b | H | H | H | Cl | 1.4± 0.18 | 4.5±0.0 | >50 | Inactive | Inactive |
| c | OMe | H | H | F | 0.86± 0.08 | 1.3±0.09 | >50 | Inactive | Inactive |
| d | OMe | H | F | H | 1.1± 0.14 | 1.5±0.1 | >50 | Inactive | Inactive |
| e | OMe | F | H | H | 0.5± 0.05 | 0.6±0.0 | >50 | Inactive | Inactive |
| f | OMe | Cl | H | F | 4.9± 1.1 | 5.4±0.7 | >50 | Inactive | Inactive |
| g | OMe | H | H | Cl | 3.8± 0.5 | 3.5±0.0 | >50 | Inactive | Inactive |
| h | OMe | O-methylbenzene | H | H | 4.3± 0.2 | 8.9±0.6 | >50 | Inactive | Inactive |
| i | OMe | H | O-methylbenzene | H | 30± 3 | 13.4±1 | Inactive | Inactive | Inactive |
| j | OMe | H | H | CN | 6.1± 1.3 | 5.7±0.9 | Inactive | Inactive | Inactive |
| k | OMe | H | H | OMe | 4.1± 0.4 | 2.2±0.0 | >50 | Inactive | Inactive |
| l | OMe | OMe | H | H | 5.6± 1.3 | 3.2±0.0 | >50 | Inactive | Inactive |
| m | OMe | H | OMe | OMe | 3.8± 0.6 | 2.8±0.0 | >50 | Inactive | Inactive |
| n | OMe | H | acetamide | H | 1.9± 0.4 | 2.9±0.2 | >50 | Inactive | Inactive |
| o | OMe | H | Me | H | 0.67± 0.07 | 1.5±0.1 | >50 | Inactive | Inactive |
| p | OMe | H | H | dimethylamine | 2.7± 0.6 | 0.7±0.04 | >50 | Inactive | Inactive |
| q | H | H | F | H | 7.8± 0.3 | 24.2±1.6 | Inactive | Inactive | Inactive |
| r | H | H | OMe | OMe | 1.9± 0.3 | 3.2±0.0 | >50 | Inactive | Inactive |
| s | H | H | H | OMe | 0.36± 0.02 | 1.0±0.0 | >50 | Inactive | Inactive |
| t | H | OMe | H | H | 7.7± 1.4 | 11.3±1.8 | >50 | Inactive | Inactive |
| u | H | H | H | CN | 2.1± 0.2 | 6.3±0.0 | >50 | Inactive | Inactive |
| v | H | H | H | acetamide | 3.1± 0.5 | 3.0±0.2 | >50 | Inactive | Inactive |
Activity of compounds was determined by measurement of luminescence using either purified luciferase enzyme assays (IC50UltraGlo or IC50lucPpy) or formulations of UltraGlo (IC50KinGlo , IC50K inGlo Plus , IC50KinGlo Max). Data shown are mean± SD for at least three replications.
However, we noted that a 4-(6-methoxybenzo[d]thiazol-2-yl)-N,N-dimethylaniline (7p) showed nearly 4-fold weaker potency against purified Ultra-Glo luciferase than lucPpy and this compelled us to examine additional analogs (7a – 7x; Table 3) at the 2-position of the benzothiazole that incorporated larger substitutions. For this purpose we examined the potency of several analogs under a range of luciferin and ATP concentrations (Figure 4) using purified Ultra-Glo and lucPpy luciferases. Further we compared 7p as well as two analogs that contained a larger pyrazole-containing substitution to representative analogs mentioned above that contained simple halogen substitutions (e.g. 7d, 7e and 7f). We found that the halogen substituted analogs behaved as pure luciferin competitive inhibitors with substrate variation showing similar effects between the two luciferases (Figure 4a–c). However, 7p and two compounds containing a 1-benzyl-1H-pyrazole at the 2-position (Figure 4; 7w and 7x) showed different substrate dependences for the two luciferases. In the case of Ultra-Glo luciferase, these compounds remained largely luciferin competitive as shown by the general loss of activity at high luciferin concentrations (Figure 4d–f). However, for lucPpy, these compounds showed greater potency for lucPpy than Ultra-Glo luciferase upon either luciferin or ATP variation (compare red and black fits, Figure 4e–f). In the qHTS, D-luciferin was present in large excess in both the Ultra-Glo and lucPpy luciferase formulations and we measured only a 4-fold higher affinity KM for luciferin with Ultra-Glo luciferase than lucPpy (0.9 ± 0.1 μM vs. 4 ± 0.4 μM respectively). Therefore changes in substrate affinity alone cannot explain the large loss of these inhibitory classes in the qHTS, rather a shift to a non-competitive luciferin binding mode due to interactions outside the luciferase pocket appears to result in more prevalent inhibitors for lucPpy formulations.
Figure 4. Comparison lucPpy and Ultra-Glo luciferase against 2-phenylbenzothiazole luciferase inhibitors at multiple substrate concentrations.

Graphs of ATP variation or luciferin variation (inset) are shown. Luciferin or ATP was varied at 0.25 μM, 2 μM, 25 μM and 250 μM resulting in four sets of CRCs. In each case the constant substrate was present at 250 μM. The lucPpy data is shown as solid circles with red CRC fits and the Ultra-Glo luciferase is shown as open circles with black fitted lines. The structures of the inhibitors assayed are also shown. The top graphs show compounds with luciferin competitive behavior against both lucPpy and Ultra-Glo luciferase, while the bottom graphs demonstrate inhibitors which maintain potency at high ATP or luciferin concentrations for lucPpy but not Ultra-Glo luciferase.
To further test possible reasons for this selectivity we examined the potencies at Ultra-Glo luciferase for a series of quinoline compounds identified in the lucPpy qHTS that were shown to be competitive with ATP and luciferin and modeled into the adenylate binding pocket of firefly luciferase.15 Consistent with this pocket serving as a mediator of selectivity between the two luciferases we found a marked loss of activity for these quinolines for Ultra-Glo luciferase (Figure 5). Two of the most potent quinolines for lucPpy were 8 (Figure 5, lucPpy IC50=0.5 μM) and 9 (Figure 5, lucPpy IC50=4.0 μM). Both 8 and 9 and showed IC50s >10 μM, outside the typical screening concentration range, against Ultra-Glo luciferase (Figure 5). Further, in formulations of Ultra-Glo luciferase this series is inactive. This suggests that favorable interactions within the adenylate pocket are present in lucPpy that are absent in Ultra-Glo luciferase suggesting the adenlyate pocket as one of the regions that determines the large reduction in the inhibitors for Ultra-Glo luciferase.
Figure 5. Comparison of lucPpy and Ultra-Glo luciferase inhibition for a series of quinoline analogs.

Red fits, solid circles and squares are lucPpy, and black fits, open circles and squares are Ultra-Glo luciferase for 8 (squares) or 9 (circles) assayed using KM levels of substrates. Also shown is the activity of these two compounds using Kinase-Glo for 8 (open triangles) and 9 (upside-down open triangles). The inset shows activity in the qHTS for a series of related quinolines in the lucPpy qHTS (solid circles, red-fits) and Kinase-Glo (open circles).
Compounds that show a non-competitive behavior against reporter enzymes used in HTS, perhaps by exploring inhibitory sites outside the active site, will be more of a nuisance as the inhibition will not be completely relieved by increasing substrate concentrations. Our previous work identified the 3,5-diaryl-oxadiazoles as potent non-competitive inhibitors against lucPpy15 and indeed some of the most potent compounds identified here contained a 3,5-diaryl-oxadiazoles core (2a–l; Table 4). Of these, the most potent compounds showed IC50s ~ 50 nM at low substrate concentrations but showed reduced potencies near 10 μM in the formulated reagents (e.g. 2d, e). Although this inhibitor class also showed a large reduction of inhibitory compounds (~60% less) in the Ultra-Glo luciferase qHTS, we noted that the 3,5-diaryl-oxadiazoles series was the one compound series that still contained a significant number of compounds which demonstrated appreciable inhibition in formulations of Ultra-Glo luciferase such as Kinase-GloPlus and Kinase-GloMax (Table 4).
Table 4.
Characterization of selected 3,5-diaryl-oxadiazoles from the qHTS
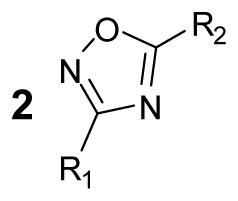
| |||||||
|---|---|---|---|---|---|---|---|
| Analogue # | R1 | R2 | IC50Ultr aGlo | IC50P. Pyralis | IC50KinGlo | IC50KinGlo Plus | IC50KinGlo Max |
| a | pyridin-2yl | pyridin-4yl | 1.9± 0.6 | 14.4± 6.9 | 8.9±1.9 | 14.1± 0.0 | 25.3±4.1 |
| b | pyridin-2yl | furan-2yl | 1.3± 0.3 | 17.1±7.1 | 13.9±0.6 | >50 | >50 |
| c | pyridin-2yl | biphenyl-4yl | 0.038± 0.006 | 0.08±0.07 | 11.3±1.7 | >50 | >50 |
| d | pyridin-2yl | 4-phenyl benzoate | 0.040± 0.006 | 1.4±1.2 | 10.0±3.4 | 13.4±2.4 | 13.1± 2.5 |
| e | pyridin-2yl | 2-methoxy phenyl | 0.08± 0.01 | 2.8±1.6 | 5±1 | 13.5±0.8 | 12.7±1.7 |
| f | phenyl | 2,4-dimethoxy phenyl | 0.054± 0.004 | 0.2±0.1 | 13.9±1.1 | >50 | >50 |
| g | 3-methyl phenyl | 4-flouro phenyl | 0.58± 0.1 | 1.7±0.5 | 14±7.7 | Inactive | Inactive |
| h | 4-methoxy phenyl | 2-flouro phenyl | 0.3 ± 0.05 | 2.8±1.6 | >50 | >50 | Inactive |
| i | 2-methoxy phenyl | phenyl | 0.6 ± 0.1 | 8.3±3.7 | >50 | Inactive | Inactive |
| j | 2-methoxy phenyl | pyridin-4yl | 4.8 ± 0.7 | 24± 9.8 | >50 | Inactive | Inactive |
| k | pyridin-4yl | furan-2yl | 2.4± 0.3 | 24± 10.7 | >50 | Inactive | Inactive |
| l | 4-dimethyaminophenyl | 2-methoxy phenyl | 0.32± 0.04 | 0.5± 0.3 | Inactive | Inactive | Inactive |
Activity of compounds was determined by measurement of luminescence using either purified luciferase enzyme assays (IC50UltraGlo or IC50lucPpy) or formulations of UltraGlo (IC50K inGlo , IC50KinGlo Plus , IC50KinGlo Max). Data shown are mean± SD for at least three replications.
DISCUSSION
We have determined a comprehensive inhibitor profile of ~199K compounds using an optimized formulation of Ultra-Glo luciferase and compared this to a previously determined inhibitor profile that used an analogous lucPpy-containing formulation.15 The Ultra-Glo luciferase formulation (Kinase-Glo) showed reductions in both inhibitor abundance and potency relative to lucPpy with only 0.1% of library showing IC50 <10 μM in the Ultra-Glo luciferase formulation compared to 0.9% with the lucPpy formulation. Although we noted similar specificity for compounds purely competitive with luciferin substrate, we found that one of the principle reasons for the lower number of inhibitors against Ultra-Glo luciferase was due to a loss of compounds with interactions stretching outside the luciferin pocket. These interactions allow for inhibition to persist even at high D-luciferin for lucPpy while the absence of these interactions renders these inhibitors inactive in Ultra-Glo luciferase formulations. Therefore, formulations such as Kinase-Glo should be superior ATP sensor reagents for HTS as these will have lower compound interference. Indeed a previous study that used Kinase-Glo for HTS of glycogen synthase kinase-3 noted that no luciferase inhibitors were identified during confirmation of the primary hits.28
Although Ultra-Glo luciferase formulations appear to be more optimal assay reagents for ATP detection in HTS we note that Ultra-Glo luciferase reagents intended for uses other than ATP detection, where luciferin concentrations may be present at lower concentrations, could contain additional inhibitors than described here. For example, given the potent binding for many inhibitors we found using low luciferin concentrations, certain reagents containing pro-luciferin substrates,3 will likely show increased amounts of luciferase inhibitors compared to the profile described here. The potent inhibition of firefly luciferases by luciferin competitive compounds in unformulated reagents should also caution against the temptation to dilute detection reagents further than supplier suggestions to save costs. Even though diluted detection reagents can show adequate signal:background, increased interference by luciferase inhibitors will be obtained.
The Ultra-Glo luciferase was derived from lucPpe and was optimized by directed evolution19,29,30 using a selection strategy that incorporated several steps and introduced as many as 34 mutations. This included screening for variants of increased thermostability, signal stability (“glow response”), substrate usage efficiency through evaluation of KM values and increased inhibitor resistance. Inhibitor resistance was determined by adding L-luciferin into the reaction mix and selecting for variants that were resistant to this inhibitor29 because studies have shown that L-luciferin can act as a competitive inhibitor of the bioluminescent reaction; the enantiomeric position of luciferin being the site of adenylate attachment.31,32 Some of the mutations introduced in this process were found to improve the KM for ATP (from 18 μM to approximately 3 μM, relative to wild-type lucPpe),29 consistent with changes in the adenylate pocket and may have improved the resistance to inhibitors.
Firefly luciferase is a globular protein composed of N- and C-terminal domains linked by a hinge region. These two domains are known to undergo a change upon substrate binding that brings the two domains together resulting in a more compact closed conformation.33,34 The final thermostable Ultra-Glo luciferase variant showed a half-life of more than 100 days at room temperature representing an improvement in half-life at 50 °C of approximately 5,000-fold over unoptimized lucPpe.29 Additionally, the increased thermostability of Ultra-Glo luciferase may have lead to increased conformational rigidity resulting in a relatively more compact closed conformation thus blocking many of the small molecule binding sites present in unoptimized lucPpy. Indeed comparison of protein structures between hyperthermophilic and mesophilic organisms shows increased hydrophobic packing and decreased flexibility in the hyperthermophilic proteins.35,36
Observing a difference in druggability between related enzymes is not without precedence37,38 and a similar mechanism involving conformational flexibility has been proposed to explain druggability differences in protein kinases. In the co-crystal of Raf protein kinase in complex with 4-(4-(3-(4-chloro-3-(trifluoromethyl)phenyl)ureido)phenoxy)-N-methylpicolinamide (Bay 43-9006)39 the compound is found to bind to a large open binding pocket present in the inactive state of the ATP pocket thus leading to inhibition through stabilization of the inactive conformation of the kinase.40 However, in the protein kinase Tie2 this binding site is closed because it is filled by the nucleotide binding loop which prevents small molecule inhibition.41 Therefore, conformational flexibility and relative plasticity have been proposed to explain why certain targets are associated with many inhibitor scaffolds while others have been resistant to efforts to develop inhibitors and may represent another reason for the improved resistance to inhibitors for Ultra-Glo luciferase.42,43
Methods aimed at understanding target druggability are of great interest as these can lead to better choices of targets geared for small molecule intervention. The term “druggability” has been defined as the ability to identify high affinity and selective small (e.g.~500 MW) drug-like compounds that show tractable SAR against a molecular target.38,44,45 Understanding target druggability has been approached through various methods in the past, including computational methods employing sequence alignment information or crystal structures.45,46 A recent study used an affinity model to predict druggability where an experimental HTS against 11K compounds was performed to confirm the results.46 In that study it was shown that a target predicted to have low druggability, and for which researchers at Pfizer were unable to identify suitable leads after considerable effort, showed a 90% reduction in hits compared to a target predicted to have high druggability. As well, the maximum achievable potency was predicted to be 10-fold higher for the druggable target. These metrics are in line with the experimental results obtained here as we also observed a 90% reduction in major inhibitor classes and a 10-fold reduction in the maximum observed potency when comparing the two luciferase qHTS experiments supporting that Ultra-Glo luciferase reagents are less “druggable”.
Current technologies allow for rapid determination of potency values across large chemical libraries in a manner in which robust SAR is experimentally measured for the entire library. Such an experiment employed early in the drug discovery process where both the maximum inhibitor potency and fraction of active compounds is directly determined could save unnecessary time and effort on intractable target classes. However, an alternative reason for the reduced inhibitor fraction found here for Ultra-Glo luciferase could be that the MLSMR, that contains largely small molecule drug-like compounds, does not contain the right structures for high affinity binding to Ultra-Glo luciferase. A recent study describing a screen of sphingosine 1-phosphate (S1P) receptors against the MLSMR suggested that chemical library biases may have played a role in the determining different hit rates between two S1P receptor subtypes.47 Further expansion of the qHTS approach to other target classes and different types of chemical libraries (e.g. natural products) will provide experimental testing that can be used to determine how the nature of the library affects the hit rate of the target class. The qHTS database already established at our center and available within PubChem21 could be mined to obtain such information for relevant target classes.
Given the wide use of enzyme-based reporters in the early phases of compound discovery efforts it would seem wise to critically examine the mechanisms of inhibition of these common reporter enzymes. This knowledge can be used to distinguish the SAR related to the targeted biology versus reporter specific effects that can result in misleading activity. For example, using our understanding of firefly luciferase inhibitor SAR, we have recently demonstrated that inhibition of firefly luciferase in cell-based reporter assays can lead to the counter-intuitive phenomena of apparent reporter gene activation due to inhibitor-based stabilization of the reporter enzyme within the cellular milieu.16 Assay interferences due to inhibition of reporter enzymes such as firefly luciferase offer the opportunity to understand the SAR in “medicinal chemistry” terms and this knowledge can be used to ensure proper interpretation of the results and use of this important bioluminescent assay detection method.
Supplementary Material
Acknowledgments
This research was supported by the Molecular Libraries Initiative of the NIH Roadmap for Medical Research and the Intramural Research Program of the National Human Genome Research Institute, National Institutes of Health. We thank Adam Yasgar, Paul Shinn for compound management support, Jeremy Smith for analytical chemistry support, and Carleen Klumpp, Sam Michael for assistance with the Kalypsys robotic system.
Abbreviations
- qHTS
quantitative high-throughput screening
- lucPpy
Photinus pyralis firefly luciferase
- lucPpe
Photuris pennsylvanica firefly luciferase
- SPA
scintillation proximity assay
- Ultra-Glo
optimized variant of lucPpe used in Promega’s Kinase-Glo formulations
- IMAP
immobilized metal-ion affinity partitioning
- MSR
minimum significance ratio
- CRC
concentration-response curve
- BEH
bridged ethyl hybrid
Footnotes
Supporting Information Available: General synthetic methods and procedures as well as characterization of the compounds are provided.
References
- 1.Cali JJ, Ma D, Sobol M, Simpson DJ, Frackman S, Good TD, Daily WJ, Liu D. Luminogenic cytochrome P450 assays. Expert Opin Drug Metab Toxicol. 2006;2:629–645. doi: 10.1517/17425255.2.4.629. [DOI] [PubMed] [Google Scholar]
- 2.Cali JJ, Niles A, Valley MP, O'Brien MA, Riss TL, Shultz J. Bioluminescent assays for ADMET. Expert Opin Drug Metab Toxicol. 2008;4:103–120. doi: 10.1517/17425255.4.1.103. [DOI] [PubMed] [Google Scholar]
- 3.Fan F, Wood KV. Bioluminescent assays for high-throughput screening. Assay Drug Dev Technol. 2007;5:127–136. doi: 10.1089/adt.2006.053. [DOI] [PubMed] [Google Scholar]
- 4.Comley J. Kinase screening and profiling-spoilt for choice. Drug Discov World. 2006;7:27–50. [Google Scholar]
- 5.Inglese J, Johnson RL, Simeonov A, Xia M, Zheng W, Austin CP, Auld DS. High-throughput screening assays for the identification of chemical probes. Nat Chem Biol. 2007;3:466–479. doi: 10.1038/nchembio.2007.17. [DOI] [PubMed] [Google Scholar]
- 6.Wu S, Liu B. Application of scintillation proximity assay in drug discovery. BioDrugs. 2005;19:383–392. doi: 10.2165/00063030-200519060-00005. [DOI] [PubMed] [Google Scholar]
- 7.Sportsman JR, Gaudet EA, Boge A. Immobilized metal ion affinity-based fluorescence polarization (IMAP): advances in kinase screening. Assay Drug Dev Technol. 2004;2:205–214. doi: 10.1089/154065804323056549. [DOI] [PubMed] [Google Scholar]
- 8.Lowery RG, Kleman-Leyer K. Transcreener: screening enzymes involved in covalent regulation. Expert Opin Ther Targets. 2006;10:179–190. doi: 10.1517/14728222.10.1.179. [DOI] [PubMed] [Google Scholar]
- 9.Huss KL, Blonigen PE, Campbell RM. Development of a Transcreener™ Kinase Assay for Protein Kinase A and Demonstration of Concordance of Data with a Filter-Binding Assay Format. J Biomol Screen. 2007;12:578–584. doi: 10.1177/1087057107300221. [DOI] [PubMed] [Google Scholar]
- 10.Klink TA, Kleman-Leyer KM, Kopp A, Westermeyer TA, Lowery RG. Evaluating PI3 kinase isoforms using Transcreener ADP assays. J Biomol Screen. 2008;13:476–485. doi: 10.1177/1087057108319864. [DOI] [PMC free article] [PubMed] [Google Scholar]
- 11.Schroter T, Minond D, Weiser A, Dao C, Habel J, Spicer T, Chase P, Baillargeon P, Scampavia L, Schurer S, Chung C, Mader C, Southern M, Tsinoremas N, LoGrasso P, Hodder P. Comparison of miniaturized time-resolved fluorescence resonance energy transfer and enzyme-coupled luciferase high-throughput screening assays to discover inhibitors of Rho-kinase II (ROCK-II) J Biomol Screen. 2008;13:17–28. doi: 10.1177/1087057107310806. [DOI] [PubMed] [Google Scholar]
- 12.Singh P, Harden BJ, Lillywhite BJ, Broad PM. Identification of kinase inhibitors by an ATP depletion method. Assay Drug Dev Technol. 2004;2:161–169. doi: 10.1089/154065804323056503. [DOI] [PubMed] [Google Scholar]
- 13.Koresawa M, Okabe T. High-throughput screening with quantitation of ATP consumption: a universal non-radioisotope, homogeneous assay for protein kinase. Assay Drug Dev Technol. 2004;2:153–160. doi: 10.1089/154065804323056495. [DOI] [PubMed] [Google Scholar]
- 14.Manning G, Whyte DB, Martinez R, Hunter T, Sudarsanam S. The protein kinase complement of the human genome. Science. 2002;298:1912–1934. doi: 10.1126/science.1075762. [DOI] [PubMed] [Google Scholar]
- 15.Auld DS, Southall NT, Jadhav A, Johnson RL, Diller DJ, Simeonov A, Austin CP, Inglese J. Characterization of chemical libraries for luciferase inhibitory activity. J Med Chem. 2008;51:2372–2386. doi: 10.1021/jm701302v. [DOI] [PubMed] [Google Scholar]
- 16.Auld DS, Thorne N, Nguyen DT, Inglese J. A specific mechanism for nonspecific activation in reporter-gene assays. ACS Chem Biol. 2008;3:463–470. doi: 10.1021/cb8000793. [DOI] [PMC free article] [PubMed] [Google Scholar]
- 17.Heitman LH, van Veldhoven JP, Zweemer AM, Ye K, Brussee J, AP IJ. False positives in a reporter gene assay: identification and synthesis of substituted N-pyridin-2-ylbenzamides as competitive inhibitors of firefly luciferase. J Med Chem. 2008;51:4724–4729. doi: 10.1021/jm8004509. [DOI] [PubMed] [Google Scholar]
- 18.Ye L, Buck LM, Schaeffer HJ, Leach FR. Cloning and sequencing of a cDNA for firefly luciferase from Photuris pennsylvanica. Biochim Biophys Acta. 1997;1339:39–52. doi: 10.1016/s0167-4838(96)00211-7. [DOI] [PubMed] [Google Scholar]
- 19.Hall MP, Gruber MG, Hannah RR, Jennens-Clough ML, Wood KV. Stabilization of firefly luciferase using directed evolution. John Wiley & Sons; New York: 1998. [Google Scholar]
- 20.Varney MA, Cosford ND, Jachec C, Rao SP, Sacaan A, Lin FF, Bleicher L, Santori EM, Flor PJ, Allgeier H, Gasparini F, Kuhn R, Hess SD, Velicelebi G, Johnson EC. SIB-1757 and SIB-1893: selective, noncompetitive antagonists of metabotropic glutamate receptor type 5. J Pharmacol Exp Ther. 1999;290:170–181. [PubMed] [Google Scholar]
- 21.http://pubchem.ncbi.nlm.nih.gov/
- 22.Inglese J, Auld DS, Jadhav A, Johnson RL, Simeonov A, Yasgar A, Zheng W, Austin CP. Quantitative high-throughput screening: A titration-based approach that efficiently identifies biological activities in large chemical libraries. Proc Natl Acad Sci U S A. 2006;103:11473–11478. doi: 10.1073/pnas.0604348103. [DOI] [PMC free article] [PubMed] [Google Scholar]
- 23.Yasgar A, Shinn P, Jadhav A, Auld DS, Michael S, Zheng W, Austin CP, Inglese J, Simeonov A. Compound Management for Quantitative High- Throughput Screening. J Assoc Lab Automation. 2008;13:79–89. doi: 10.1016/j.jala.2007.12.004. [DOI] [PMC free article] [PubMed] [Google Scholar]
- 24.Cleveland PH, Koutz PJ. Nanoliter dispensing for uHTS using pin tools. Assay Drug Dev Technol. 2005;3:213–225. doi: 10.1089/adt.2005.3.213. [DOI] [PubMed] [Google Scholar]
- 25.Michael S, Auld DS, Klumpp C, Jadhav A, Zheng W, Thorne N, Austin CP, Inglese J, Simeonov A. A robotic platform for quantitative high-throughput screening. Assay & Drug Development Technologies. 2008;6:637–658. doi: 10.1089/adt.2008.150. [DOI] [PMC free article] [PubMed] [Google Scholar]
- 26.http://www.ncgc.nih.gov/resources/software.html
- 27.Eastwood BJ, Farmen MW, Iversen PW, Craft TJ, Smallwood JK, Garbison KE, Delapp NW, Smith GF. The minimum significant ratio: a statistical parameter to characterize the reproducibility of potency estimates from concentration-response assays and estimation by replicate-experiment studies. J Biomol Screen. 2006;11:253–261. doi: 10.1177/1087057105285611. [DOI] [PubMed] [Google Scholar]
- 28.Baki A, Bielik A, Molnar L, Szendrei G, Keseru GM. A high throughput luminescent assay for glycogen synthase kinase-3β, inhibitors. Assay Drug Dev Technol. 2007;5:75–83. doi: 10.1089/adt.2006.029. [DOI] [PubMed] [Google Scholar]
- 29.Wood KV, Hall MP, Gruber MG. WO 01/20002 A1. Thermostable luciferases from Photuris pennsylvanica and Pyrophorus plagiopthalamus and methods of production. 2001
- 30.Zhang JH, Dawes G, Stemmer WP. Directed evolution of a fucosidase from a galactosidase by DNA shuffling and screening. Proc Natl Acad Sci U S A. 1997;94:4504–4509. doi: 10.1073/pnas.94.9.4504. [DOI] [PMC free article] [PubMed] [Google Scholar]
- 31.Lembert N. Firefly luciferase can use L-luciferin to produce light. Biochem J. 1996;317(Pt 1):273–277. doi: 10.1042/bj3170273. [DOI] [PMC free article] [PubMed] [Google Scholar]
- 32.Nakamura M, Maki S, Amano Y, Ohkita Y, Niwa K, Hirano T, Ohmiya Y, Niwa H. Firefly luciferase exhibits bimodal action depending on the luciferin chirality. Biochem Biophys Res Commun. 2005;331:471–475. doi: 10.1016/j.bbrc.2005.03.202. [DOI] [PubMed] [Google Scholar]
- 33.Wang WQ, Xu Q, Shan YF, Xu GJ. Probing local conformational changes during equilibrium unfolding of firefly luciferase: fluorescence and circular dichroism studies of single tryptophan mutants. Biochem Biophys Res Commun. 2001;282:28–33. doi: 10.1006/bbrc.2001.4539. [DOI] [PubMed] [Google Scholar]
- 34.Rosendahl MS, Leonard NJ, DeLuca M. Dimensional probing of the ATP binding site on firefly luciferase. Photochem Photobiol. 1985;35:857–861. doi: 10.1111/j.1751-1097.1982.tb02659.x. [DOI] [PubMed] [Google Scholar]
- 35.Paiardini A, Sali R, Bossa F, Pascarella S. “Hot cores” in proteins: comparative analysis of the apolar contact area in structures from hyper/thermophilic and mesophilic organisms. BMC Struct Biol. 2008;8:14. doi: 10.1186/1472-6807-8-14. [DOI] [PMC free article] [PubMed] [Google Scholar]
- 36.Zavodszky P, Kardos J, Svingor, Petsko GA. Adjustment of conformational flexibility is a key event in the thermal adaptation of proteins. Proc Natl Acad Sci U S A. 1998;95:7406–7411. doi: 10.1073/pnas.95.13.7406. [DOI] [PMC free article] [PubMed] [Google Scholar]
- 37.Schafer M, Egner U. Structural Aspects of Drugability and Selectivity of Protein Kinases in Inflammation. Anti-Inflamm Anti-Allergy Agents Med Chem. 2007;6:5–17. [Google Scholar]
- 38.Schneider M. A rational approach to maximize success rate in target discovery. Arch Pharm (Weinheim) 2004;337:625–633. doi: 10.1002/ardp.200400913. [DOI] [PubMed] [Google Scholar]
- 39.Lowinger TB, Riedl B, Dumas J, Smith RA. Design and discovery of small molecules targeting raf-1 kinase. Curr Pharm Des. 2002;8:2269–2278. doi: 10.2174/1381612023393125. [DOI] [PubMed] [Google Scholar]
- 40.Wan PT, Garnett MJ, Roe SM, Lee S, Niculescu-Duvaz D, Good VM, Jones CM, Marshall CJ, Springer CJ, Barford D, Marais R. Mechanism of activation of the RAF-ERK signaling pathway by oncogenic mutations of B-RAF. Cell. 2004;116:855–867. doi: 10.1016/s0092-8674(04)00215-6. [DOI] [PubMed] [Google Scholar]
- 41.Shewchuk LM, Hassell AM, Ellis B, Holmes WD, Davis R, Horne EL, Kadwell SH, McKee DD, Moore JT. Structure of the Tie2 RTK domain: self-inhibition by the nucleotide binding loop, activation loop, and C-terminal tail. Structure. 2000;8:1105–1113. doi: 10.1016/s0969-2126(00)00516-5. [DOI] [PubMed] [Google Scholar]
- 42.Fabbro D. An interview with Doriano Fabbro, Ph.D., Novartis Biomedical Research Institute. Interviewed by Vicki Glaser. Assay Drug Dev Technol. 2004;2:109–114. doi: 10.1089/154065804323056440. [DOI] [PubMed] [Google Scholar]
- 43.Egner U, Hillig RC. A structural biology view of target drugability. Exp Opin Drug Discov. 2008;3:391–401. doi: 10.1517/17460441.3.4.391. [DOI] [PubMed] [Google Scholar]
- 44.Hajduk PJ, Greer J. A decade of fragment-based drug design: strategic advances and lessons learned. Nat Rev Drug Discov. 2007;6:211–219. doi: 10.1038/nrd2220. [DOI] [PubMed] [Google Scholar]
- 45.Cheng AC, Coleman RG, Smyth KT, Cao Q, Soulard P, Caffrey DR, Salzberg AC, Huang ES. Structure-based maximal affinity model predicts small- molecule druggability. Nat Biotechnol. 2007;25:71–75. doi: 10.1038/nbt1273. [DOI] [PubMed] [Google Scholar]
- 46.Hopkins AL, Groom CR. The druggable genome. Nat Rev Drug Discov. 2002;1:727–730. doi: 10.1038/nrd892. [DOI] [PubMed] [Google Scholar]
- 47.Schurer SC, Brown SJ, Gonzalez-Cabrera PJ, Schaeffer MT, Chapman J, Jo E, Chase P, Spicer T, Hodder P, Rosen H. Ligand-binding pocket shape differences between sphingosine 1-phosphate (S1P) receptors S1P1 and S1P3 determine efficiency of chemical probe identification by ultrahigh-throughput screening. ACS Chem Biol. 2008;3:486–498. doi: 10.1021/cb800051m. [DOI] [PMC free article] [PubMed] [Google Scholar]
Associated Data
This section collects any data citations, data availability statements, or supplementary materials included in this article.