Abstract
In sclerophylls, photosynthesis is particularly strongly limited by mesophyll diffusion resistance from substomatal cavities to chloroplasts (r m), but the controls on diffusion limits by integral leaf variables such as leaf thickness, density, and dry mass per unit area and by the individual steps along the diffusion pathway are imperfectly understood. To gain insight into the determinants of r m in leaves with varying structure, the full CO2 physical diffusion pathway was analysed in 32 Australian species sampled from sites contrasting in soil nutrients and rainfall, and having leaf structures from mesophytic to strongly sclerophyllous. r m was estimated based on combined measurements of gas exchange and chlorophyll fluorescence. In addition, r m was modelled on the basis of detailed anatomical measurements to separate the importance of different serial resistances affecting CO2 diffusion into chloroplasts. The strongest sources of variation in r m were S c/S, the exposed surface area of chloroplasts per unit leaf area, and mesophyll cell wall thickness, t cw. The strong correlation of r m with t cw could not be explained by cell wall thickness alone, and most likely arose from a further effect of cell wall porosity. The CO2 drawdown from intercellular spaces to chloroplasts was positively correlated with t cw, suggesting enhanced diffusional limitations in leaves with thicker cell walls. Leaf thickness and density were poorly correlated with S c/S, indicating that widely varying combinations of leaf anatomical traits occur at given values of leaf integrated traits, and suggesting that detailed anatomical studies are needed to predict r m for any given species.
Key words: Anatomical model, cell wall thickness, diffusion limitations of photosynthesis, interspecific variability, leaf economics spectrum, mesophyll diffusion
Introduction
Leaf photosynthesis is determined by biochemical limitations (photosynthetic capacity) and diffusion limitations, including stomatal resistance and CO2 diffusion resistance from sub-stomatal cavities to the carboxylating enzyme, Rubisco, in the chloroplasts (so-called ‘mesophyll diffusion resistance’) (Flexas et al., 2008, 2012; Terashima et al., 2006, 2011). The concept of mesophyll resistance (r m, see Table 1 for symbol definitions) can be described as follows. After entering the leaf through the stomata, CO2 faces a relatively long and tortuous pathway through gas and liquid phases before it finally reaches the carboxylating enzyme Rubisco. First, CO2 must diffuse through the intercellular airspaces to a mesophyll cell surfaces adjacent to the airspace to enable free access for the CO2. Gas diffusion in the liquid phase is slow, therefore CO2 is most likely to enter the cell where the chloroplast directly abuts the cell wall (Terashima et al., 2006, 2011). This process could be greatly enhanced if the cell walls were fully lined with chloroplasts, a condition that in practice is rare (Terashima et al., 2006). CO2 dissolves in the water-filled pores of the cell wall (Evans et al., 2009) and diffuses across the cell wall. Diffusion across cell walls is slow if the walls are lignified and porosity is low, and/or if the walls are thick. Diffusion through the cytoplasmic layer between the cell wall and the chloroplast is fast if chloroplasts are closely appressed to the cell walls. Chloroplasts are relatively thick organelles, and diffusion through the chloroplast could potentially be one of the most limiting steps in CO2 physical diffusion, unless most Rubisco were located close to the chloroplast inner envelope membrane (Tosens et al., 2012) or carbonic anhydrase operated close to Rubisco to enhance the apparent diffusion gradient (Terashima et al., 2011).
Table 1.
Symbols and units used
| Variable | Definition | Unit |
|---|---|---|
| A | Net assimilation rate | µmol m–2 s–1 |
| C c | CO2 concentration in chloroplasts | µmol mol–1 |
| C i | CO2 concentration in intercellular airspace | µmol mol–1 |
| C i–C c | CO2 drawdown from intercellular airspace to chloroplasts | µmol mol–1 |
| D a | Diffusion coefficient for CO2 in the gas phase | m2 s–1 |
| d leaf | Leaf density | g cm–3 |
| D w | Aqueous phase diffusion coefficient for CO2 | m2 s–1 |
| f ias | Fraction of mesophyll occupied by intercellular airspace | Dimensionless |
| f pal | Fraction of mesophyll cell volume comprised of palisade tissue | Dimensionless |
| H/(RT k) | Henry′s law constant | Dimensionless |
| ∆L ias | Effective diffusion path length in the gas-phase | m |
| L mes | Total length of chloroplasts facing the intercellular airspace | m |
| L mes | Total length of mesophyll cells facing the intercellular airspace | m |
| p i | Effective porosity in the given part of the diffusion pathway | Dimensionless |
| Q | Incident quantum flux density | µmol m–2 s–1 |
| R | Gas constant | Pa m3 K–1 mol–1 |
|
|
Mesophyll resistance of exposed chloroplast surface area per unit of leaf area | m2chlor s mol–1 |
| r cellular | Cellular resistance, sum of r cw, r pl, r cyt, r env, and r str | s m–1 |
| R d | Dark respiration rate | µmol m–2 s–1 |
| r cw | Cell wall resistance | s m–1 |
| r pl | Plasma membrane resistance | s m–1 |
| r cyt | Cytoplasm resistance | s m–1 |
| r env | Chloroplast envelope resistance | s m–1 |
| r str | Stroma resistance | s m–1 |
| r gas | Gas phase resistance | s m–1 |
| r liq | Liquid phase resistance | s m–1 |
| r m | Mesophyll diffusion resistance | m2 s mol–1 |
| S c/S | Chloroplast surface area exposed to intercellular airspace | |
| per unit of leaf area | m2 m–2 | |
| s mes | Cross-sectional surface area of mesophyll cells in micrograph | m2 |
| s pal | Cross-sectional area of palisade mesophyll cells in micrograph | m2 |
| s s | Cross-sectional area of mesophyll cells in micrograph | m2 |
| S c,pal/S | S c/S for palisade mesophyll | % |
| S c,spon/S | S c/S for spongy mesophyll | % |
| S c/S mes | Ratio of exposed chloroplast to mesophyll surface areas | Dimensionless |
| S mes/S | Surface area of mesophyll cells exposed to airspace per unit of leaf area | m2 m–2 |
| t chlor | Chloroplast thickness | µm |
| t cw | Cell wall thickness | µm |
| T k | Absolute temperature | K |
| t leaf | Leaf thickness | mm |
| t mes | Mesophyll thickness | mm |
| W | Width of the section measured | m |
| γ | Curvature correction factor | Dimensionless |
| γf,i | Proportional reduction of diffusion conductance in the cytosol and in the stroma compared with free diffusion in water | Dimensionless |
|
|
Diffusion path tortuosity | m m–1 |

|
Hypothetical CO2 compensation point without R d | µmol mol–1 |
| ΦPSII | Effective quantum yield of PSII | Dimensionless |
| ξ | Leaf absorptance | Dimensionless |
| ε | Fraction of electrons absorbed by PSII | Dimensionless |
All of these anatomical features pose partial resistances for CO2 diffusion and contribute to the total mesophyll resistance. Slower CO2 diffusion through the mesophyll causes larger CO2 concentration gradients between the stroma and intercellular airspaces, C i–C c (Niinemets and Sack, 2006; Warren, 2008; Niinemets et al., 2009c). Ignoring the fact that CO2 concentration in chloroplasts (C c) is often lower than the CO2 concentration in substomatal cavities (C i) leads to the underestimation of Rubisco-related photosynthetic parameters (Flexas et al., 2006a., 2007; Niinemets et al., 2009a) and biased respiration rate calculations (Ayub et al., 2011). Although this is now quite widely recognized, r m is still generally ignored in large-scale carbon gain models due to our lack of knowledge about why it varies among species, and how best to model it (Warren, 2008; Niinemets et al., 2009c).
The gas-phase pathway is longer than the liquid-phase pathway but gas diffusion in the liquid phase is approximately 10 000-fold slower (Evans et al., 1994; Terashima et al., 2006). Gas-phase resistance is thought to be negligible in thin and porous mesophytic leaves (Terashima et al., 2006; Flexas et al., 2008). Further, it has been demonstrated that gas-phase resistance is lower than liquid-phase resistance in thick, densely-packed, hypostomatous sclerophyll leaves (Syvertsen et al., 1995; Piel et al., 2002). Therefore, it is largely agreed that the main limitations to CO2 diffusion are in the liquid phase (Flexas et al., 2009; Terashima et al., 2006, 2011).
Only a limited number of studies have analysed r m together with its direct structural correlates. In some studies (Loreto et al., 1992; Evans et al., 1994; Tosens et al., 2012), a strong negative relationship has been reported between r m and the area of exposed chloroplast surface per unit of leaf surface area, S c/S. However, in others, no relationship has been found between S c/S and r m (Kogami et al., 2001; Gorton et al., 2003). On the other hand, a strong positive relationship between cell wall thickness and r m was reported by Hassiotou et al. (2010). Overall, the information about the aqueous-phase structural determinants of r m is conflicting and largely missing (Flexas et al., 2008; Warren, 2008; Evans et al., 2009).
CO2 diffusion across the mesophyll is particularly slow in structurally robust leaves, (Niinemets and Sack, 2006; Flexas et al., 2008; Niinemets et al., 2009c, 2011). Because of stronger mesophyll diffusion limitations, evergreen sclerophylls are less sensitive to variations in stomatal openness (Niinemets et al., 2011); therefore, r m is an important factor affecting photosynthetic performance in those species (Warren and Adams, 2006; Niinemets and Sack, 2006). Strong positive correlations between CO2 drawdown from substomatal cavities to chloroplasts (a measure of CO2 diffusion limitation of photosynthesis) and leaf dry mass per unit area (LMA; a measure of leaf robustness) have been observed across the species worldwide (Niinemets et al., 2009c), including Australian sclerophylls (Niinemets et al., 2009b). In the current study, 32 Australian sclerophyll species were examined for anatomical restrictions to CO2 diffusion. The central aim was to identify and quantify the main sources of variation in r m in these species. The data were fitted to the diffusion model of Niinemets and Reichstein (2003a) to unravel the importance of various components of the CO2 diffusion pathway from substomatal cavities to Rubisco in the chloroplasts. In addition, the influence of anatomical traits on r m was quantified and C i–C c calculated from gas exchange measurements. Finally, we turn to the question of what features of leaves are conducive to high chloroplast exposed areas per unit surface area, this being one of the two leading dimensions determining total mesophyll resistance. All acronyms used are defined in Table 1.
Materials and methods
Study sites and species
The field measurements were conducted in April 2006 as described in detail by Niinemets et al. (2009b). In brief, plant material for gas-exchange measurements and foliage chemical and structural analyses was sampled from healthy individuals of 32 Australian evergreen tree and shrub species. Sampling was primarily spread across four sites (HRHN, high rain, high nutrients; HRLN, high rain, low nutrients; LRHN, low rain, high nutrients; LRLN, low rain, low nutrients) selected in native forests and shrublands near Sydney, Australia (see Table 2 for species sampled at each site). The open- or closed-forest vegetation supported at each site is characterized by broad-leaved canopy trees (e.g. Eucalyptus spp., Corymbia spp., Syncarpia glomulifera), with a mix of broad-leaved, needle-leaved, and microphyllous species in the understorey. To get a broader range of leaf structures and photosynthetic capacities, additional samples for five species were taken from Macquarie University campus (MQ; Table 2). In all cases, mature individuals were used. All species, except Acacia spp., possessed true mature leaves. Acacia spp. possessed foliage phyllodes that are analogues of broad leaves. It is noted that important structural changes occur in leaves upon transition from the juvenile to the mature leaf form and upon replacement of juvenile foliage by phyllodes in Acacia species (Ullmann, 1989; Groom et al., 1997). Ontogenetic modifications in leaf form are also associated with alterations in leaf anatomy and mesophyll diffusion conductance (Mullin et al., 2009; Steppe et al., 2011). Such modifications constitute a potentially highly important source of species differentiation among different habitats during ontogeny, but such modifications were not studied here. Further details about sites, species, and sampling procedures can be found in Niinemets et al. (2009b).
Table 2.
Average thickness of key anatomical traits determining cellular resistance for the 32 study species from five sites
| Species | Sitea | Component thickness (µm) | ||
|---|---|---|---|---|
| Chloroplasts | Cell walls | Cytosol | ||
| Acacia longifolia | MQ | 1.50 | 0.300 | 0.138 |
| Acacia myrtifolia | HRLN | 1.50 | 0.262 | 0.103 |
| Acacia suaveolens | HRLN | 1.65 | 0.367 | 0.162 |
| Angophora hispida | HRLN | 1.46 | 0.378 | 0.152 |
| Astrotrichia floccosa | HRHN | 1.71 | 0.330 | 0.132 |
| Banksia aemula | LRLN | 1.29 | 0.350 | 0.143 |
| Banksia integrifolia | MQ | 1.88 | 0.300 | 0.140 |
| Banksia marginata | HRLN | 1.30 | 0.388 | 0.111 |
| Banksia oblongifolia | HRLN | 1.36 | 0.380 | 0.141 |
| Banksia robur | MQ | 1.80 | 0.283 | 0.141 |
| Banksia serrata | MQ | 1.60 | 0.388 | 0.140 |
| Banksia serrata | HRLN | 1.57 | 0.380 | 0.142 |
| Banksia spinulosa | LRHN | 1.41 | 0.380 | 0.142 |
| Eriostemon australasius | HRLN | 1.59 | 0.321 | 0.142 |
| Eucalyptus fibrosa | LRHN | 1.28 | 0.374 | 0.143 |
| Eucalyptus haemastoma | LRHN | 1.67 | 0.367 | 0.090 |
| Eucalyptus sclerophylla | LRLN | 1.28 | 0.420 | 0.129 |
| Eucalyptus umbra | HRHN | 1.43 | 0.410 | 0.130 |
| Grevillea speciosa | HRLN | 1.74 | 0.335 | 0.142 |
| Hakea dactyloides | HRLN | 1.32 | 0.408 | 0.140 |
| Lambertia formosa | HRHN | 1.73 | 0.300 | 0.140 |
| Lambertia formosa | HRLN | 1.58 | 0.395 | 0.150 |
| Macadamia ternifolia | MQ | 1.34 | 0.342 | 0.141 |
| Macrozamia communis | HRHN | 1.88 | 0.263 | 0.150 |
| Macrozamia spiralis | LRHN | 1.44 | 0.373 | 0.140 |
| Notolea longifolia | HRHN | 1.37 | 0.365 | 0.130 |
| Persoonia lanceolata | HRLN | 1.59 | 0.325 | 0.142 |
| Persoonia laurina | LRLN | 1.61 | 0.310 | 0.141 |
| Persoonia laurina | LRHN | 1.44 | 0.331 | 0.143 |
| Persoonia levis | HRLN | 1.66 | 0.300 | 0.142 |
| Pittosporum undulatum | MQ | 1.83 | 0.281 | 0.145 |
| Polyscias sambucifolia | MQ | 1.80 | 0.252 | 0.150 |
| Syncarpia glomulifera | HRHN | 1.87 | 0.290 | 0.140 |
| Synoum glandulosum | HRHN | 1.57 | 0.278 | 0.135 |
| Xylomelum pyriforme | HRHN | 1.56 | 0.340 | 0.139 |
a HRHN, higher rain, high nutrients; MQ, Macquarie University campus (also higher rain); HRLN, higher rain, low nutrients; LRHN, lower rain, high nutrients; LRLN, lower rain, low nutrients. High rainfall sites experience c. 1220mm annual rainfall, low rainfall sites c. 800mm (climate data from the Australian Bureau of Meteorology; further site details given by Niinemets et al., 2009b).
Measurement protocols and determination ofdiffusion limits of photosynthesis
The detailed measurement protocol is reported in Niinemets et al. (2009b). In brief, terminal branches were cut under water in the field in morning hours during high air humidity, transported to the laboratory and stabilized under dim light of 50–100 µmol m–2 s–1 and at 22 °C for 1–2 d to ensure the full hydration of branches and stable stomatal conductance during gas exchange measurements. Preliminary experiments demonstrated that while the stomatal conductance was relatively high immediately after branch sampling, the stomatal conductance rapidly declined during photosynthesis measurements conducted right after branch sampling. By contrast, stomatal conductances were high and stable in preconditioned branches (Niinemets et al., 2005, 2009b).
CO2 response curves of net assimilation and steady-state fluorescence were measured with a Li-6400 gas-exchange system equipped with a Li-6400-40 Leaf Chamber Fluorometer (Li-Cor, Inc., Lincoln, Nebraska, USA) at a leaf temperature of 25 °C and incident quantum flux density of 1000 µmol m–2 s–1. All gas-exchange rates were corrected for water vapour and CO2 diffusion according to Rodeghiero et al. (2007). Gas-exchange rates and chlorophyll fluorescence measurements were used to determine the mesophyll diffusion resistance (r m; see Table 1 for the units and abbreviations used in this study) from substomatal cavities to chloroplasts according to the variable electron transport rate method of Harley et al. (1992):
 |
(1) |
where A is the net assimilation rate, C i is the CO2 concentration in substomatal cavities, R d is the rate of non-photorespiratory respiration, Γ* is the hypothetical CO2 compensation point without R d (42.9 µmol mol–1 at 25 °C) derived in vivo by Bernacchi et al. (2001). Q is the incident quantum flux density, ΦPSII is the effective quantum yield of PSII, ξŀ is the leaf absorptance determined separately by an integrated sphere (Niinemets et al., 2009b), and ε is the fraction of electrons absorbed by PSII (taken as 0.5). The values of r m were calculated for measurements of net assimilation rate over the C i range of 150–350 µmol mol–1, and the average value of r m was determined for each leaf. Over this range, r m estimations are almost independent of C i (Flexas et al., 2007).
Light and electron microscopy
Small leaf discs around 5.8mm in diameter were removed from the leaves used for gas exchange measurements. Care was taken to avoid big leaf vessels. The leaf sections were infiltrated in a syringe with the fixative 2% glutaric aldehyde in 0.1M cacodylate buffer (pH=7.4), and post-fixed in 2% buffered osmium tetroxide at 22 °C for 2h. The samples were further dehydrated for 0.5h at 22 °C in an ethanol series and embedded in a LR White resin for an hour at 22 °C. Leaf sections of 1 µm for light microscopy, and ultrathin sections of 70nm for transmission electron microscopy (TEM) were made with Reichert–Jung ultra-cut ultra microtome (Leica, Vienna, Austria). The light microscope sections were stained with Toluidine blue and viewed in brightfield at magnifications of ×10 and ×40 by an Olympus BX 50 compound microscope, and photographed with a Scion CFW-1310 colour digital camera. The ultrathin sections were stained with lead citrate and viewed at magnifications of ×1800–×14000 by a Philips CM10 TEM microscope (Philips, Eindhoven, The Netherlands), and photographed with an Olympus-SIS Megaview digital camera.
Mesophyll surface area exposed to intercellular airspace per unit leaf area, S mes/S, and S c/S (chloroplast area facing the outer surface of exposed mesophyll cell walls per unit leaf area) were calculated from light and TEM micrographs (magnification ×4200) following the method of Syvertsen et al. (1995). Thus, S mes/S, is given as:
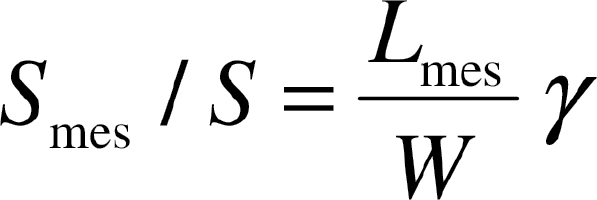 ,
,
|
(2) |
where W is the width of the section measured, L mes is the total length of mesophyll cells facing the intercellular airspace, and γ is the curvature correction factor that depends on the shape of the cells (Evans et al., 1994) and was obtained as a weighted average for palisade and spongy mesophyll. Analogously, S c/S, was calculated as:
 ,
,
|
(3) |
where L c is the total length of chloroplast surface area facing the intercellular airspace in the section.
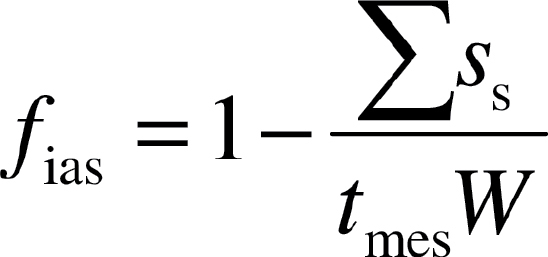
The fraction of intercellular airspace (f ias) was determined as:
 |
(4) |
where t mes is the mesophyll thickness between the two epidermal layers and Σs s is the sum of the cross-sectional areas of mesophyll cells.
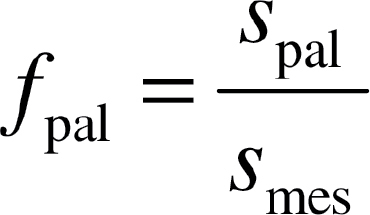
The fraction of mesophyll cell volume comprised of palisade tissue (f pal) was determined as:
 |
(5) |
where s pal is the cross-sectional area of cell surfaces that is palisade and s mes is the cross sectional surface area of mesophyll cells.
Cell wall thickness (t cw), cytoplasm thickness (t cyt), and chloroplast thickness (t chlor) were directly measured from TEM micrographs at a magnification of ×14 000. For a given section, all characteristics were determined at least in three different fields of view, and at least three different sections were analysed.
A model for calculation of internal mesophyll diffusion resistance
Values of S
c/S were used to calculate the mesophyll diffusion resistance of exposed chloroplast surface area  (r
m
S
c/S) as is common in studies of mesophyll diffusion limitations of photosynthesis (Evans et al., 2009; Terashima et al., 2006, 2011).
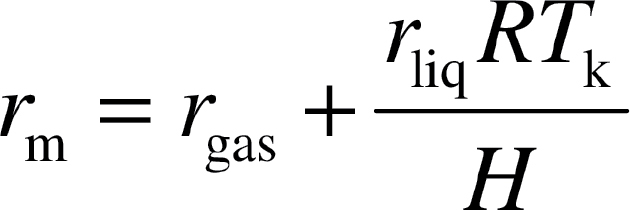
  is an appropriate variable in the correlative relationships with individual components of the diffusion pathway. A quantitative one-dimensional within-leaf gas diffusion model was applied to gain an insight into the partial determinants of mesophyll diffusion resistance from substomatal cavities to chloroplasts (for the full details of the model see Niinemets and Reichstein, 2003a; Tosens et al., 2012). In the model, the total mesophyll resistance (gas-phase equivalent), r
m, is separated between gas-phase resistance from substomatal cavities to the outer surface of cell walls (r
gas) and gas-phase equivalent liquid-phase resistance from the outer surface of cell walls to the chloroplasts (r
liq) (Evans et al., 1994; Niinemets and Reichstein, 2003a, b):
 |
(6) |
where H is the Henry’s law constant (Pa m3 mol–1), R is the gas constant (Pa m3 K–1 mol–1) and T k is the absolute temperature (K). H/(RT k) is the dimensionless form of Henry’s law constant (gas/liquid phase partition coefficient) that is needed to convert, r liq, a resistance in the liquid phase to gas-phase equivalent resistance. At 25 °C used in our study for gas-exchange measurements, H/(RT k) for CO2 is 1.2 (Dodds et al., 1956; Umbreit et al., 1972).
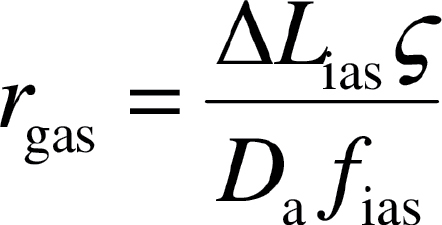
Gas-phase diffusion depends on the fraction of mesophyll volume occupied by intercellular airspace (f ias, m3 m–3) and the effective diffusion path length in the gas-phase (ΔL ias) (Syvertsen et al., 1995) as:
 |
(7) |
where  is the diffusion path tortuosity (m m–1) and D
a (m2 s–1) is the diffusion coefficient for CO2 in the gas-phase (1.51×10⁻⁵ m2 s–1 at 25 °C). ΔL
ias was approximated by half of the mesophyll thickness (Niinemets and Reichstein, 2003a). An estimate of
  can be obtained from paradermal and transverse leaf sections (Terashima et al., 1995), but its estimation is laborious and relatively imprecise due to varying geometry of leaf cells, making it difficult to discern the sites where air passages are blocked. In addition,
  may also vary with environmental conditions. A fixed value of
  of 1.57 m m–1 was used, as previously employed by Syvertsen et al. (1995) and Niinemets and Reichstein (2003a).
A total liquid phase resistance is given as the sum of the serial resistances:
 |
(8) |
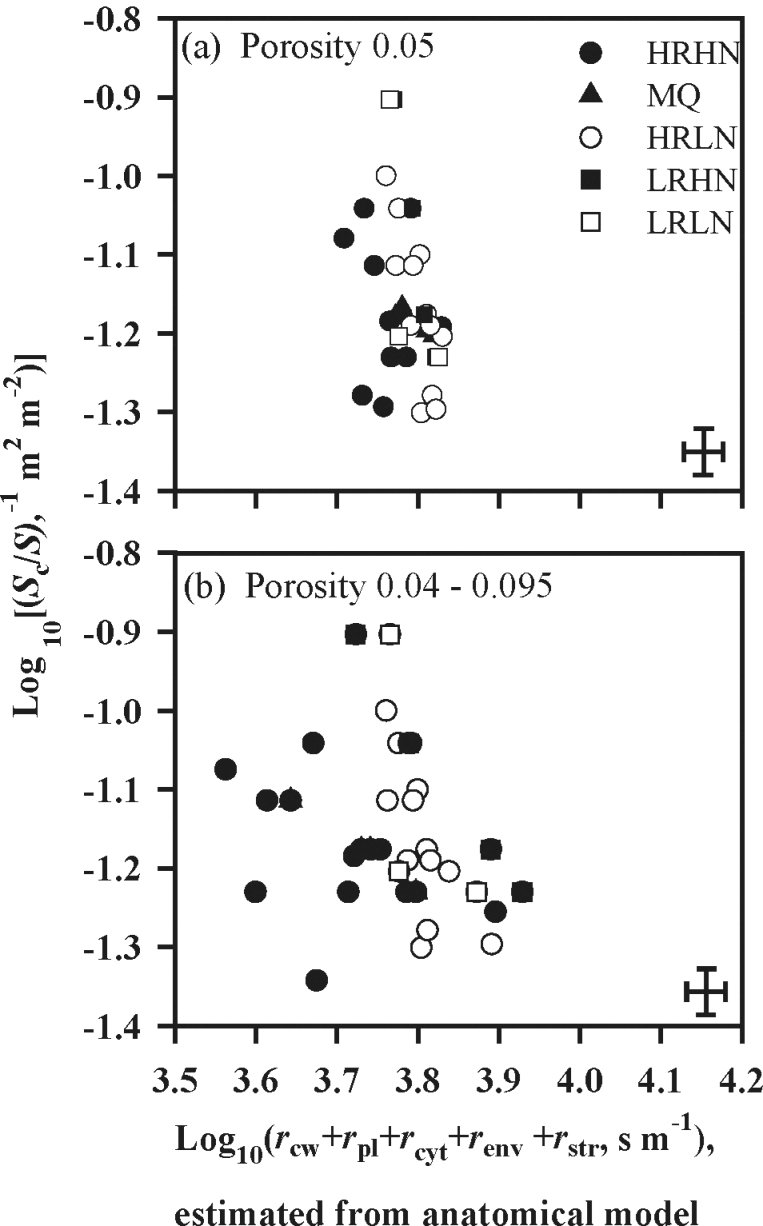
where the partial resistances are: r cw for cell wall, r pl for plasmalemma, r cyt for cytosol, r env for the chloroplast envelope, and r str for the chloroplast stroma. r cellular was defined further as the sum of r cw+r pl+r cyt+r env+r str. Liquid phase resistance r liq is lower if there is a broad pathway into mesophyll cell walls facing the chloroplasts (S c/S), but higher if r cellular is high along a unit cross-section of that pathway. Accordingly, the contributions of pathway breadth S c/S relative to r cellular were visualized by plotting log10 [(S c/S)–1] against log10 r cellular.
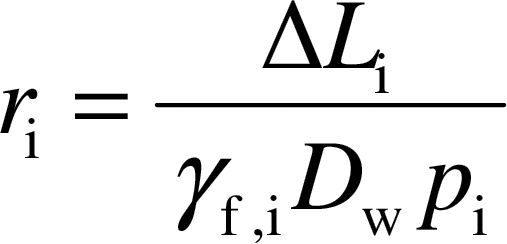
The cell wall, cytosol, and stroma resistances (r i) are given by a general equation (Nobel, 1991):
 |
(9) |
where ΔL i (m) is the diffusion path length and p i (m3 m–3) is the effective porosity in the given part of the diffusion pathway, D w is the aqueous phase diffusion coefficient for CO2 (1.790×10⁻⁹ m2 s–1 at 25 °C) and the dimensionless factor γ f,i accounts for the decrease of diffusion conductance in the cytosol and in the stroma compared with free diffusion in water (Weisiger, 1998). The values of γ f,i used were 1 for cell walls and 0.294 for the cytosol and stroma (Niinemets and Reichstein, 2003a). The diffusion pathlength was taken as equal to the cell wall thickness for r cw, the average distance between the chloroplasts and cell wall for r cyt, and half of the chloroplast thickness for r str (Tosens et al., 2012). Although carbonic anhydrase could potentially affect r str in non-steady-state conditions (Evans et al., 2009; Terashima et al., 2011), the evidence of the involvement of carbonic anhydrase in determining r str is currently equivocal and was not considered in the current study to avoid additional assumptions [see Discussion and Tosens et al. (2012) for further discussion].
Effective porosity, p i, was taken as 1 for r cyt and r str. Initially, a constant value of 0.05 was applied for the porosity of cell walls (Terashima et al., 2006). However, as there is evidence that effective porosity decreases with increasing thickness of the cell walls (Evans et al., 2009), a least squared iterative analysis was used instead, varying the p i of the cell wall to get the best fit (highest r 2) between the measured and modelled r m values. Best fit was obtained by varying p i linearly from 0.095 at the lowest cell wall thickness of 0.252 µm to 0.040 at the maximum cell wall thickness of 0.420 µm. This method is referred to as the variable p i approach.
CO2 diffusion resistance through the plasma membrane (r pl) and chloroplast envelope membranes and (r env) cannot be estimated from micrographs. In addition, the CO2 diffusion rate through membranes can be modified by aquaporins (Flexas et al., 2006b, 2012; Hanba et al., 2004). However, it has been suggested that CO2 permeability through lipid bilayers is high, on the order of 0.03 m s–1, and therefore aquaporins have only a minor impact on CO2 permeability (Missner et al., 2008). By contrast, it was suggested by Boron et al. (2011) that membrane permeability can be two orders of magnitude less and aquaporins play a key role in membrane permeability. As suggested in the review of Evans et al. (2009), aquaporins could limit 30% of the lipid-phase diffusion resistance at most. Membrane permeability can be estimated from CO2 lipid-phase solubility using structure–function relationships as suggested by Niinemets and Reichstein (2003a), but information of the lipid-phase solubility of CO2 is limited. Due to incomplete information about CO2 diffusion through biological membranes, a constant value of 0.0035 m s–1 for both r pl and r env was used in the present study, as had been successfully employed by Evans et al. (1994) and Tosens et al. (2012).
Results
Performance of the anatomical model of mesophyll diffusion resistance
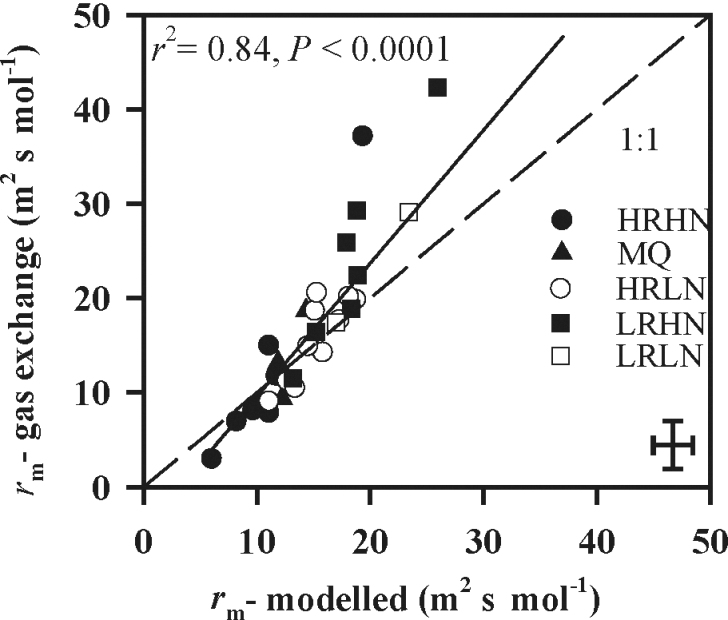
The species-mean estimates of r m calculated from anatomical measurements were tightly correlated with the estimates obtained from coupled gas-exchange/fluorescence measurements (Fig. 1, r 2=0.84, P <0.0001). This indicates that equations 6–9 provide a reasonable assessment of relative contributions of different leaf anatomical features to mesophyll resistance. The estimates made from anatomy tended to overestimate mesophyll resistance in low-resistance species and underestimate it in high-resistance species. The average (±SE) discrepancy between modeled and measured r m was 15.6±0.03%.
Fig. 1.
Correlation between mesophyll diffusion resistance determined from combined gas-exchange and chlorophyll fluorescence measurements (equation 1, r m, gas exchange) and mesophyll resistance calculated from anatomical data (equations 6–9, r m, modelled). Data were fitted by linear regression. The error bars in the lower right corner indicate the maximum size of standard errors across species. HRHN, higher rain, high nutrients; MQ, Macquarie University campus; HRLN, higher rain, low nutrients; LRHN, lower rain, high nutrients; LRLN, lower rain, low nutrients. See Table 2 for studied species and site information.
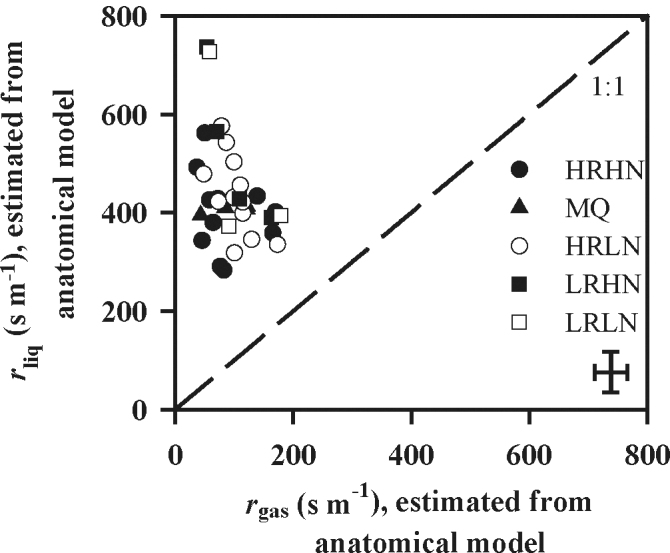
Estimated liquid-phase resistance was consistently larger than gas-phase resistance, and varied more widely (Fig. 2). Most values of r liq fell in the range of 250–600 s m–1 compared with 40–180 s m–1 for r gas. Consequently, differences in r m between species arose mainly from variations of the components of r liq. Plotting log10[(S c/S)–1] against log10 r cellular to separate the contributions of the components of r liq demonstrated that the variation in (S c/S)–1 spanned about 0.5 log10 units (i.e. c. 3-fold; Fig. 3a). The sum of resistances along a unit cross-section of the pathway as estimated by equations 6–9 varied rather narrowly, by about 0.1 log10 units (Fig. 3a). Chloroplasts represent potentially the longest diffusion path in the liquid phase (Table 2). Nevertheless, the largest contribution to r cellular resulted from cell walls, being more than 50% in all species (Table 3). These values were estimated assuming a constant cell wall porosity of 0.05 in all species. However, when the porosity of cell walls was assumed to decrease with increasing the thickness of cell walls as described in the Materials and methods, r cellular was predicted to be at least as important as S c/S in determining the variation in r m across the species (Fig. 3b).
Fig. 2.
Relationship between the CO2 diffusion resistance in liquid (r liq) and gas phase (r gas). r liq is the sum of partial cellular resistances in cell wall (r cw), plasmalemma (r pl), cytosol between cell wall and chloroplast (r cyt), chloroplast envelope (r env), and chloroplast stroma (r str) multiplied by the inverse of chloroplast exposed to total leaf surface area ratio (S c/S)–1: (r cw+r pl+r cyt+r env+r str)/(S c/S). In the r liq calculations, we assumed a mesophyll cell wall porosity of 0.05 for all species. Representation of symbols and error bars as in Fig. 1.
Fig. 3.
Relationship between the inverse of chloroplastsurface area exposed to intercellular airspace per unit leaf area (S c/S)–1, and the sum of individual cellular resistances [(r cw+r pl+r cyt+r env+r str)]. Both axes are log-transformed. Log (liquid-phase resistance) is the sum of these two log-components, Log[(S c/S)–1] and Log(r cw+r pl+r cyt+r env+r str) and increasestowards the upper right corner. The sum of serial liquid-phase resistances was calculated assuming a constant mesophyllcell wall porosity of 0.05 for all species (a), or assumingvariable porosity of mesophyll cell walls, with porosity rangingfrom 0.040 to 0.095, decreasing with increasing depth of cellwall (b). A constant value of 0.0035 m s–1 was assigned toboth r pl and r env. Symbols and error bars as in Fig. 1.
Table 3.
Contribution of different components of cellular resistance to the total cellular resistance, estimated from the anatomical model for the 32 study species from five sites*1
A constant mesophyll cell wall porosity of 0.05 was assumed for all species.
| Species | Sitea | Contribution to total cellular resistance (%) | |||
|---|---|---|---|---|---|
| Stroma | Cell walls | Cytosol | Membranesb | ||
| Acacia longifolia | HRHN | 30.7 | 55.5 | 4.3 | 9.2 |
| Acacia myrtifolia | HRLN | 26.2 | 59.5 | 5.0 | 9.2 |
| Acacia suaveolens | HRLN | 24.0 | 62.6 | 4.7 | 8.7 |
| Angophora hispida | HRLN | 21.8 | 66.3 | 2.9 | 9.0 |
| Astrotrichia floccosa | HRHN | 27.8 | 57.2 | 3.8 | 11.2 |
| Banksia aemula | LRLN | 20.5 | 65.4 | 4.5 | 9.6 |
| Banksia integrifolia | MQ | 29.9 | 56.1 | 4.5 | 9.6 |
| Banksia marginata | HRLN | 19.5 | 68.2 | 3.3 | 9.0 |
| Banksia oblongifolia | HRLN | 20.3 | 66.6 | 4.2 | 9.0 |
| Banksia robur | MQ | 30.3 | 55.1 | 4.7 | 10.0 |
| Banksia serrata | MQ | 22.7 | 64.8 | 4.0 | 8.7 |
| Banksia serrata | HRLN | 22.7 | 64.5 | 4.1 | 8.7 |
| Banksia spinulosa | LRHN | 20.8 | 66.1 | 4.2 | 8.9 |
| Eriostemon australasius | HRLN | 25.4 | 60.4 | 4.5 | 9.6 |
| Eucalyptus fibrosa | LRHN | 18.0 | 69.0 | 4.1 | 8.6 |
| Eucalyptus haemastoma | LRHN | 29.9 | 55.9 | 3.3 | 10.9 |
| Eucalyptus sclerophylla | LRLN | 18.1 | 69.9 | 3.4 | 8.6 |
| Eucalyptus umbra | HRHN | 20.1 | 67.8 | 3.7 | 8.5 |
| Grevillea speciosa | HRLN | 20.5 | 60.0 | 4.3 | 9.2 |
| Hakea dactyloides | HRLN | 18.9 | 68.5 | 4.0 | 8.6 |
| Lambertia formosa | HRHN | 28.1 | 57.5 | 4.6 | 9.8 |
| Lambertia formosa | HRLN | 22.2 | 65.1 | 4.2 | 8.5 |
| Macadamia ternifolia | MQ | 21.4 | 64.4 | 4.5 | 9.7 |
| Macrozamia communis | HRHN | 32.0 | 52.6 | 5.1 | 10.3 |
| Macrozamia spiralis | LRHN | 19.6 | 67.0 | 4.3 | 9.2 |
| Notolea longifolia | HRHN | 21.0 | 65.8 | 4.0 | 9.2 |
| Persoonia lanceolata | HRLN | 25.2 | 60.7 | 4.5 | 9.6 |
| Persoonia laurina | LRLN | 26.3 | 59.3 | 4.6 | 9.8 |
| Persoonia laurina | LRHN | 23.2 | 62.6 | 4.6 | 9.7 |
| Persoonia levis | HRLN | 27.3 | 58.1 | 4.7 | 9.9 |
| Pittosporum undulatum | MQ | 30.4 | 54.8 | 4.8 | 10.0 |
| Polyscias sambucifolia | MQ | 31.7 | 52.4 | 5.3 | 10.6 |
| Syncarpia glomulifera | HRHN | 30.3 | 55.3 | 4.5 | 9.8 |
| Synoum glandulosum | HRHN | 27.5 | 57.2 | 4.7 | 10.6 |
| Xylomelum pyriforme | HRHN | 24.2 | 62.1 | 4.3 | 9.4 |
a Site codes as in Table 2.
b Membrane contribution is determined by the permeabilities of plasmalemma and chloroplast envelope membranes. These permeabilities were fixed at a constant value of 0.0035 m s–1 for all species. However, the contribution of membrane permeabilities to total cellular resistance varies due to the variation in numerical values for the other components of the diffusion pathway.
Mesophyll cell wall as an important contributor to mesophyll resistance
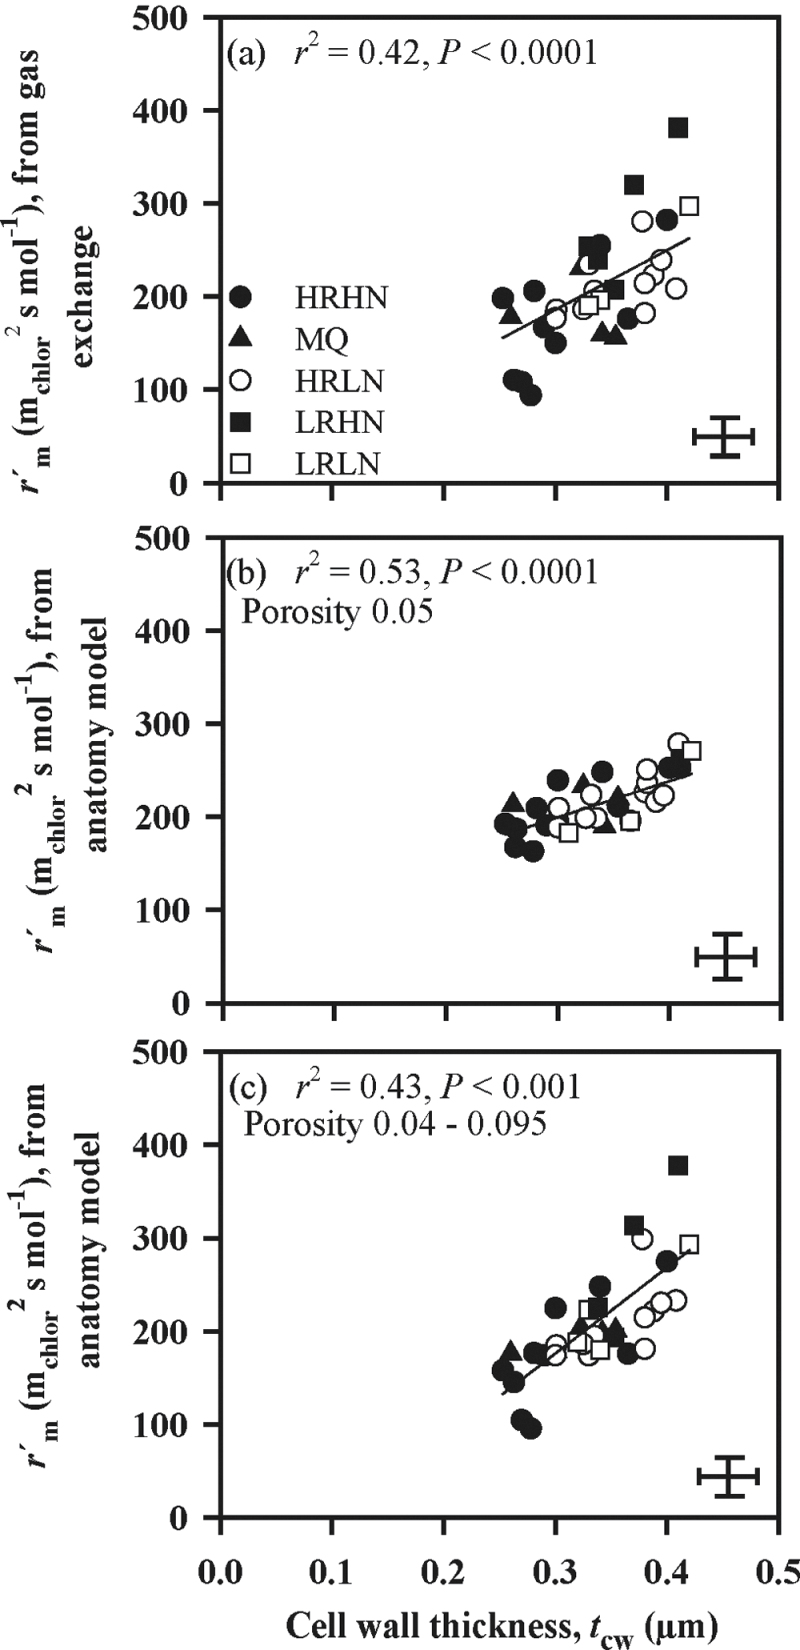
Mesophyll cell wall thickness was a strong predictor of interspecific variation in mesophyll resistance per unit of exposed chloroplast surface ( , Fig. 4a). By contrast, variation in
  calculated from anatomy (Fig. 4b) was only about as large as expected from the direct influence of cell wall thickness on resistance. Mesophyll cell wall porosity was treated initially as a constant of 0.05 in these calculations. When the porosity was assumed to decrease with increasing cell wall thickness (as in Fig. 3b), the consequence of the assumption of variable porosity was that the wall resistance varied across species considerably more widely than wall thickness per se – approximately 5-fold more (Fig. 4a, 4c).
Fig. 4.
Correlations between mesophyll resistance per unit exposed chloroplast surface area,  and cell wall thickness (t
cw) for
  estimates derived from gas-exchange measurements (a) and modelled using anatomical data, either assuming a constant mesophyll cell wall porosity of 0.05 for all species (b) or varying the porosity (p
i) between 0.040 to 0.095 across species (c). In the latter case, the best fit was obtained by varying p
i linearly from 0.095 at the lowest cell wall thickness of 0.252 µm to 0.040 at the maximum cell wall thickness of 0.420 µm. Representation of symbols and error bars as in Fig. 1.
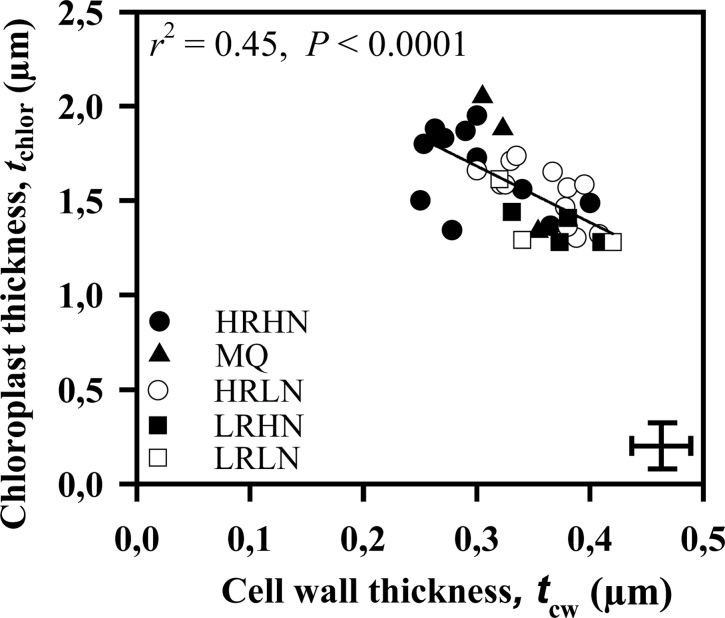
Comparing Fig. 3b with Fig. 3a, the species from the high-rain high-nutrient site tended to be separate from the other species, towards lower r cellular. They tended to have distinctly thinner mesophyll cell walls (Table 4), and the implications of that difference for wall resistance were amplified when porosity was assumed to be higher in thin-walled species. Chloroplast thickness and t cw tended to co-vary in such a way that species with thick cell walls tended to have thinner chloroplasts adjacent to them (Fig. 5).
Table 4.
Average (±SE) cell wall thickness (t cw) and chloroplast surface area exposed to intercellular airspace per unit leaf area (S c/S) in four contrasting environments
Means with the same letter are not significantly different (P >0.05). Only the species sampled from natural sites were included. The low rain, low nutrient site was not included in the statistical analysis due to limited sample size.
| Site | t cw (µm) | S c/S (m2 m–2) |
|---|---|---|
| High rain, high nutrient | 0.322±0.030 a | 15.3±1.0 a |
| High rain, low nutrient | 0.356±0.012 b | 13.4±1.0 a |
| Low rain, high nutrient | 0.365±0.034 b | 15.0±1.3 a |
| Low rain, low nutrient | 0.360±0.033 | 13.7±1.1 |
Fig. 5.
The relationship between cell wall thickness, t cw, and chloroplast thickness, t chlor across the species. Data were fitted by linear regression. Symbols and error bars as in Fig. 1.
Structural limitations to r m measured in the field
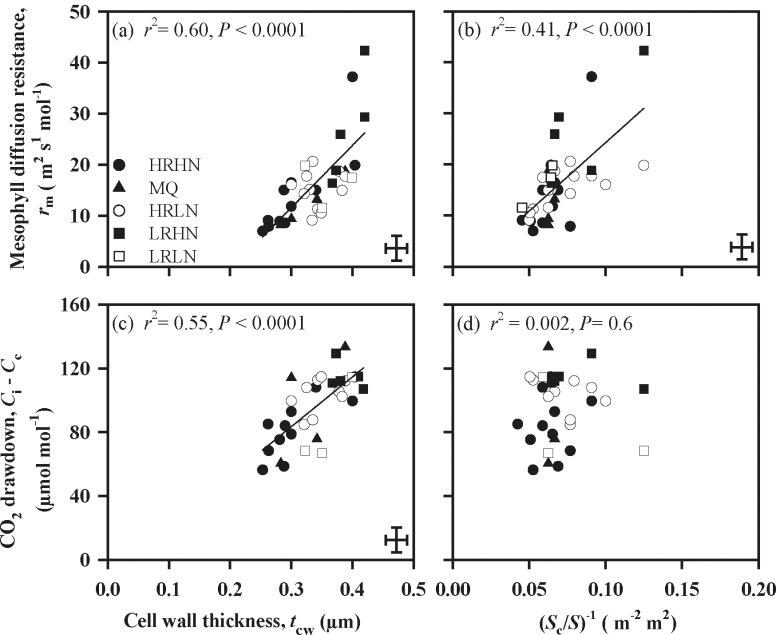
As expected, given the above results from model predictions, variation in t cw and S c/S predicted a considerable portion of that in r m measured via gas exchange (Fig. 6a, 6b). The estimated CO2 concentration drawdown from the internal airspace into the chloroplast (C i–C c) was well correlated with mesophyll cell wall thickness (Fig. 6c) but unrelated to S c/S (Fig. 6d).
Fig. 6.
Mesophyll resistance (r m, (a, b) and CO2 drawdown from intercellular airspace to chloroplasts (C i–C c, (c, d)) in relation to (a, c) mesophyll cell wall thickness, t cw, and (b, d) chloroplast surface area exposed to intercellular airspace per unit leaf area (S c/S). The data were fitted by linear regression. The symbols and error bars as in Fig. 1.
How Australian sclerophylls increase S c/S
Finally, we turn to the anatomical features which lead to a highly exposed chloroplast area per unit surface area of the leaf (this being one of the two leading influences on total mesophyll resistance). S c/S did not increase with the depth of the leaf lamina nor with the depth of mesophyll (see Supplementary Fig. S1a, b at JXB online). S c/S and f ias were negatively correlated (Fig. 7a).
Fig. 7.
Correlations of chloroplast surface area exposed to intercellular airspace per unit leaf area, S c/S, (a) the fraction of mesophyll occupied by intercellular airspace, f ias; (b) the fraction of mesophyll cell volume in palisade tissue, f pal; and (c) mesophyll surface area exposed to intercellular airspace per unit leaf area, S mes/S. The data were fitted by linear regressions. Data presentation and error bars as in Fig. 1.
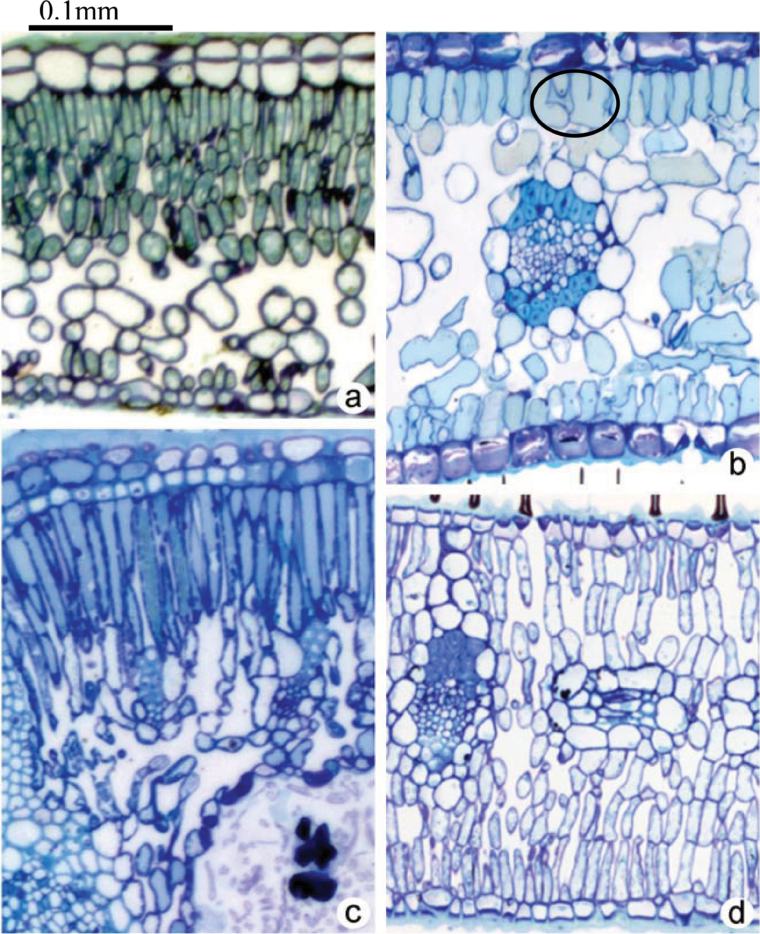
The most important source of variation across species with regard to the exposed mesophyll cell surface, and hence in the exposed chloroplast surface, proved to be the fraction of mesophyll contributed by the palisade tissue (Fig. 7b). There seemed to be several factors contributing to this. First, although two-dimensional sections often give the impression that the palisade mesophyll is closely packed, in fact, many of its cell surfaces are adjacent to airspaces. Second, the proportion of cell surface occupied by exposed chloroplasts tended to be greater in palisade than in spongy tissue (data not shown). Third, the elongated shape of palisade cells means that they have more cell surface per volume than do spongy mesophyll cells. Fourth, palisade cells were quite small in many of the species studied here, which also increases the amount of cell surface per volume occupied. These tendencies are shown in Fig. 8a–d (transverse anatomical sections from selected species). Further, c. 50–90% of S c/S was controlled by palisade compared with spongy mesophyll among the study species (see Supplementary Table S1 at JXB online). As might be expected, the area of chloroplasts adjacent to airspaces was strongly correlated with the area of mesophyll cell surface adjacent to airspaces (Fig. 7c).
Fig. 8.
Representative light micrographs of leaf transverse sections demonstrating the strategies in Australian species to reduce mesophyll resistance by increasing S mes/S and S c/S. (a) Stacked layers of small palisade cells in Pittosporum undulatum; (b) armed cells in Persoonia lanceolata leaf (inside the circle); (c) mesophyll cell elongation in Banksia integrifolia; and (d) multiple layers of palisade cells in the lower and upper leaf sides in Eucalyptus haemastoma. The sections were stained with Toluidine blue and the photos are taken at magnification of ×10.
Discussion
Diffusion model of mesophyll resistance
The correspondence between r m data from the anatomical model and gas exchange measurements (r 2=0.84) can be considered good given that there are various uncertainties inherent to both measurement and modelling approaches (e.g. in gas exchange methods the assumptions concerning the fraction of light absorbed by PSII; Pons et al., 2009). As argued above, in our view, the approach outlined in equations 6–9 allows for a trustworthy assessment of the relative contributions of different anatomical features to overall mesophyll resistance.
In our model, r m is divided between two components, r gas and r liq (equation 6). r gas increases with decreasing f ias and increases with increasing leaf thickness, while r liq increases with increasing the length of composite parts of the diffusion pathway and decreases with increasing S c/S that determines the number of parallel diffusion pathways into the cells (Terashima et al., 2006). Because gas diffusion in the liquid phase is c. 10 000-fold slower than in the gas phase, the bulk of diffusional limitations is in the liquid phase (Syvertsen et al., 1995; Piel et al., 2002; Terashima et al., 2006). Our study across Australian sclerophyll species supports the idea that r gas is negligible compared with r liq. Furthermore, r liq varied more among species than did r gas (Fig. 2). In the liquid phase, variation in (S c/S)–1 was greater than that in r cellular, at least when cell wall porosity was assumed to be invariant (Fig. 3a).
It has been assumed that membranes of all species are similarly permeable to CO2 and a constant permeability value suggested by Evans et al. (1994) was used. Under this assumption membranes contributed c. 8–11% of the total r cellular (Table 3). It has been suggested that CO2 diffusion through membranes is regulated by aquaporins (Hanba et al., 2004; Flexas et al., 2006b; Terashima et al., 2006, 2011). Primarily, aquaporins have been associated with short-term fluctuations in r m, for example, if plants are suddenly exposed to extreme drought (Terashima et al., 2011), and it has been suggested that membrane permeability can be reduced by as much as two orders of magnitude (Boron et al., 2011), while other studies suggest that the role of aquaporin is minor (Missner et al., 2008; and the discussion in Flexas et al., 2012). The debate over the role of aquaporins has clearly not yet settled, but, in our study, a satisfactory agreement between modelled and measured r m was achieved by ignoring the possible interspecific variations in lipid phase resistance.
It was found that most chloroplasts were positioned close to cell walls, with only a very thin layer of cytosol in between. Cytoplasm thickness varied little among species and, on average, it accounted for c. 3–5% of the total liquid phase resistance (Table 3). Gillon and Yakir (2001) proposed that r str is primarily controlled by carbonic anhydrase (CA) activity in the chloroplast. They suggested that CA activity is increasingly important to facilitate CO2 diffusion in species with thick cell walls such as evergreen sclerophylls (Gillon and Yakir, 2001). At the normal cytosolic pH of 7.5, cytosolic CA should be sufficiently active to ensure the fast interconversion of CO2 and bicarbonate. However, to date, there is little evidence that variation in cytosolic CA significantly influences r m (Terashima et al., 2006). In addition, the studies of Price et al. (1994) and Williams et al. (1996) with genetic transformants with low chloroplastic CA, indicated a minor effect of chloroplastic CA levels on photosynthetic performance. The results presented here suggested that r str is controlled by the length of the physical CO2 diffusion path in chloroplasts. This importance of chloroplast thickness is also indirectly supported by the fact that species with thicker mesophyll cell walls had thinner chloroplasts adjacent to these cell walls. Therefore, species with high cell wall resistance might be under particularly strong evolutionary selection to reduce r str by minimizing the diffusion path length in chloroplasts.
Overall, the correspondence between measured and modelled estimates of diffusion resistance is striking (Fig. 1), and provides encouraging evidence that the principal processes governing interspecific variation in r m were captured by the model. More complex 3D models have been developed (Aalto and Juurola, 2002; Tholen and Zhu, 2011), and such models probably have greater predictive capacity. However, parameterization of such models is currently highly time-consuming and the parameterizations are not general such that we feel that a simple 1D model as used here is more practical for interspecific comparisons where a large number of species needs to be examined.
Mesophyll cell wall as an important contributor to mesophyll resistance
The relationship between t cw and mesophyll resistance calculated per unit of S c/S was steeper than the observed variation in cell wall thickness could have been capable of producing according to equations 6–9 with the cell wall porosity at a constant value of 0.05, as we initially treated it (Fig. 4a, 4b). This steeper response probably reflects a variation in a model variable that has considerable influence on r m, and that was taken as a constant in the initial analyses. Consider first the possibility that such a variable occurred in equations 6–9 and was measured for different species. For example, cell wall thickness might have been correlated with low S c/S increasing mesophyll resistance by narrowing the pathway into cells or with a low fraction of intercellular airspace increasing gas-phase resistance. But, in both cases, the variable would have influenced the estimate of mesophyll resistance made from anatomical measurements through equations 6–9, and that estimate would have been correlated with mesophyll cell wall thickness in the same manner as the mesophyll resistance measured through gas exchange, shown in Fig. 4a. However, the mesophyll resistance calculated from anatomy (Fig. 4b) was much more weakly correlated with cell wall thickness, the relationship being only about as strong as expected from the direct influence of cell wall thickness on resistance.
It follows, therefore, that the extra variable correlated with cell wall thickness and it was not treated as a variable in the calculation by equations 6–9. The likeliest candidate is the porosity of the walls of mesophyll cells. Initially this was treated as a constant of 0.05 in the calculations described above, which resulted in reasonable total mesophyll resistance values across species. However, if wall porosity varied substantially and was correlated with wall thickness, this could account for the stronger effect of cell walls on liquid phase resistance (Fig. 4a, 4b). The resistance imposed by cell walls depends on cell wall porosity, the tortuosity of pores, and cell wall thickness. Values for cell wall porosity and tortuosity of the pores are poorly known (Evans et al., 2009); for example, porosities suggested in the literature include 0.05, 0.07, 0.1 or 0.3 (Evans et al., 2009; Nobel, 1991; Terashima et al., 2006). It was noted by Terashima et al. (2006) that cell wall porosity might vary considerably across species, and that r
cw would become an important factor determining internal diffusion resistance at porosities below 0.1. When porosity was modelled as varying from 0.040 to 0.095 and as being negatively correlated with cell wall thickness, then cell wall thickness contributed to variation in  as much as that observed (Fig. 4). The effect of assuming porosity varying in conjunction with cell wall thickness was to make wall resistance at least as important as S
c/S as a source of variation across species in determining mesophyll resistance (Figs. 3,4).
It is emphasized that the linear decline of mesophyll cell wall porosity with cell wall thickness used in our calculations is hypothetical and should not be interpreted as a measured relationship. There are no direct measurements of cell wall porosity, and it remains logically possible that the discrepancy between Fig. 4a and 4b could be resolved by a correlation between cell wall thickness and some other trait that increased resistance. Nevertheless, our provisional opinion is that the most biologically plausible explanation is for thicker cell walls to be more lignified and have less pore volume per unit depth.
Structural limitations to photosynthesis measured in the field
According to our model calculations, and to our results (Fig. 6a, 6b), there are two main sources of variation in r m across Australian sclerophyll species: t cw and S c/S.
Previously, a strong negative relationship between r m and S c/S in annual species with thin cell walls has been demonstrated by Evans et al. (1994), whereas the correlation was far weaker among forest tree species with thicker mesophyll cell walls (Terashima et al., 2006), as also seen here. No effect of S c/S on r m was shown by Kogami et al. (2001). The cause of such a difference between studies is probably higher t cw in evergreen and some deciduous species (Terashima et al., 2006). Here, HRLN and LRHN species had significantly thicker cell walls (Table 3) and, consequently, had generally higher r m per (S c/S)–1 (Fig. 4). This suggests that the negative effect of a longer diffusion pathway dominates over the positive effect of high S c/S in species with thicker mesophyll cell walls.
Since r m varies widely across Australian sclerophyll species and it is higher in leaves with thicker cell walls, the question arises to what extent photosynthesis is limited by r m. It has been suggested that the degree to which photosynthesis is limited by structure is approximately invariant across species (Evans and Loreto, 2002). However, a number of subsequent studies have demonstrated that C i–C c does, in fact, vary among species (Warren, 2008); for example, it is generally higher in high LMA leaves with robust structure (Niinemets et al., 2005; Niinemets and Sack, 2006), and in leaves with thicker cell walls (current study). By contrast, C c varied little among the five Banksia species studied by Hassiotou et al. (2009). Yet, just as here, there was a strong negative relationship between g m (r m=1/g m) and t cw. Overall, these results collectively suggest that in Australian sclerophyll species photosynthesis is more limited by r m in leaves with thicker cell walls.
Integrative trait LMA fails to predict r m across broad sample of species
Flexas et al. (2008) drew an upper boundary of r m versus LMA relationship that increased linearly with increasing LMA. The trend, when extrapolated, predicts an infinite r m at an LMA of about 250g m–2 . However, in Australian sclerophylls, r m and C i–C c were in the same range as those in other broad-leaved evergreen sclerophyll species, although Australian sclerophyll leaves possess somewhat greater LMA values (Niinemets et al., 2009b; Hassiotou et al., 2010).
According to Syvertsen et al. (1995); Hanba et al. (1999, 2001), Miyazawa and Terashima (2001); Terashima et al. (2001, 2006), and Tosens et al. (2012), t cw varies from 0.2–0.3 µm in deciduous species and from 0.3–0.5 µm in evergreen species, whereas S c/S varies from 8–23 m2 m–2. Anatomical measurements from this study indicate that, in these highly sclerophyllous species S c/S and t cw are in the same range as reported for other sclerophylls and deciduous tree species (accordingly, 8–22 m2 m–2 and 0.252–0.420 µm, see also Tables 2 and 4). Similarly, Hassiotou et al. (2010) reported t cw values from approximately 0.23–0.43 µm in Banksia species. Although r m often correlates with the integrative trait LMA (Niinemets et al., 2009c), Australian species are outliers in the general LMA and r m relationship (Hassiotou et al., 2009; Niinemets et al., 2009b). While, in other sclerophylls, thick-walled mesophyll is distributed uniformly between the epidermal layers, in Australian sclerophylls (e.g. Proteaceae) there is characteristically a heterogeneous distribution of thick-walled sclerenchyma and mesophyll islands, where the individual mesophyll cell does not necessarily have thick cell walls (Jordan et al., 2005; Niinemets et al., 2009b).
How Australian sclerophyll leaves increase S c/S
According to the model predictions, one of the most important sources of variation in r m was S c/S. That led us to the question of what features of leaves are conducive to exposing large areas of chloroplast at the cell surfaces per unit surface area of the leaf. It is commonly assumed that increased t leaf reflects both higher S c/S as well as S mes/S (Hanba et al., 2002, Terashima et al., 2006), and across annuals and deciduous species this relationship does indeed seem to hold (Evans et al., 1994; Hanba et al., 1999; Terashima et al., 2006; Tosens et al., 2012). However, across the woody sclerophyll species studied in this work, S c/S did not correlate with leaf (or mesophyll) thickness (see Supplementary Fig. S1a, b at JXB online). Similarly, Slaton and Smith (2002) analysed species across a wide range of genera and did not find a positive correlation between S mes/S and t mes.
Thick leaves have been considered disadvantageous because of increased gas phase resistance (Parkhurst, 1994; Terashima et al., 2001). In the leaves of Hakea dactyloides (Proteaceae) the thickest in this study, r gas contributed 30% of r m. Presumably thick-leaved sclerophyll species would most benefit from minimizing gas phase resistance as much as possible and organizing their mesophyll to that end. For example, S c/S can be increased (Terashima et al., 2011) by having several layers of small palisade cells (Figs 8a, 8d), by having armed type cells (Fig. 8b, shown within the circle (as noted by Terashima et al., 2011, armed cells having lobes help to increase S c/S) or by cell elongation (Fig. 8c). The palisade cells were small in most of the species studied here (Fig. 8a, 8b, 8d). Out of these strategies, only cell elongation might require a simultaneous increase in leaf thickness, but otherwise it is just a matter of mesophyll architecture. By having small-celled leaves can decrease gas phase resistance and simultaneously increase S c/S (Terashima et al., 2006). Hassiotou et al. (2010) reported a positive correlation between the length of palisade cells and leaf thickness in Banksia species. In our study the fraction of mesophyll composed of palisade varied from 50–90% (see Supplementary Table S1 at JXB online). This fraction was positively correlated with S c/S (Fig. 7b), indicating that palisade tissue did importantly contribute to S c/S.
The intercellular airspace volume fraction correlated negatively with S c/S, indicating that many of the species studied tended to pack their mesophyll tightly and leave just sufficient airspace adjacent to the cell walls for CO2 dissolution. This contrasts with the positive correlation between the fraction of intercellular air spaces and S c/S reported for tobacco (Evans et al., 1994). As expected, species in our study with high S mes/S also had higher S c/S (Fig. 7c). This positive relationship has also been reported by Hanba et al. (2001) and Terashima et al. (2006).
Often it is assumed that higher t leaf reflects higher S c/S (Hanba et al., 1999; Terashima et al., 2011). Our data call into question such postulations. Considered across a wide range of species, there was no relationship between S c/S and leaf (or mesophyll) thickness.
Conclusions
Although advanced three-dimensional models of mesophyll resistance have been developed, parameterizing these models is complicated and laborious for a large number of species, as studied here. Further, the predictive power of these models has not yet been tested across species. Overall, our calculations demonstrate that r m can be successfully predicted from a simple 1-dimensional model which assumes that r m is determined by key structural leaf anatomical traits that determine the diffusion pathway length.
The two strongest sources of variation across species in total mesophyll resistance are the components of liquid phase resistance: S c/S, the area of chloroplast exposed at the mesophyll cell surfaces per unit surface area of the leaf, and cell wall resistance. These data demonstrate that structural limitations to photosynthesis are more enhanced in leaves with thicker cell walls. As explained above, the steep relationship of liquid phase resistance with cell wall thickness can not be explained by cell wall thickness alone and most likely arises from a further effect of cell wall porosity varying with cell wall thickness. Overall, these data demonstrate that, across the broad sample of species possessing various structural foliage adaptation mechanisms to cope with adverse environmental conditions, simple integrative traits such as LMA alone fail to predict r m.
Supplementary data
Supplementary data can be found at JXB online.
Supplementary Table S1. Contribution (%) of exposed mesophyll surface area per unit of leaf area (S c/S) that was controlled by palisade mesophyll (S c,pal/S) compared with spongy mesophyll (S c,spon/S), for the study species from five sites.
Supplementary Fig. S1. Correlations of chloroplast surface area exposed to intercellular airspace per unit leaf area, S c/S, with (a) leaf thickness, t leaf, and (b) mesophyll thickness, t mes.
Acknowledgements
We thank Dr Martha Ludwig, Dr Bernard Genty, and anonymous reviewers for critical comments and correction of the manuscript. Financial support was provided by the Estonian Ministry of Education and Science (SF1090065s07), the Estonian Science Foundation, and the European Commission through the European Regional Fund (the Center of Excellence in Environmental Adaptation); TT was the recipient of iMQRES scholarship.
References
- Aalto T, Juurola E. 2002. A three-dimensional model of CO2 transport in airspaces and mesophyll cells of a silver birch leaf Plant, Cell and Environment 25 1399–1409 [Google Scholar]
- Ayub G, Smith RA, Tissue DT, Atkin OK. 2011. Impacts of drought on leaf respiration in darkness and light in Eucalyptus saligna exposed to industrial-age atmospheric CO2 and growth temperature New Phytologist 190 1003–1018 [DOI] [PubMed] [Google Scholar]
- Bernacchi CJ, Singsaas EL, Pimentel C, Portis AR, Long SP., Jr 2001. Improved temperature response functions for models of Rubisco-limited photosynthesis Plant, Cell and Environment 24 253–259 [Google Scholar]
- Boron WF, Endeward V, Gros G, Musa-Aziz R, Pohl P. 2011. Intrinsic CO2 permeability of cell membranes and potential biological relevance of CO2 channels ChemPhysChem 12 1017–1019 [DOI] [PubMed] [Google Scholar]
- Dodds WS, Stutzman LF, Sollami BJ. 1956. Carbon dioxide solubility in water Industrial and Engineering Chemistry. Chemical and Engineering Chemistry Data Series 1 92–95 [Google Scholar]
- Evans JR, Genty B, Kaldenhoff R, Terashima I. 2009. Resistances along the CO2 diffusion pathway inside leaves Journal of Experimental Botany 60 2235–2248 [DOI] [PubMed] [Google Scholar]
- Evans JR, Loreto F. 2002. Acquisition and diffusion of CO2 in higher plant leaves. In: Legood RC, Sharkey TD, von Caemmerer S, eds. Photosynthesis physiology and metabolism Dordrecht: Kluwer Academic Publishers; 321–351 [Google Scholar]
- Evans JR, von Caemmerer S, Setchell BA, Hudson GS. 1994. The relationship between CO2 transfer conductance and leaf anatomy in transgenic tobacco with a reduced content of Rubisco Australian Journal of Plant Physiology 21 475–495 [Google Scholar]
- Flexas J, Barbour MM, Cabrera HM, et al. 2012. Mesophyll diffusion conductance to CO2: an unappreciated central player in photosynthesis Plant Science (in press) [DOI] [PubMed] [Google Scholar]
- Flexas J, Bota J, Galmes J, Medrano H, Ribas-Carbo M. 2006a. Keeping a positive carbon balance under adverse conditions: responses of photosynthesis and respiration to water stress Physiologia Plantarum 127 343–352 [Google Scholar]
- Flexas J, Diaz-Espejo A, Galmés J, Kaldenhoff R, Medrano H, Ribas-Carbó M. 2007. Rapid variations of mesophyll conductance in response to changes in CO2 concentration around leaves Plant, Cell and Environment 30 1284–1298 [DOI] [PubMed] [Google Scholar]
- Flexas J, Loreto F, Niinemets Ü, Sharkey T. 2009. Special Issue: mesophyll conductance to CO2: mechanisms, modelling, and ecological implications, Preface Journal of Experimental Botany 60 2215–2216 19469054 [Google Scholar]
- Flexas J, Ribas-Carbo M, Diaz-Espejo A, Galmes J, Medrano H. 2008. Mesophyll conductance to CO2: current knowledge and future prospects Plant, Cell and Environment 31 602–621 [DOI] [PubMed] [Google Scholar]
- Flexas J, Ribas-Carbo M, Hanson DT, Bota J, Otto B, Cifre J, McDowell N, Medrano H, Kaldenhoff R. 2006b. Tobacco aquaporin NtAQP1 is involved in mesophyll conductance to CO2 in vivo The Plant Journal 48 427–439 [DOI] [PubMed] [Google Scholar]
- Gillon JS, Yakir D. 2000. Internal conductance to CO2 diffusion and C18OO discrimination in C3 leaves Plant Physiology 123 201–214 [DOI] [PMC free article] [PubMed] [Google Scholar]
- Gorton HL, Herbert SK, Vogelmann TC. 2003. Photoacustic analysis indicates that chloroplast movement does not alter liquid-phase CO2 diffusion in leaves of Alocasia brisbanensis Plant Physiology 132 1529–1539 [DOI] [PMC free article] [PubMed] [Google Scholar]
- Groom PK, Lamont BB, Markey AS. 1997. Influence of leaf type and plant age on leaf structure and sclerophylly in Hakea (Proteaceae) Australian Journal of Botany 45 827–838 [Google Scholar]
- Hanba YT, Kogami H, Terashima I. 2002. The effect of growth irradiance on leaf anatomy and photosynthesis in Acer species differing in light demand Plant, Cell and Environment 25 1021–1030 [Google Scholar]
- Hanba YT, Miyazawa SI, Kogami H, Terashima I. 2001. Effects of leaf age on internal CO2 transfer conductance and photosynthesis in tree species having different types of shoot phenology Australian Journal of Plant Physiology 28 1075–1084 [Google Scholar]
- Hanba YT, Miyazawa SI, Terashima I. 1999. The influence of leaf thickness on the CO2 transfer conductance and leaf stable carbon isotope ratio for some evergreen tree species in Japanese warm-temperate forests Functional Ecology 13 632–639 [Google Scholar]
- Hanba YT, Shibasaka M, Hayashi Y, Hayakawa T, Kasamo K, Terashima I, Katsuhara M. 2004. Overexpression of the barley aquaporin HvPIP2;1 increases internal CO2 conductance and CO2 assimilation in the leaves of transgenic rice plants Plant and Cell Physiology 45 521–529 [DOI] [PubMed] [Google Scholar]
- Harley PC, Loreto F, di Marco G, Sharkey TD. 1992. Theoretical considerations when estimating the mesophyll conductance to CO2 flux by analysis of the response of photosynthesis to CO2 Plant Physiology 98 1429–1436 [DOI] [PMC free article] [PubMed] [Google Scholar]
- Hassiotou F, Ludwig M, Renton M, Veneklaas EJ, Evans JR. 2009. Influence of leaf dry mass per area, CO2, and irradiance on mesophyll conductance in sclerophylls Journal of Experimental Botany 60 2303–2314 [DOI] [PubMed] [Google Scholar]
- Hassiotou F, Renton M, Ludwig M, Evans JR, Veneklaas EJ. 2010. Photosynthesis at an extreme end of the leaf trait spectrum: how does it relate to high leaf dry mass per area and associated structural parameters? Journal of Experimental Botany 61 3015–3028 [DOI] [PMC free article] [PubMed] [Google Scholar]
- Jordan GJ, Dillon RA, Weston PH. 2005. Solar radiation as a factor in evolution scleromorphic leaf anatomy in Proteaceae American Journal of Botany 92 789–796 [DOI] [PubMed] [Google Scholar]
- Kogami H, Hanba YT, Kibe T, Terashima I, Masuzawa T. 2001. CO2 transfer conductance, leaf structure and carbon isotope composition of Polygonum cuspidatum leaves from low and high altitudes Plant, Cell and Environment 24 529–538 [Google Scholar]
- Loreto F, Harley PC, di Marco G, Sharkey TD. 1992. Estimation of mesophyll conductance to CO2 flux by three different methods Plant Physiology 98 1437–1443 [DOI] [PMC free article] [PubMed] [Google Scholar]
- Missner A, Kügler P, Saparov SM, Sommer K, Mathai JC, Zeidel ML, Pohl P. 2008. Carbon dioxide transport through membranes Journal of Biological Chemistry 283 25340–25347 [DOI] [PMC free article] [PubMed] [Google Scholar]
- Miyazawa SI, Terashima I. 2001. Slow development of leaf photosynthesis in an evergreen broad-leaved tree, Castanopsis sieboldii: relationships between leaf anatomical characteristics and photosynthetic rate Plant, Cell and Environment 24 279–291 [Google Scholar]
- Mullin LP, Sillett SC, Koch GW, Tu KP, Antoine ME. 2009. Physiological consequences of height-related morphological variation in Sequoia sempervirens foliage Tree Physiology 29 999–1010 [DOI] [PubMed] [Google Scholar]
- Niinemets Ü, Cescatti A, Rodeghiero M, Tosens T. 2005. Leaf internal diffusion conductance limits photosynthesis more strongly in older leaves of Mediterranean evergreen broad-leaved species Plant, Cell and Environment 28 1552–1566 [Google Scholar]
- Niinemets Ü, Diaz-Espejo A, Flexas J, Galmes J, Warren CR. 2009a. Importance of mesophyll diffusion conductance in estimation of plant photosynthesis in the field Journal of Experimental Botany 60 2271–2282 [DOI] [PubMed] [Google Scholar]
- Niinemets Ü, Díaz-Espejo A, Flexas J, Galmés J, Warren CR. 2009c. Role of mesophyll diffusion conductance in constraining potential photosynthetic productivity in the field Journal of Experimental Botany 60 2249–2270 [DOI] [PubMed] [Google Scholar]
- Niinemets Ü, Flexas J, Peñuelas J. 2011. Evergreens favored by higher responsiveness to increased CO2 Trends in Ecology and Evolution 26 136–142 [DOI] [PubMed] [Google Scholar]
- Niinemets Ü, Reichstein M. 2003a. Controls on the emission of plant volatiles through stomata: differential sensitivity of emission rates to stomatal closure explained Journal of Geophysical Research 108–4208, doi:10.1029/2002JD002620. [Google Scholar]
- Niinemets Ü, Reichstein M. 2003b. Controls on the emission of plant volatiles through stomata: a sensitivity analysis Journal of Geophysical Research-Atmospheres 108–4211, doi:4210.1029/2002JD002626. [Google Scholar]
- Niinemets Ü, Sack L. 2006. Structural determinants of leaf light-harvesting capacity and photosynthetic potentials Progress in Botany 67 385–419 [Google Scholar]
- Niinemets Ü, Wright IJ, Evans JR. 2009b. Leaf mesophyll diffusion conductance in 35 Australian sclerophylls covering a broad range of foliage structural and physiological variation Journal of Experimental Botany 60 2433–2449 [DOI] [PubMed] [Google Scholar]
- Nobel PS. 1991. Physiochemical and environmental plant physiology 4th edn San Diego, California: Academic Press; [Google Scholar]
- Parkhurst DF. 1994. Tansley review no. 65. Diffusion of CO2 and other gases inside leaves The New Phytologist 126 449–479 [DOI] [PubMed] [Google Scholar]
- Piel C, Frak E, Le Roux X, Genty B. 2002. Effect of local irradiance on CO2 transfer conductance of mesophyll in walnut Journal of Experimental Botany 53 2423–2430 [DOI] [PubMed] [Google Scholar]
- Pons TL, Flexas J, von Caemmerer S, Evans JR, Genty B, Ribas-Carbo M, Brugnoli E. 2009. Estimating mesophyll conductance to CO2: methodology, potential errors, and recommendations Journal of Experimental Botany 60 2217–2234 [DOI] [PubMed] [Google Scholar]
- Price D, von Caemmerer S, Evans JR, Yu JW, Lloyd J, Oja V, Kell P, Harrison K, Gallagher A, Badger M. 1994. Specific reduction of chloroplast carbonic anhydrase activity by antisense. RNA in transgenic tobacco plants has a minor effect on photosynthetic CO2 assimilation Planta 193 193–331 [Google Scholar]
- Rodeghiero M, Niinemets Ü, Cescatti A. 2007. Major diffusion leaks of clamp-on leaf cuvettes still unaccounted: how erroneous are the estimates of Farquhar et al. model parameters? Plant, Cell and Environment 30 1006–1022 [DOI] [PubMed] [Google Scholar]
- Slaton MR, Smith WK. 2002. Mesophyll architecture and cell exposure to intercellular air space in alpine, desert, and forest species International Journal of Plant Sciences 163 937–948 [Google Scholar]
- Steppe K, Niinemets Ü, Teskey R.O. 2011. Tree size- and age-related changes in leaf physiology and their influence on carbon gain. In: Meinzer FC, Dawson T, Lachenbruch B, eds. Size- and age-related changes in tree structure and function Berlin: Springer; 235–253 [Google Scholar]
- Syvertsen JP, Lloyd J, McConchie C, Kriedemann PE, Farquhar GD. 1995. On the relationship between leaf anatomy and CO2 diffusion through the mesophyll of hypostomatous leaves Plant, Cell and Environment 18 149–157 [Google Scholar]
- Terashima I, Hanba YT, Tazoe Y, Vyas P, Yano S. 2006. Irradiance and phenotype: comparative eco-development of sun and shade leaves in relation to photosynthetic CO2 diffusion Journal of Experimental Botany 57 343–354 [DOI] [PubMed] [Google Scholar]
- Terashima I, Hanba YT, Tholen D, Niinemets Ü. 2011. Leaf functional anatomy in relation to photosynthesis Plant Physiology 155 108–116 [DOI] [PMC free article] [PubMed] [Google Scholar]
- Terashima I, Ishibashi M, Ono K, Hikosaka K. 1995. Three resistances to CO2 diffusion: leaf-surface water, intercellular spaces and mesophyll cells. In: Mathis P, ed. Photosynthesis: from light to biosphere, Vol. V. Dordrecht: Kluwer Academic Publishers; 537–542 [Google Scholar]
- Terashima I, Miyazawa SI, Hanba YT. 2001. Why are sun leaves thicker than shade leaves? Consideration based on analyses of CO2 diffusion in the leaf Journal of Plant Research 114 93–105 [Google Scholar]
- Tholen D, Zhu X-G. 2011. The mechanistic basis of internal conductance: a theoretical analysis of mesophyll cell photosynthesis and CO2 diffusion Plant Physiology 156 90–105 [DOI] [PMC free article] [PubMed] [Google Scholar]
- Tosens T, Niinemets Ü, Vislap V, Eichelmann H, Castro-Díez P. 2012. Developmental changes in mesophyll diffusion conductance and photosynthetic capacity under different light and water availabilities in Populus tremula: how structure constrains function Plant, Cell and Environment 35 839–856 [DOI] [PubMed] [Google Scholar]
- Ullmann I. 1989. Stomatal conductance and transpiration of Acacia under field conditions: similarities and differences between leaves and phyllodes Trees: Structure and Function 3 45–56 [Google Scholar]
- Umbreit WW, Burris RH, Stauffer JF. 1972. Manometric and biochemical techniques. A manual describing methods applicable to the study of tissue metabolism 5th edn Minneapolis: Burgess Publishing Company; [Google Scholar]
- Warren CR. 2008. Stand aside stomata, another actor deserves centre stage: the forgotten role of the internal conductance to CO2 transfer Journal of Experimental Botany 59 1475–1487 [DOI] [PubMed] [Google Scholar]
- Warren CR, Adams M. 2006. Internal conductance does not scale with photosynthetic capacity: implications for carbon isotope discrimination and the economics of water and nitrogen use in photosynthesis Plant, Cell and Environment 29 192–201 [DOI] [PubMed] [Google Scholar]
- Weisiger R. 1998. Impact of extracellular and intracellular diffusion barriers on transport. In: Bassingthwaighte JB, Goresky CA, Linehan JH, eds.Whole organ approach to cellular metabolism New York: Springer-Verlag; 389–423 [Google Scholar]
- Williams TG, Flanagan LB, Coleman JR. 1996. Photosyntheticgas exchange and discrimination against 13CO2 and C18O16Oin tobacco plants modified by an antisense construct to havelow chloroplastic carbonic anhydrase Plant Physiology 112 319–326 [DOI] [PMC free article] [PubMed] [Google Scholar]
Associated Data
This section collects any data citations, data availability statements, or supplementary materials included in this article.


