

Cryoelectron tomography and subtomogram averaging reveal a high degree of structural asymmetry and polarization in dynein localization in the Chlamydomonas flagella.
Abstract
Understanding the molecular architecture of the flagellum is crucial to elucidate the bending mechanism produced by this complex organelle. The current known structure of the flagellum has not yet been fully correlated with the complex composition and localization of flagellar components. Using cryoelectron tomography and subtomogram averaging while distinguishing each one of the nine outer doublet microtubules, we systematically collected and reconstructed the three-dimensional structures in different regions of the Chlamydomonas flagellum. We visualized the radial and longitudinal differences in the flagellum. One doublet showed a distinct structure, whereas the other eight were similar but not identical to each other. In the proximal region, some dyneins were missing or replaced by minor dyneins, and outer–inner arm dynein links were variable among different microtubule doublets. These findings shed light on the intricate organization of Chlamydomonas flagella, provide clues to the mechanism that produces asymmetric flagellar beating, and pose a new challenge for the functional study of the flagella.
Introduction
Flagella and cilia are complex organelles composed of >300 proteins and are essential for motility and sensory functions (Dutcher, 1995; Pazour et al., 2005). Motile cilia and flagella in most organisms have the canonical nine microtubule doublets (MTDs) plus two central singlets (9 + 2) architecture (Fig. 1, A and B). Anchored periodically on MTDs are inner dynein arms (IDAs) and outer dynein arms (ODAs), which consist of dyneins a–g and a complex containing the α, β, and γ heavy chains, respectively. MTD is connected with the central pair through the radial spoke (RS). Dynein arms drive the sliding activities between adjacent MTDs, which are then converted into the bending motion of the flagellum. The bending activity is likely to be regulated by many means that involve the central pair and RS (Porter and Sale, 2000), the intermediate chain (IC)/light chain (LC) of inner arm dynein f (dynein I1; Porter and Sale, 2000), and the dynein regulatory complex (DRC; Piperno et al., 1992), a structure possibly identical with the interdoublet (nexin) link (Summers and Gibbons, 1971; Heuser et al., 2009). Though sharing these common structures, flagella generate a variety of bending patterns. In Chlamydomonas flagella, waveform is asymmetric at low calcium concentrations, whereas the waveform turns symmetric at high calcium concentrations (Hyams and Borisy, 1978; Bessen et al., 1980). Defects in flagellar assembly can lead to many diseases, termed ciliopathies, such as hydrocephalus, polycystic kidney disease, primary ciliary dyskinesia, and infertility (Fliegauf et al., 2007). Despite a long history of research, many questions regarding the molecular mechanism of the flagellar function are still to be answered, for example, how the bending motion is initiated at the basal part of the flagellum or how the flagellum produces both symmetric and asymmetric motions.
Figure 1.

Division of the complete Chlamydomonas axoneme. (A) The partitions of the axoneme into four regions: PEA, proximal, central, and distal. (B) Cartoons and representative 96-nm-thick cross-sections of each region from our tomograms, observed from base to tip of the axoneme. The markers of different regions are circumferential interdoublet linkers (red) in the PEA region, the 1–2 bridge (yellow) in the proximal region, and the beaks in MTD1, 5, and 6 (blue) in the central region. No beak was found in the distal region. As a result of the missing wedge effect in the raw tomogram, only three circumferential linkers roughly parallel to the optical axis are seen. Examination of all our data indicates that the circumferential linkers exist between every pair of MTDs in the PEA region, and they are absent from other regions. (C) Single tomographic slices showing the longitudinal sections of flagella in the central region (top), the PEA region (bottom left), and the proximal region (bottom right). The red and yellow arrows indicate a short span of the linkers in the PEA region and the 1–2 bridge, respectively. Bars, 100 nm.
Structural studies of the axoneme have been contributing significantly to tackling those questions. Recent advances in cryoelectron tomography (cryo-ET) have allowed researchers to obtain the structure of the 96-nm repeating unit of the axoneme at intermediate resolution (∼35 Å; Nicastro et al., 2006; Bui et al., 2008, 2009; Heuser et al., 2009; Movassagh et al., 2010). However, those reported structures have not yet fully reflected the complexity observed by biochemical analysis. For instance, according to Chlamydomonas genomics (Merchant et al., 2007), more dyneins were predicted in the flagella than observed in the 96-nm structural unit within the axoneme. In Chlamydomonas, 16 dynein heavy chain (DHC) genes have been predicted and classified into five groups: one cytoplasmic (DHC1b), three outer-arm (ODA α, β, and γ), one double-headed inner-arm (fα, fβ), and nine single-headed inner-arm DHCs (a–e, g, DHC3, DHC4, and DHC11) and an orphan or novel DHC (DHC12) that does not fall clearly into either cytoplasmic or axonemal dynein categories (Wickstead and Gull, 2007; Yagi et al., 2009). 11 axonemal DHCs (a–g, α, β, and γ) can be purified biochemically (Kagami and Kamiya, 1992) and localized in the 96-nm unit by EM (Mastronarde et al., 1992; Gardner et al., 1994; Yagi et al., 2005; Ishikawa et al., 2007; Bui et al., 2008). However, the exact localization of some inner-arm dyneins has not yet been achieved because the variety of available mutants lacking specific dynein is limited; more specifically, the distinction of loci has yet to be made between dynein a and d and between dynein b and g. In addition, the heavy chains of three single-headed dyneins—DHC3, DHC4, and DHC11—as well as the orphan DHC12 (unpublished data) are present in small amounts and are therefore termed minor dyneins (MDs). The loci of these dyneins also need to be determined. A systematic characterization of the structure of the whole axoneme is necessary to pinpoint the location of all the axonemal dyneins and, as a result, obtain insight into their integrated functions.
So far, all of the 3D reconstructions addressing molecular arrangement have assumed identical 96-nm periodic units along the entire axoneme and over the nine (or eight) MTDs; this assumption must be corrected. We previously discovered a radial asymmetry in the arrangement of IDAs and interdoublet linkages in the central part of the Chlamydomonas axoneme (Bui et al., 2009). Seven MTDs have the same dynein architecture, which we named the common IDA architecture, whereas two MTDs show different structures. The radial asymmetry may well underlie the asymmetric planar waveform of Chlamydomonas flagella. With the detection of such a radial asymmetry, an obvious next question is whether there are any differences along the flagellum. A few studies have dealt with the dynein composition specific to the proximal region (Piperno and Ramanis, 1991; Yagi et al., 2009). A minor DHC, DHC11, was localized in an ∼2-µm proximal region of flagella, whereas dynein b was localized outside this region (Yagi et al., 2009). In addition, the kinetics of the appearance of DHC3 and DHC4 during flagellar regeneration also suggested their proximal localization (Yagi et al., 2009). Collectively, in the proximal region, MDs may replace major dyneins or may be added as extra dyneins. To determine this special dynein distribution in more detail, structural studies throughout the flagella at molecular resolution is necessary.
In this study, we first tried to determine the arrangement of dyneins in the 96-nm periodic unit by analyzing Chlamydomonas wild-type and mutant axonemes by cryo-ET and subtomogram averaging. We used a novel inner-arm–deficient mutant, ida10, which permitted us to distinguish the loci of dynein a and d as well as those of dynein b and g. Thus, for the first time, the loci for all the major inner-arm dyneins have been determined. Then, we systematically acquired tilt series in different regions of the axoneme while distinguishing each one of the nine outer doublet microtubules. This resulted in the finding of a structural asymmetry and polarization in dynein localization. These novel features should be important for the studies on how the flagellar waveform is determined.
Results
Cryo-ET localizes eight inner-arm DHCs in the central region
Based on the structural indicators in the cross-section (Fig. 1 [A and B] and Video 1), we divided our tomographic data of axonemes into four consecutive regions: proximal end of the axoneme (PEA), proximal, central, and distal regions. The boundaries between these regions are apparently not sharply defined. The PEA region corresponds to an ∼300-nm region at the very proximal end, which is connected to the transition region next to the basal body (Ringo, 1967). It shows no sight of the 1–2 bridge, a bridge between MTD1 and MTD2 associated with the proximal region (Fig. 1 B, yellow arrowhead) but has circumferential interdoublet linkers (detailed in the next section; Fig. 1 C), also referred to as rodlike peripheral links in Hoops and Witman (1983) (Fig. 2). The proximal region extends for ∼2 µm and has the 1–2 bridge and the beaks in the B-tubules of MTD1, 5, and 6 (Hoops and Witman, 1983; Bui et al., 2009). The central region, spanning ∼7 µm, lacks the 1–2 bridge. The remaining ∼3-µm region near the distal end of the flagellum, termed the distal region, lacks the aforementioned beaks. At the very end of the distal region, there is a short tip region with only A-tubule present and in contact with the flagellar membrane (Dentler and Rosenbaum, 1977). The structure of the tip end was not studied here, as it should be more meaningful to study it with intact membrane.
Figure 2.

Dynein arrangement within the 96-nm unit in the distal region. (A) Comparison of the MTD2-8+ structures in wild type (WT) and ida10 (which has significantly reduced amounts of dyneins b, c, d, and e). In wild-type MTD2-8+, a dynein density labeled with two names (such as a/d) is the one whose identity has been previously unsettled between the two species. The black arrows in ida10 MTD2-8+ indicate the missing densities that were determined to be those of dyneins b and d in this study. Bar, 16 nm. (B) Model of the common IDA architecture in the 96-nm unit showing the complete assignment of all major dynein isoforms. The coloring scheme is as follows: red, IDA; light blue, ODA; turquoise, RS; green, DRC; yellow, dynein f IC/LC. The same coloring scheme is used throughout all figures and supplemental figures unless mentioned otherwise. Surface renderings are always positioned with the proximal part on the left and the distal part on the right unless mentioned otherwise.
We reconstructed the 3D structure of each region and each doublet using subtomogram averaging from cryoelectron tomograms. We found no difference between the central and distal regions in neither the wild-type nor the mutant axonemes analyzed in this study, except for the presence or absence of the beaks. Therefore, what we refer to as the distal region in the following text includes the central region. We used the minus sign (−) and plus sign (+) after the MTD number to indicate the proximal (which corresponds to the minus end) and central/distal (the plus end) regions, respectively. For example, MTD3+ means the central/distal part of MTD number 3. An MTD number without a sign means that the observed feature is uniform along the particular MTD.
We first attempted to localize dyneins in the 96-nm unit in the central/distal region, which span almost 80% of the flagellum. Dyneins c, e, and f were localized in our previous study (Bui et al., 2008). However, there have been ambiguities between dyneins a and d and between dyneins b and g because no mutants have been available that lack one of the pairs. Using ida10 flagella, which have significantly reduced amounts of dyneins b, c, d, and e (Yamamoto et al., 2010), we were able to assign dyneins a, b, d, and g in the averaged map of the central/distal region (Fig. 2 A). This has completed the assignment of the common IDA architecture (Fig. 2 B).
There are variations in dynein structures among MTDs and along the flagellum
Based on our division of flagellar regions, we compared the dynein arrangements in different MTDs and in different regions. The averaged map of MTD2-9 indicates that the 96-nm unit structure is mostly preserved in the PEA region except for the absence of dyneins f and b and a significant reduction of ODA (Fig. 3 A). In this region, adjacent MTDs are linked by the circumferential interdoublet linkers (Fig. 1 C, red arrows; Ringo, 1967; Hoops and Witman, 1983). As a result of the low number of 96-nm repeating units present (two to three per MTD), dynein isoforms and the radial asymmetry were not determined in this region.
Figure 3.

Dynein structure and arrangement in the whole axoneme. (A) Dynein arrangement in the PEA region. Surface rendering of averaged map of MTD2-9 shows that dyneins b and f (black arrows) are missing. WT, wild type. (B) Comparison between the proximal and distal regions in the MTD groups 1, 2–8, and 9. Minus (−) and plus (+) signs denote the proximal and central/distal regions, respectively. The black arrows indicate the missing dynein b in MTD2-8−, MTD9−, and MTD9+. The orange arrowhead indicates the position of the 1–2 bridge between MTD1− and MTD2−. The blue arrow points to the bulb density that differs between MTD1− and MTD1+ (referred to as MD2 in Fig. 4). Structures shown in orange are the 1–2 bridges, and those in dark green are IDL3, an interdoublet linker between MTD1 and 2 (Bui et al., 2009). (C) View of the section cut perpendicular to the 1–2 bridge of MTD1+ and MTD1−. The black arrowhead shows the dynein f IC/LC in MTD1+, which is missing in MTD1−. (D) Close-up views of a region proximal to RS1 (black frame in B) of MTD1− (left), MTD1+ (middle), and the overlapped image (right). The blue mesh in the right image represents the IDA density of MTD1+ corresponding to the region in red in the middle image. The blue arrowheads point to the tails of MD2 and dynein a. The white arrowheads indicate the bulb density on the A-tubule that is in contact with dynein fα and MD2. Bars, 16 nm.
Next, we focused on the structural differences among MTDs in the proximal and distal regions (Videos 2–4). We previously observed major differences in dynein distribution among MTD groups 1, 2–8, and 9 in the distal region (Bui et al., 2009). The dynein structures in MTD2-8−, MTD9−, and MTD9+ are similar, all lacking dynein b (Fig. 3 B, black arrows; we have already reported that MTD9+ lacks dynein b; Bui et al., 2009). MTD1− has a structure distinctively different from other MTDs and also from MTD1+ (Fig. 3 B). The most prominent difference is the presence of the 1–2 bridge (Fig. 3 B, orange arrowhead), as reported by Hoops and Witman (1983). MTD1− lacks dynein c (as in MTD1+; reported in Bui et al. [2009]) and the DHC and IC/LC of dynein f (blue arrow in Fig. 3 B). The 1–2 bridge and the IC/LC of dynein f would have a spatial conflict if they existed together (Fig. 3 C). The bulb at the position of dynein a in MTD1− has a tail similar to that of dynein a (blue arrowheads in Fig. 3 D). However, the head of this bulb is bigger than that of dynein a and somehow elongated like dynein fα. This head is shifted proximally compared with the dynein a head (Fig. 3 D, right image). We interpret this structure as an MD candidate (MD2), as it has a ring-shaped head, characteristic of a DHC (discussed later; Fig. S2).
The proximal region contains a distinct set of dyneins
Having observed the differentiation in dynein arrangement, we wanted to pinpoint the position of respective dyneins in the proximal region, including those of MDs. To probe the presence of MDs in various dynein-deficient mutants, we performed Western blot analysis on the ida4, ida5, ida10, and pf3 axonemes (analyses of the ida4 and ida5 axonemes have been already reported by Yagi et al. [2009]). The results showed that in the ida10 axoneme, DHC3 and DHC4 are almost completely missing, whereas DHC11 is reduced but still detectable (Fig. 4 A). The pf3 axoneme shows a slight reduction in DHC4 and DHC11 and a significant reduction in DHC3.
Figure 4.

Localization of MDs. (A) Western blot analysis of wild-type (wt), ida4, ida5, ida10, and pf3 axonemes using antibodies to DHC3, DHC4, DHC11, and IC140 (an IC of dynein f, used as a positive control). The molecular masses of DHC3, DHC4, and DHC11 are expected values, as they migrate significantly more slowly than the 250-kD molecular mass marker, which is not shown. (B) The 96-nm surface renderings of MTD2-8+ and MTD1+ of wild type and MTD2-9− and MTD1− of wild type, ida4, ida5, ida10, ida1, and pf3. There are three MD densities that deviated from the common inner-arm dynein structures, MD1–3, indicated with arrowheads in different colors. They can be the candidates of the MDs. A filled arrowhead indicates the presence of dynein, whereas an open arrowhead with the same border color indicates the absence of dynein from the respective position. Bar, 16 nm.
Based on the Western blot results (Fig. 4 A and Table 1), we compared the structure of the flagellar proximal region of wild type, ida4 (lacking dyneins a, c, d, and DHC11), ida5 (lacking dyneins a, c, d, e, and DHC11 and most of DHC3 and DHC4), ida10 (lacking DHC3 and DHC4 and partially lacking DHC11 and the DHCs of dynein b, c, d, and e), and pf3 (lacking various DRC subunits and dynein e and partially lacking DHC3 and DHC11; Figs. 4 B and 5). In addition, we analyzed the structure of the ida1 axoneme, which lacks dynein f.
Table 1.
Characteristics of mutants in this study
| Strain | Missing major dyneins and DRC | Missing MDsa | Biochemically detected MDs | MD candidates present in the axoneme | No. of tomograms (PEA/proximal/central/distal) |
| Wild type | DHC3, DHC4, DHC11 | MD1–3 | 8/40/29/17 | ||
| ida4 | a, c, d b | DHC11a | DHC3, DHC4a | MD1, MD2 | 1/7/5/1 |
| ida5 | a, c, d, eb | DHC11a | DHC3 and DHC4 significantly reduceda | MD2 | 0/5/5/1 |
| pf3 | e, DRC (partial)c | DHC3 significantly reduced, DHC4 and DHC11 reduced | MD1–3 | 1/6/4/0 | |
| ida10 | b, c, d, e reducedd | DHC3, DHC4 | DHC11 reduced | MD2, MD3 | 0/12/6/2 |
| ida1 | f e | DHC3, DHC4, DHC11 | MD1–3 | 1/10/8/0 |
Determined in Yagi et al. (2009) and this study.
Figure 5.

Sections showing the dyneins in wild-type and mutant axonemes. (A–C) Illustration of the cross-section plane (transparent dissecting plane; A) in B and C in relation to the isosurface structure. Cross-sections of density maps of wild type (WT) and mutants in the proximal (B) and distal (C) regions in wild type, ida5, ida4, ida10, ida1, and pf3 are shown. The color of each arrowhead is the same as in Fig. 4. Bars, 32 nm.
There are several bulb densities that have shapes different from those of major species of dyneins in wild-type axonemes. These exceptional densities could be those of MDs. The first candidate, referred to as MD1, is the bulb density between RS1 and RS2 in MTD1, which we previously suggested to be an MD (Bui et al., 2009). The shape of this density appears similar between MTD1− and MTD1+ (black arrowheads in Figs. 4 B and 5). Because its tail originates from the same position as the tail of dynein e (Fig. 4 B, wild-type image), MD1 could be an MD replacing dynein e in MTD1. MD1 is significantly reduced or missing in ida5 and ida10 (open black arrowheads in Figs. 4 B and 5).
The second candidate, MD2, is the density at the dynein a position in MTD1− (green arrowheads in Figs. 4 B and 5). MD2 exists in all the mutants analyzed in this study, including ida4 and ida5, which lack dynein a. Although MD2 looks similar to the DHC of f, the dynein f–deficient axoneme of ida1 retains MD2 (Figs. 4 B and 5).
The third candidate, MD3, is a density that appears at the dynein d position in the proximal region (blue arrowheads in Figs. 4 B and 5). In the proximal region of the ida10 axoneme, a bulge is present at the dynein d position, as in the wild-type axoneme (blue arrowheads in Figs. 4 B and 5), despite the fact that dynein d is significantly reduced in ida10, as estimated by SDS-PAGE and Western blot analyses (Fig. 2 A; Yamamoto et al., 2010). Thus, this proximal density may represent some MD replacing dynein d. However, it is also possible that it originates from the small amount of dynein d remaining in the ida10 axoneme.
In addition to these candidates for MD species, densities assigned to major dyneins may well be the sites for some MDs. Immunological studies using a newly raised antibody for dynein e DHC revealed that the content of this DHC in wild-type axonemes is ∼50% lower in the proximal region than in the central and distal regions; this was confirmed by both immunofluorescence microscopy (Fig. 6) and immunoblotting analyses of short and long flagella (Fig. S3 B). However, in our cryo-ET images, the structure of the e position in the proximal region is similar to that in the distal region. This observation suggests that some of the dynein e in the proximal region of wild-type axonemes is replaced by MDs.
Figure 6.

Immunofluorescence localization of inner-arm dynein e. (A) Immunoblot analysis of wild-type (wt), ida4, ida5, ida10, and pf3 axonemes using antibodies against dynein e heavy chains and IC140 (positive control). The molecular mass of dynein e is the expected value, as dynein e migrates significantly more slowly than the 250-kD molecular mass marker, which is not shown. The reduction of dynein e in ida10 is consistent with the previous result (Yamamoto et al., 2010). (B) Indirect immunofluorescence observation of inner-arm dynein e (left; green signal) and α-tubulin (middle; purple signal) in wild-type and ida5 cells. The right images show the merged images. Note that almost no dynein e signal was detected in ida5 axonemes. The dynein e signals in the proximal region of wild-type axonemes are significantly reduced compared with the distal regions. The boundaries are indicated with white arrowheads. Bar, 10 µm. (C) Magnified images of part of a wild-type cell and the densitometric evaluation of the signal intensities of dynein e and acetylated tubulin along the flagellum. The nucleoflagellar apparatus (see Materials and methods) was analyzed. The entire length of flagella is shown by double-headed arrows. Bar, 5 µm.
Each one of the aforementioned MD candidates has a ring-shaped head typical of dynein (Fig. S2). Although available evidence has not allowed us to clearly determine specific loci of individual MDs, it is quite likely that MDs replace major dyneins in the proximal region and in some MTDs (see Discussion for more details; Fig. 7). The interpretation of MD candidates is summarized in Tables 2 and 3.
Figure 7.

Possible assignment of dynein locations. (A) Assignment of the potential location of the three MDs (DHC3, DHC4, and DHC11) in the proximal region. The arrowheads indicate possible locations: possibly, DHC3 and DHC4 are at the yellow arrowhead, and DHC11 is at the gray arrowheads. Densities at the other arrowheads are not assigned. DHC3 may be present also on MTD1+. Bar, 16 nm. (B) The proposed distribution of all the major dyneins along the flagella. The colors of the bar indicating possible localization corresponds to the MD or unknown density pointed by the same arrowhead colors in A. The short bar with the minus sign indicates the proximal region of the MTD, whereas the long bar with the plus sign indicates the central and distal region.
Table 2.
List of unassigned densities
| MD candidate | MTD | Position | Volume | Estimated amount with respect to DHC1 |
| nm3 | % | |||
| MD1 | MTD1 | dynein e | 1,521 | 11.3 |
| MD2 | MTD1− | dynein a | 1,835 | 1.9 |
| MD3 | MTD1–9− | dynein d | 1,050 | 17 |
Volume is calculated from dynein head only. The volume of dynein c head was 955 nm3. The estimated amount is under the assumption that the proximal region is 2 µm. The length of the axoneme is 12 µm. DHC1 (dynein fβ) lacked only in MTD1−.
Table 3.
Summary of main features observed in the proximal and distal regions of Chlamydomonas axoneme in this study
| MTD | Dynein (full components: f, a, b, c, e, g, and d) | OIDL | ||
| Proximal | Distal | Proximal | Distal | |
| MTD1 | _, MD2 (a), _, _, MD1 (e), g, MD3 (d) | f, a, _, _, MD1(e), g, d | OIDL1, OIDL3a | OIDL1, OIDL3a |
| MTD2 | f, a, _, c, e?, g, MD3 (d) | f, a, b, c, e, g, d | OIDL1, OIDL3a, OIDL4 | OIDL1, OIDL3a |
| MTD3 | f, a, _, c, e?, g, MD3 (d) | f, a, b, c, e, g, d | OIDL1, OIDL3a | OIDL1, OIDL3a |
| MTD4 | f, a, _, c, e?, g, MD3 (d) | f, a, b, c, e, g, d | OIDL1, OIDL3a | OIDL1, OIDL3a |
| MTD5 | f, a, _, c, e?, g, MD3 (d) | f, a, b, c, e, g, d | OIDL1, OIDL3a | OIDL1, OIDL3a |
| MTD6 | f, a, _, c, e?, g, MD3 (d) | f, a, b, c, e, g, d | OIDL1, OIDL2, OIDL3a, OIDL3b | OIDL1, OIDL3a |
| MTD7 | f, a, _, c, e?, g, MD3 (d) | f, a, b, c, e, g, d | OIDL1, OIDL2, OIDL3a, OIDL3b, OIDL4 | OIDL1, OIDL3a |
| MTD8 | f, a, _, c, e?, g, MD3 (d) | f, a, b, c, e, g, d | OIDL1, OIDL2, OIDL3a, OIDL3b | OIDL1, OIDL3a |
| MTD9 | f, a, _, c, e?, g, MD3 (d) | f, a, _, c, e, g, d | OIDL1, OIDL3a | OIDL1, OIDL3a |
Inner-arm dyneins in the distal region of the axoneme are arranged from proximal to distal location within the 96-nm repeating unit. Underscores indicate empty loci. Question marks indicate that dynein e might be replaced by an MD in the proximal region.
The connections between ODA and IDA are asymmetrically distributed
Our analysis showed no asymmetry in the ODA structure itself but revealed an asymmetry in the outer–inner dynein link (OIDL). For a better description of the OIDL, we numbered the ODA-1–4 from proximal to distal direction in the 96-nm unit, with ODA-1 connecting to dynein f IC/LC (Fig. 8 A). We found five OIDLs in total. OIDL1 (linking the dynein f IC/LC and the tail of ODA-1) and OIDL3a (linking the DRC and the tail of ODA-3), which have been previously reported (Nicastro et al., 2006; Bui et al., 2008), exist in all 96-nm repeating units, except where dynein f is missing (MTD1−). The three other newly found OIDLs are (1) OIDL2 connecting the distal part of the dynein f IC/LC to the tail and the γ DHC of ODA-2, (2) OIDL3b projecting from the proximal part of the DRC toward the γ DHC of ODA-3, and (3) OIDL4 bridging a protrusion distal to the DRC and the tail of ODA-4 (Figs. 8 A and S4). OIDL2 and OIDL3b are present only in MTD6-8− (Fig. 8 B), whereas OIDL4 is very thin and found only in MTD2− and MTD7− (Fig. S4).
Figure 8.

Asymmetry and polar differences in the number of the OID linkers. (A) Surface rendering of MTD6-8− showing all the OIDLs (OIDL1, OIDL2, OIDL3a and b, and OIDL4) found between ODAs and IDAs in the axoneme. ODAs are numbered 1–4 from proximal to distal direction. ODA-1 is the one with the tail contacting to the dynein f IC/LC. DP is a density called the distal protrusion. OIDL4 is visible in not all MTD6-8−; it is present in specific MTDs such as MTD2− and MTD7− (Fig. S4). (B) Highlights of the differences between OIDLs in MTD2-9+, MTD2-5,9− and MTD6-8−. From the comparison, OIDL2 and OIDL3b (colored in purple) are extra density protruding from the dynein f IC/LC and the DRC, respectively. The density of OIDL2 and OIDL3b was determined from the difference map between MTD6-8− and MTD2-4−. The proximal end of the doublet is toward the lower part of the image. Bar, 16 nm.
At a higher magnification, OIDL2 is a density protruding from the distal end of dynein f IC/LC, whereas OIDL3b is a bulb density protruding directly from the DRC toward the γ DHC of ODA-3 (Fig. 8 B, purple). Thus, OIDL2 can be an additional component of dynein f IC/LC in MTD6-8−. Likewise, OIDL3b can be an additional component of DRC in MTD6-8−.
The observed OIDL pattern roughly divides MTDs into two groups. One group (MTD6-8−) has at least three OIDLs in the proximal region, whereas the other group (MTD2-5− and 9−) has at least two OIDLs (Table 3).
Discussion
Chlamydomonas axoneme has a complex dynein arrangement
We have completed the assignment of seven major dynein isoforms in the common IDA architecture (MTD2-8+) of the Chlamydomonas axoneme. As stated in the introduction, our previous studies had left an ambiguity regarding the distinction in loci between dyneins a and d as well as between dyneins b and g. The use of the ida10 axoneme, which has significantly reduced amounts of dyneins b, c, d, and e, enabled us to unambiguously determine their respective loci. Gardner et al. (1994) showed by biochemical analyses a decrease in the dynein b content in the pf2 axonemes, which lack certain DRC components. Their result might seem to indicate that dynein b is located close to the DRC; however, our Western blot analysis of the pf2 and pf3 axonemes did not detect any significant decrease in the amount of dynein b (Fig. S5). The reason for the discrepancies is unknown, but we speculate that the short length of pf2 and pf3 flagella might have affected the analyses, as dynein b is absent in the proximal region, as shown in this study. Heuser et al. (2009) reported that the axoneme of pf3 lacks IDAs in the position of dynein e and g (IAD4 and IAD5 in their terminology). In our reconstruction of the pf3 axoneme, dynein e is also missing, but dynein g is present (Fig. 5).
ODA–IDA connections have been shown for the first time to exhibit asymmetry and polarity. In MTD6-8−, ODA–IDA association is tighter than in other MTDs because at least three of the four ODAs in the 96-nm unit are connected to dynein f IC/LC or the DRC (Fig. 8 B). This indicates that the coordination between ODA and IDA activities could be regulated differently in a subset of MTDs. Interestingly, the heads of the γ DHCs in ODA-2 and ODA-3 are in direct contact with protrusions from the dynein f IC/LC (OIDL2) and the DRC (OIDL3b; Fig. 8 B). From these images, we are inclined to speculate that the ODA γ DHC might function as a regulator that senses mechanical strain. A mechanosensing role of the γ DHC has also been proposed by Patel-King and King (2009) based on the observation of the contact between the γ DHC and the A-tubule. Similarly, dynein fα might also act as a mechanical strain sensor by contacting with a density blob on the A-tubule surface (Fig. 3 D, white arrowheads).
The arrangement of the IDAs in MTD2-8+ is similar to that in the averaged structure of Tetrahymena cilia, sea urchin sperm flagella (Pigino et al., 2012), and mouse respiratory cilia (Ueno et al., 2012), with some minor deviations. Therefore, a common IDA architecture might be shared among species. On the other hand, the radial asymmetries of IDA in the nine MTDs in Chlamydomonas flagella (Bui et al., 2009; this study) and mouse respiratory cilia (Ueno et al., 2012) indicate that each species might tailor their IDAs in a distinct manner corresponding to their specific functions.
MDs are possibly localized to specific loci in the axoneme
In addition to determining the arrangement of major dyneins, we have proposed the candidate loci for MDs (Table 2), although we have been unable to determine the specific relationship between these loci and particular DHC species.
In our Western blot, DHC3 and DHC4 are equally significantly reduced in the ida5 and ida10 axonemes (Fig. 4 A). Therefore, it is not possible to distinguish between the DHC3 and DHC4 loci from the results of Western blotting and cryo-ET. Western blot analyses of short and long flagella have suggested that both DHC3 and DHC4 localize proximally in wild-type axonemes (Fig. S3; Yagi et al., 2009). On the other hand, immunofluorescence microscope observations indicated that the amount of dynein e in wild-type axonemes was significantly reduced in the proximal region (Fig. 6), whereas our cryo-ET density maps did not show any reduction in the dynein e density in the proximal region of the wild-type, ida1, or ida4 axonemes (Figs. 4 B and 5). Therefore, DHC3, DHC4, or both of them may well be replacing dynein e in the proximal region of these axonemes (Fig. 7).
The relationship between MD1 and minor DHCs as well as between MD2 and minor DHCs is unclear. MD1 occurs all along the length of the MTD1. As only one species of MD, DHC12, is known to localize along the entire axoneme length (unpublished data), this DHC might be MD1. However, our preliminary observations indicated that DHC12, but not MD1, is greatly diminished in ida4. Therefore, the identity of MD1 as well as the localization of DHC12 must await further studies.
MD2 occurs at the dynein a site on MTD1− and is present even in mutants that lack dynein a as a result of the loss of its subunit p28 or actin (ida4 and ida5). It clearly exists in ida5, which has significantly reduced amounts of DHC3, DHC4, and DHC11. However, as the amount of the dynein expected to localize to the MD2 site should be very small (∼1/50 of major inner-arm dyneins), minor inner-arm dynein species that are detected only faintly in Western blot in ida4 or ida5 can be MD2.
MD3 is the density that localizes at the dynein d position in the proximal region of all MTDs. It is absent in ida4 and ida5 and reduced in ida10 (Fig. 3 B). On the other hand, DHC11 has been shown to be present only in the proximal region of the wild-type flagellum. It is absent in ida4 and ida5 and reduced in ida10 (Fig. 4 A; Yagi et al., 2009). As DHC11 and MD3 show the same distribution pattern among mutants, DHC11 might well be MD3. However, an analysis of dynein composition in short and long axonemes using ion-exchange chromatography showed that the amount of dynein d did not decrease in short flagella (unpublished data). Also, p38 and p44, the LCs of dynein d, have been shown to localize all along the length of the axoneme (Yamamoto et al., 2006, 2008). These observations suggest that dynein d is present from base to tip of the axoneme. Therefore, the postulated dynein d replacement by DHC11, if any, must occur only partially. We cannot exclude the possibility that part or all of the DHC11 molecules are replacing some other major dyneins in the proximal region of axoneme.
In addition, there are a few peculiar dynein distribution patterns that we still cannot explain. In the axoneme of ida5, the bulb density at the dynein g position is significantly reduced in the MTD1 (Figs. 4 B and 5) and MTD5 (not depicted) along the whole length. This mutant expresses novel actin-like protein (Kato-Minoura et al., 1998) instead of actin. Inner-arm dynein g, whose actin subunit is replaced by novel actin-like protein, may be unable to bind to these two MTDs.
It is somewhat puzzling that the proximal region of MTD2-8 in the axoneme of ida10 lacks dynein a (Fig. 4 B). This is because the reduction of dynein a in the ida10 axoneme is only slight, although ida10 is deficient in cytoplasmic preassembly of dynein (Yamamoto et al., 2010). It may be that this dynein is produced in a slightly reduced amount or in a slightly different structure so that it cannot bind to the proximal portion where dynein association sites are somewhat different from those in the distal region.
Finally, an unexpected finding was that dynein b is missing in the proximal region (Yagi et al., 2009) without being replaced by another dynein. This is in contrast with dyneins d and e, which we suggest are replaced by MDs at least partially. This specialty of dynein b might suggest its specific function. The distribution of all dyneins with possible MD replacement is summarized in Fig. 7 B.
The presence of many DHCs is not unique to Chlamydomonas, as there are many dynein genes found by genome analysis in other species such as in Tetrahymena (25 axonemal dyneins; Wilkes et al., 2008) and sea urchin sperm (15 axonemal dyneins; Morris et al., 2006). Thus, we might expect heterogeneity in dynein composition along the length of cilia and flagella in other species as well. In human respiratory cilia, ODA is shown to be different in composition between the proximal and distal regions. DNAH5, an orthologue of the Chlamydomonas ODA γ heavy chain, is present along the whole cilium, whereas DNAH9, an orthologue of the Chlamydomonas ODA β heavy chain, is found only in the distal two thirds of the cilium (Fliegauf et al., 2005).
Proximal region of axoneme is highly differentiated from the main region
As is clear from the differentiation of dynein species, the proximal region of the axoneme displays more extensive structural heterogeneities among MTDs. This implies that the proximal region plays an important role distinct from that of the other axonemal regions: for example, a role for the bending initiation and waveform formation. The distal region of the flagellum might just follow the lead of the proximal region.
The circumferential differentiation of the OIDLs divides the MTDs into several groups: two sides that undergo extensive shearing (i.e., MTD2-4 and MTD6-8) and those that do not undergo extensive shearing (i.e., MTD5 and MTD9–1). MTD1 has structures clearly distinct from other MTDs, whereas MTD5 and MTD9 have connections to the DRC slightly different from other MTD groups (unpublished data). Compared with MTD2-4, MTD6-8 displays greater structural differences between the proximal and distal regions in the number of OIDL (Fig. 8 B). Therefore, there should be a functional difference between these two groups of MTDs (Fig. 9). In an organism like Chlamydomonas displaying asymmetric flagellar waveforms, sliding movements in MTD2-4 produce the force for the power stroke (or the principal bend; the bend that produces the largest force), whereas sliding in MTD6-8 is responsible for the recovery stroke (reverse bend), which requires less force than the power stroke. The asymmetry in the OIDLs among MTDs may be related to such asymmetry in waveform or force production properties.
Figure 9.
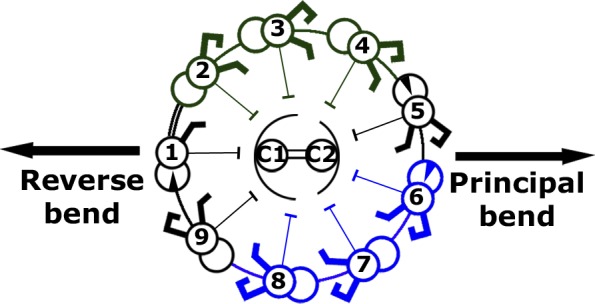
Summary of the observed structural polarization and asymmetry in the axoneme and their possible importance for bending motion. The division of the axoneme into MTD groups based on the OIDLs structures. The group of MTD2–3–4 (dark green) has almost the same OIDLs in the proximal and central regions, whereas the group of MTD6–7–8 (blue) has extra OIDLs and density in the proximal region than in central regions.
Finally, there must be a mechanism that determines the complex arrangement of dyneins in the axoneme. As we observed longitudinal differences in the arrangement of microtubule inside protein 1a (MIP1a; Pigino et al., 2012), which is in the vicinity of dynein tails (Fig. 4; Pigino et al., 2012), we speculate that MIP1a provides the platform for the assembly of IDA and other flagellar components and functions as the molecular ruler to partition the proximal, central, and distal regions.
Conclusion
We showed in this study intricate radial and longitudinal variations in the Chlamydomonas axoneme. Which feature is universally conserved, and which is specific to Chlamydomonas? These questions can be answered by systematic structural studies of axonemes in other organisms. We already know that some of the features observed, such as the 1–2 bridge, are specific to Chlamydomonas. On the other hand, other flagella have their own unique features such as the 5–6 bridge in the flagella of sea urchin sperm or the paraflagellar rod in Trypanosome. It seems clear that the eukaryotic flagellum has a highly elaborate structure that can be differentiated longitudinally and circumferentially.
Our present structural study poses an exciting challenge for future studies of flagellar function. New assays must be developed to explore the function of a component present only in specific regions of a subset of MTDs. Elucidation of the biophysical properties of MDs will provide important clues to the functional significance of these dyneins and the axonemal proximal regions.
Materials and methods
Cell culture and flagella purification
Chlamydomonas reinhardtii wild-type 137c and mutants were cultured using tris-acetate-phosphate medium (Gorman and Levine, 1965). Deflagellation was induced by the dibucaine method of Witman (1986). The separated flagella were centrifuged at 5,200 g for 40 min at 4°C. The pellet was suspended in HMDEKP solution (30 mM Hepes, 5 mM MgSO4, 1 mM DTT, 0.5 mM EDTA, 25 mM KCl, and 0.5% polyethylene glycol [molecular weight of 20,000], pH 7.4) at ice-cold temperature. The flagella are demembranated by HMDEKP + 0.5% NP-40 (EMD Millipore), spun down again at 5,200 g for 40 min, and resuspended in HMDEKP.
SDS-PAGE and Western blot
The composition of DHCs was analyzed by SDS-PAGE with a 4% polyacrylamide and 6 M urea gel. 10 µg of axoneme was applied on the gel for each strain. Immunoblot was performed by the method of King et al. (1986). pAbs produced against the N-terminal polypeptides of DHC3, DHC4, DHC5 (dynein b), and DHC11 were used (Yagi et al., 2009). In addition, a pAb against the N-terminal sequence of DHC8 (dynein e) corresponding to amino acids 21–714 was produced in this study. Antibody against IC140, an IC of inner-arm dynein f, was also used (a gift from W. Sale, Emory University, Atlanta, GA). Immunoreactive bands were detected using HRP-conjugated secondary antibody (GE Healthcare) and chemiluminescence reagents Chemi-Lumi One Super (Nacalai Tesque, Inc.) or ImmunoStar LD (WAKO Chemicals USA).
Immunofluorescence microscopy
Immunofluorescence microscopy was performed according to Taillon et al. (1992). Wild-type and ida5 cells were demembranated in 1% NP-40, fixed with 2% PFA for 2 min at room temperature, and treated with −20°C acetone. Nucleoflagellar apparatuses (complex of two axonemes, two basal bodies, and a nucleus) produced by the demembranation of CW92 cells were also used (Wright et al., 1985). The fixed samples were stained with an α-tubulin mAb (T5168; Sigma-Aldrich) and with a specific pAb of dynein e. Alexa Fluor 488–labeled anti–rabbit IgG (Invitrogen) or rhodamine-labeled anti–mouse IgG (Sigma-Aldrich) was used as the secondary antibody. Images were acquired using an IX70 microscope with a 100×/1.3 NA objective lens (Olympus) and a cooled charge-coupled device camera (ORCA-AR; Hamamatsu Photonics).
EM
The demembranated flagella were quick frozen on holey carbon grids (R2/1; QUANTIFOIL) using the Vitrobot plunger machine (FEI). 3.5 µl of 10-nm gold colloidal solution (Sigma-Aldrich) was deposited twice on the grid to use as the fiducial markers in tomogram reconstruction. We collected tilt series in the range of ±60 degrees with a 2-degree increment at 19,303× magnification at cryotemperature (approximately −175°C) using a transmission electron microscope (200 kV; Tecnai F20; FEI) equipped with a Tridiem energy filter (operated at 20eV slit; Gatan, Inc.) and an UltraScan 1000 camera (2,048 × 2,048 pixels; Gatan, Inc.) with defocus ranging from 4 to 6 µm. Data of ida1 mutants were collected using a transmission electron microscope (300 kV; Tecnai Polara; FEI) equipped with a GIF2002 energy filter (Gatan, Inc.) and a MultiScan camera (2,048 × 2,048 pixels; Gatan, Inc.) with defocus ranging from 8 to 9 µm. In both microscopes, the tilt series acquisition was controlled using Explore 3D (FEI). The pixel size of the tilt series is 7.25 Å.
The size of our camera prevents us from analyzing the whole flagellum simultaneously. With our acquisition setup, a tomogram contains only a region of ∼1.4 µm, whereas the length of the whole flagellum is normally between 10 and 15 µm. Therefore, we systematically collected the tomograms of different regions along the flagellum by acquiring the tilt series and the corresponding low-magnification image for later identification. To increase the chance of proximal region of the axoneme during acquisition, we identified the proximal region by its square-end microtubule compared with the hanging-end microtubule of the tip region. We paid attention to collect noncompressed flagella by acquiring tilt series of axonemes that had diameter of ∼220 nm.
Subtomogram averaging
After the tomographic reconstruction by IMOD (Mastronarde, 1997), the flagella were classified into different regions by visually examining their cross-sections according to the region-specific features such as the 1–2 bridge (proximal), beak (central), or no beak (distal), as shown in Fig. 1 B. As the PEA region contained few repeat units and coexisted with the proximal region, subtomograms belonging to the PEA regions were aligned together with the proximal region and separated before averaging.
Subtomograms of 200 × 200 × 200 pixel (∼144 nm in each dimension) were extracted with roughly 96-nm periodicity from the same region of the flagella by Bsoft (Heymann, 2001) and then gone through the 96-nm repeat alignment separately, as described elsewhere (Ishikawa et al., 2007; Bui et al., 2008, 2009), using a combination of software packages, including SPIDER (Frank et al., 1996), Bsoft (Heymann, 2001), TOM (Nickell et al., 2005), and an in-house program. In short, the subtomograms from the same MTD from one tomogram were aligned along the microtubule based on cross-correlation (intradoublet alignment) to make subaverages along each MTD. The obtained subaverages were then aligned between MTDs.
After alignment, the position of the doublet in the entire axoneme was determined using the specific features of Chlamydomonas (Fig. 1). Subtomograms belonging to each MTD and region were then averaged together, refined with the new average and corrected for the missing wedge to ensure isotropicity. Isosurface visualization was performed in UCSF Chimera (Pettersen et al., 2004). The segmentation (coloring) of the maps for outer- and inner-arm dyneins, RSs, the DRC, and dynein f IC/LC was performed using the UCSF Chimera program and based on previous studies by ourselves (Ishikawa et al., 2007; Bui et al., 2008; Pigino et al., 2011, 2012) and others (Nicastro et al., 2006; Heuser et al., 2009). The 96-nm model in Fig. 2 B was created by tracing density map by 3DMOD (Kremer et al., 1996).
To quantify the distortion by compression, we fitted an ellipse on the model of the middle cross-section of the flagella built from the alignment parameters and defined the elliptical distortion as the long axis divided by the short axis of the fitted ellipse. Only flagella with elliptical distortion <20% were included in the average (Fig. S1 A). By Fourier shell correlation, the resolution of the averaged map of MTD2-8− at 0.5 cut-off was 36.8 Å (Fig. S1 B).
To ensure that the structural features that we observed were reproducible, we split our wild-type data into two sets and examined whether the averages from those two sets showed similar structural features. In addition, we also averaged the mutants used in this study to double check the features that were not missing in the mutant were similar to those of wild type.
Density maps
The density maps reconstructed in this study were deposited in EMDataBank as EMD-2113 to 2118 and EMD-2121 to 2123 (MTD1-9 of the distal region from wild type), EMD-2119, 2020, and 2124 to 2130 (MTD1-9 of the proximal region from wild type), and EMD-2132 and 2131 (average of the distal and the proximal regions from wild type, respectively).
Online supplemental material
Fig. S1 describes the quality of our image analysis. Fig. S2 shows structure of dynein heads (AAA rings) as sections from averaged tomograms. Fig. S3 shows immunoblot analysis of inner-arm dyneins in long and short flagella. Fig. S4 demonstrates connections between IDAs and ODAs. Fig. S5 shows Western blot of dynein b in wild-type, pf2, pf3, and ida10 axonemes. Video 1 shows structure of axoneme at the proximal, central, and distal regions. Video 2 highlights the difference between the proximal and the central/distal regions in MTD2-8. Video 3 demonstrates the difference between MTD2-4 and MTD6-8 in the proximal region. Video 4 shows the difference between the proximal and the distal regions in MTD1. Online supplemental material is available at http://www.jcb.org/cgi/content/full/jcb.201201120/DC1.
Supplementary Material
Acknowledgments
We thank Professor Timothy J. Richmond (Eidgenössische Technische Hochschule Zürich, Zürich, Switzerland) for the biochemical facility, Dr. Roger Wepf, Peter Tittmann (Electron Microscopy Center of the Eidgenössische Technische Hochschule Zürich, Zürich, Switzerland) for technical support of EM, Dr. Winfield S. Sale for the gift of IC140 antibody, and Dr. Martin Beck (European Molecular Biology Laboratory Heidelberg, Heidelberg, Germany) and the EM core facility of European Molecular Biology Laboratory Heidelberg for permission to use their microscope.
This work was funded by grants from the Swiss National Science Foundation (NF31003A-125131/1), Swiss–Japan Cooperative Research Fund and Eidgenössische Technische Hochschule Independent Investigators’ Research Awards (to T. Ishikawa), the Japan Society for the Promotion of Science (22570157; to T. Yagi), and TOYOBO Biotechnology Foundation and Uehara Memorial Foundation (to R. Yamamoto). All commercial affiliations/conflicts of interest have been disclosed.
Footnotes
Abbreviations used in this paper:
- cryo-ET
- cryoelectron tomography
- DHC
- dynein heavy chain
- DRC
- dynein regulatory complex
- IC
- intermediate chain
- IDA
- inner dynein arm
- LC
- light chain
- MD
- minor dynein
- MTD
- microtubule doublet
- ODA
- outer dynein arm
- OIDL
- outer–inner dynein link
- PEA
- proximal end of the axoneme
- RS
- radial spoke
References
- Bessen M., Fay R.B., Witman G.B. 1980. Calcium control of waveform in isolated flagellar axonemes of Chlamydomonas. J. Cell Biol. 86:446–455 10.1083/jcb.86.2.446 [DOI] [PMC free article] [PubMed] [Google Scholar]
- Bui K.H., Sakakibara H., Movassagh T., Oiwa K., Ishikawa T. 2008. Molecular architecture of inner dynein arms in situ in Chlamydomonas reinhardtii flagella. J. Cell Biol. 183:923–932 10.1083/jcb.200808050 [DOI] [PMC free article] [PubMed] [Google Scholar]
- Bui K.H., Sakakibara H., Movassagh T., Oiwa K., Ishikawa T. 2009. Asymmetry of inner dynein arms and inter-doublet links in Chlamydomonas flagella. J. Cell Biol. 186:437–446 10.1083/jcb.200903082 [DOI] [PMC free article] [PubMed] [Google Scholar]
- Dentler W.L., Rosenbaum J.L. 1977. Flagellar elongation and shortening in Chlamydomonas. III. Structures attached to the tips of flagellar microtubules and their relationship to the directionality of flagellar microtubule assembly. J. Cell Biol. 74:747–759 10.1083/jcb.74.3.747 [DOI] [PMC free article] [PubMed] [Google Scholar]
- Dutcher S.K. 1995. Flagellar assembly in two hundred and fifty easy-to-follow steps. Trends Genet. 11:398–404 10.1016/S0168-9525(00)89123-4 [DOI] [PubMed] [Google Scholar]
- Fliegauf M., Olbrich H., Horvath J., Wildhaber J.H., Zariwala M.A., Kennedy M., Knowles M.R., Omran H. 2005. Mislocalization of DNAH5 and DNAH9 in respiratory cells from patients with primary ciliary dyskinesia. Am. J. Respir. Crit. Care Med. 171:1343–1349 10.1164/rccm.200411-1583OC [DOI] [PMC free article] [PubMed] [Google Scholar]
- Fliegauf M., Benzing T., Omran H. 2007. When cilia go bad: Cilia defects and ciliopathies. Nat. Rev. Mol. Cell Biol. 8:880–893 10.1038/nrm2278 [DOI] [PubMed] [Google Scholar]
- Frank J., Radermacher M., Penczek P., Zhu J., Li Y., Ladjadj M., Leith A. 1996. SPIDER and WEB: Processing and visualization of images in 3D electron microscopy and related fields. J. Struct. Biol. 116:190–199 10.1006/jsbi.1996.0030 [DOI] [PubMed] [Google Scholar]
- Gardner L.C., O’Toole E., Perrone C.A., Giddings T., Porter M.E. 1994. Components of a “dynein regulatory complex” are located at the junction between the radial spokes and the dynein arms in Chlamydomonas flagella. J. Cell Biol. 127:1311–1325 10.1083/jcb.127.5.1311 [DOI] [PMC free article] [PubMed] [Google Scholar]
- Gorman D.S., Levine R.P. 1965. Cytochrome f and plastocyanin: Their sequence in the photosynthetic electron transport chain of Chlamydomonas reinhardi. Proc. Natl. Acad. Sci. USA. 54:1665–1669 10.1073/pnas.54.6.1665 [DOI] [PMC free article] [PubMed] [Google Scholar]
- Heuser T., Raytchev M., Krell J., Porter M.E., Nicastro D. 2009. The dynein regulatory complex is the nexin link and a major regulatory node in cilia and flagella. J. Cell Biol. 187:921–933 10.1083/jcb.200908067 [DOI] [PMC free article] [PubMed] [Google Scholar]
- Heymann J.B. 2001. Bsoft: Image and molecular processing in electron microscopy. J. Struct. Biol. 133:156–169 10.1006/jsbi.2001.4339 [DOI] [PubMed] [Google Scholar]
- Hoops H.J., Witman G.B. 1983. Outer doublet heterogeneity reveals structural polarity related to beat direction in Chlamydomonas flagella. J. Cell Biol. 97:902–908 10.1083/jcb.97.3.902 [DOI] [PMC free article] [PubMed] [Google Scholar]
- Hyams J.S., Borisy G.G. 1978. Isolated flagellar apparatus of Chlamydomonas: Characterization of forward swimming and alteration of waveform and reversal of motion by calcium ions in vitro. J. Cell Sci. 33:235–253 [DOI] [PubMed] [Google Scholar]
- Ishikawa T., Sakakibara H., Oiwa K. 2007. The architecture of outer dynein arms in situ. J. Mol. Biol. 368:1249–1258 10.1016/j.jmb.2007.02.072 [DOI] [PubMed] [Google Scholar]
- Kagami O., Kamiya R. 1992. Translocation and rotation of microtubules caused by multiple species of Chlamydomonas inner-arm dynein. J. Cell Sci. 103:653–664 [Google Scholar]
- Kamiya R., Kurimoto E., Muto E. 1991. Two types of Chlamydomonas flagellar mutants missing different components of inner-arm dynein. J. Cell Biol. 112:441–447 10.1083/jcb.112.3.441 [DOI] [PMC free article] [PubMed] [Google Scholar]
- Kato-Minoura T., Uryu S., Hirono M., Kamiya R. 1998. Highly divergent actin expressed in a Chlamydomonas mutant lacking the conventional actin gene. Biochem. Biophys. Res. Commun. 251:71–76 10.1006/bbrc.1998.9373 [DOI] [PubMed] [Google Scholar]
- King S.M., Otter T., Witman G.B. 1986. Purification and characterization of Chlamydomonas flagellar dyneins. Methods Enzymol. 134:291–306 10.1016/0076-6879(86)34097-7 [DOI] [PubMed] [Google Scholar]
- Kremer J.R., Mastronarde D.N., McIntosh J.R. 1996. Computer visualization of three-dimensional image data using IMOD. J. Struct. Biol. 116:71–76 10.1006/jsbi.1996.0013 [DOI] [PubMed] [Google Scholar]
- Mastronarde D.N. 1997. Dual-axis tomography: An approach with alignment methods that preserve resolution. J. Struct. Biol. 120:343–352 10.1006/jsbi.1997.3919 [DOI] [PubMed] [Google Scholar]
- Mastronarde D.N., O’Toole E.T., McDonald K.L., McIntosh J.R., Porter M.E. 1992. Arrangement of inner dynein arms in wild-type and mutant flagella of Chlamydomonas. J. Cell Biol. 118:1145–1162 10.1083/jcb.118.5.1145 [DOI] [PMC free article] [PubMed] [Google Scholar]
- Merchant S.S., Prochnik S.E., Vallon O., Harris E.H., Karpowicz S.J., Witman G.B., Terry A., Salamov A., Fritz-Laylin L.K., Maréchal-Drouard L., et al. 2007. The Chlamydomonas genome reveals the evolution of key animal and plant functions. Science. 318:245–250 10.1126/science.1143609 [DOI] [PMC free article] [PubMed] [Google Scholar]
- Morris R.L., Hoffman M.P., Obar R.A., McCafferty S.S., Gibbons I.R., Leone A.D., Cool J., Allgood E.L., Musante A.M., Judkins K.M., et al. 2006. Analysis of cytoskeletal and motility proteins in the sea urchin genome assembly. Dev. Biol. 300:219–237 10.1016/j.ydbio.2006.08.052 [DOI] [PMC free article] [PubMed] [Google Scholar]
- Movassagh T., Bui K.H., Sakakibara H., Oiwa K., Ishikawa T. 2010. Nucleotide-induced global conformational changes of flagellar dynein arms revealed by in situ analysis. Nat. Struct. Mol. Biol. 17:761–767 10.1038/nsmb.1832 [DOI] [PubMed] [Google Scholar]
- Myster S.H., Knott J.A., O’Toole E., Porter M.E. 1997. The Chlamydomonas Dhc1 gene encodes a dynein heavy chain subunit required for assembly of the I1 inner arm complex. Mol. Biol. Cell. 8:607–620 [DOI] [PMC free article] [PubMed] [Google Scholar]
- Nicastro D., Schwartz C., Pierson J., Gaudette R., Porter M.E., McIntosh J.R. 2006. The molecular architecture of axonemes revealed by cryoelectron tomography. Science. 313:944–948 10.1126/science.1128618 [DOI] [PubMed] [Google Scholar]
- Nickell S., Förster F., Linaroudis A., Net W.D., Beck F., Hegerl R., Baumeister W., Plitzko J.M. 2005. TOM software toolbox: Acquisition and analysis for electron tomography. J. Struct. Biol. 149:227–234 10.1016/j.jsb.2004.10.006 [DOI] [PubMed] [Google Scholar]
- Patel-King R.S., King S.M. 2009. An outer arm dynein light chain acts in a conformational switch for flagellar motility. J. Cell Biol. 186:283–295 [DOI] [PMC free article] [PubMed] [Google Scholar]
- Pazour G.J., Agrin N., Leszyk J., Witman G.B. 2005. Proteomic analysis of a eukaryotic cilium. J. Cell Biol. 170:103–113 10.1083/jcb.200504008 [DOI] [PMC free article] [PubMed] [Google Scholar]
- Pettersen E.F., Goddard T.D., Huang C.C., Couch G.S., Greenblatt D.M., Meng E.C., Ferrin T.E. 2004. UCSF Chimera—a visualization system for exploratory research and analysis. J. Comput. Chem. 25:1605–1612 10.1002/jcc.20084 [DOI] [PubMed] [Google Scholar]
- Pigino G., Bui K.H., Maheshwari A., Lupetti P., Diener D., Ishikawa T. 2011. Cryoelectron tomography of radial spokes in cilia and flagella. J. Cell Biol. 195:673–687 10.1083/jcb.201106125 [DOI] [PMC free article] [PubMed] [Google Scholar]
- Pigino G., Maheshwari A., Bui K.H., Shingyoji C., Kamimura S., Ishikawa T. 2012. Comparative structural analysis of eukaryotic flagella and cilia from Chlamydomonas, Tetrahymena, and sea urchins. J. Struct. Biol. 178:199–206 10.1016/j.jsb.2012.02.012 [DOI] [PubMed] [Google Scholar]
- Piperno G., Ramanis Z. 1991. The proximal portion of Chlamydomonas flagella contains a distinct set of inner dynein arms. J. Cell Biol. 112:701–709 10.1083/jcb.112.4.701 [DOI] [PMC free article] [PubMed] [Google Scholar]
- Piperno G., Mead K., Shestak W. 1992. The inner dynein arms I2 interact with a “dynein regulatory complex” in Chlamydomonas flagella. J. Cell Biol. 118:1455–1463 10.1083/jcb.118.6.1455 [DOI] [PMC free article] [PubMed] [Google Scholar]
- Piperno G., Mead K., LeDizet M., Moscatelli A. 1994. Mutations in the “dynein regulatory complex” alter the ATP-insensitive binding sites for inner arm dyneins in Chlamydomonas axonemes. J. Cell Biol. 125:1109–1117 10.1083/jcb.125.5.1109 [DOI] [PMC free article] [PubMed] [Google Scholar]
- Porter M.E., Sale W.S. 2000. The 9 + 2 axoneme anchors multiple inner arm dyneins and a network of kinases and phosphatases that control motility. J. Cell Biol. 151:F37–F42 10.1083/jcb.151.5.F37 [DOI] [PMC free article] [PubMed] [Google Scholar]
- Ringo D.L. 1967. Flagellar motion and fine structure of the flagellar apparatus in Chlamydomonas. J. Cell Biol. 33:543–571 10.1083/jcb.33.3.543 [DOI] [PMC free article] [PubMed] [Google Scholar]
- Summers K.E., Gibbons I.R. 1971. Adenosine triphosphate-induced sliding of tubules in trypsin-treated flagella of sea-urchin sperm. Proc. Natl. Acad. Sci. USA. 68:3092–3096 10.1073/pnas.68.12.3092 [DOI] [PMC free article] [PubMed] [Google Scholar]
- Taillon B.E., Adler S.A., Suhan J.P., Jarvik J.W. 1992. Mutational analysis of centrin: An EF-hand protein associated with three distinct contractile fibers in the basal body apparatus of Chlamydomonas. J. Cell Biol. 119:1613–1624 10.1083/jcb.119.6.1613 [DOI] [PMC free article] [PubMed] [Google Scholar]
- Ueno H., Ishikawa T., Bui K.H., Gonda K., Ishikawa T., Yamaguchi T. 2012. Mouse respiratory cilia with the asymmetric axonemal structure on sparsely distributed ciliary cells can generate overall directional flow. Nanomedicine. In press [DOI] [PubMed] [Google Scholar]
- Wickstead B., Gull K. 2007. Dyneins across eukaryotes: A comparative genomic analysis. Traffic. 8:1708–1721 10.1111/j.1600-0854.2007.00646.x [DOI] [PMC free article] [PubMed] [Google Scholar]
- Wilkes D.E., Watson H.E., Mitchell D.R., Asai D.J. 2008. Twenty-five dyneins in Tetrahymena: A re-examination of the multidynein hypothesis. Cell Motil. Cytoskeleton. 65:342–351 10.1002/cm.20264 [DOI] [PubMed] [Google Scholar]
- Witman G.B. 1986. Isolation of Chlamydomonas flagella and flagellar axonemes. Methods Enzymol. 134:280–290 10.1016/0076-6879(86)34096-5 [DOI] [PubMed] [Google Scholar]
- Wright R.L., Salisbury J., Jarvik J.W. 1985. A nucleus-basal body connector in Chlamydomonas reinhardtii that may function in basal body localization or segregation. J. Cell Biol. 101:1903–1912 10.1083/jcb.101.5.1903 [DOI] [PMC free article] [PubMed] [Google Scholar]
- Yagi T., Minoura I., Fujiwara A., Saito R., Yasunaga T., Hirono M., Kamiya R. 2005. An axonemal dynein particularly important for flagellar movement at high viscosity. Implications from a new Chlamydomonas mutant deficient in the dynein heavy chain gene DHC9. J. Biol. Chem. 280:41412–41420 10.1074/jbc.M509072200 [DOI] [PubMed] [Google Scholar]
- Yagi T., Uematsu K., Liu Z., Kamiya R. 2009. Identification of dyneins that localize exclusively to the proximal portion of Chlamydomonas flagella. J. Cell Sci. 122:1306–1314 10.1242/jcs.045096 [DOI] [PubMed] [Google Scholar]
- Yamamoto R., Yanagisawa H.A., Yagi T., Kamiya R. 2006. A novel subunit of axonemal dynein conserved among lower and higher eukaryotes. FEBS Lett. 580:6357–6360 10.1016/j.febslet.2006.10.047 [DOI] [PubMed] [Google Scholar]
- Yamamoto R., Yanagisawa H.A., Yagi T., Kamiya R. 2008. Novel 44-kilodalton subunit of axonemal Dynein conserved from chlamydomonas to mammals. Eukaryot. Cell. 7:154–161 10.1128/EC.00341-07 [DOI] [PMC free article] [PubMed] [Google Scholar]
- Yamamoto R., Hirono M., Kamiya R. 2010. Discrete PIH proteins function in the cytoplasmic preassembly of different subsets of axonemal dyneins. J. Cell Biol. 190:65–71 10.1083/jcb.201002081 [DOI] [PMC free article] [PubMed] [Google Scholar]
Associated Data
This section collects any data citations, data availability statements, or supplementary materials included in this article.