

Abstract
Engineered protein nanopores, such as those based on α-hemolysin from Staphylococcus aureus have shown great promise as components of next-generation DNA sequencing devices. However, before such protein nanopores can be used to their full potential, the conformational dynamics and translocation pathway of the DNA within them must be characterized at the individual molecule level. Here, we employ atomistic molecular dynamics simulations of single-stranded DNA movement through a model α-hemolysin pore under an applied electric field. The simulations enable characterization of the conformations adopted by single-stranded DNA, and allow exploration of how the conformations may impact on translocation within the wild-type model pore and a number of mutants. Our results show that specific interactions between the protein nanopore and the DNA can have a significant impact on the DNA conformation often leading to localized coiling, which in turn, can alter the order in which the DNA bases exit the nanopore. Thus, our simulations show that strategies to control the conformation of DNA within a protein nanopore would be a distinct advantage for the purposes of DNA sequencing.
Introduction
The translocation of biopolymers through pores is a ubiquitous process in biology, e.g., the movement of peptides through larger, transporter proteins (1) and movement of nucleic acids in and out of nuclear pores (2). Inspired by biology, the movement of DNA through nanoscale pores has been used in the development of next-generation DNA sequencing devices (3). Such devices consist of a nanoscale pore, either synthetic (4) or biological (5), placed in a barrier between two compartments of ionic solution. A potential is applied across the pore and the resulting ionic current is measured. Addition of DNA to the solution results in its movement through the pore, causing a partial current block. Each of the four DNA bases produces a slightly different characteristic current block, allowing them to be distinguished and hence the sequence to be determined.
The protein most often used in the development of sequencing devices is α-hemolysin (α-HL), a toxin from Staphylococcus aureus (6). α-HL is a large homoheptameric toxin protein of ∼240 kDa. It consists of two domains: a cap domain, on the outer face of the membrane, and a 14-stranded transmembrane β-barrel domain. Although some success has been reported in adapting the protein for DNA sequencing, issues remain with the resolution between bases on a moving strand, in part caused by the fast translocation speed of single-stranded DNA (ssDNA) (7). Consequently, recent efforts have largely focused on attempting to slow down the translocation of ssDNA through α-HL, often through mutation of the pore (8–10). For instance, the M113R pore mutant is often used as the background mutation in nucleotide detection experiments (11).
Although the global effects of mutations within the α-HL pore can be well characterized in terms of their effect on translocation speed and the observed currents, the effects on the nucleic acids themselves are rather more difficult to study via experimental methods. As single-stranded nucleic acid strands are known for their inherent flexibility (12)—which makes identifying individual discrete structures difficult, if not impossible—it is reasonable to expect that ssDNA would adopt multiple conformations as it translocates through the pore; indeed, we have previously demonstrated such behavior with short strands of DNA in model pores (13). However, the question of what happens to longer DNA strands within the confined geometry of nanoscale pores remains to be addressed. For accurate DNA sequencing, each of the bases must pass the recognition site in the correct order. Hairpin conformations and other coiling of the DNA within the pore have the potential to alter the order of bases passing through the recognition region. Thus, understanding how the conformational dynamics of DNA is affected by mutations within the α-HL pore is imperative for the design of novel pores for DNA sequencing.
Molecular dynamics (MD) simulations provide a route to study both nanopores and conformational dynamics of biopolymers at atomistic resolution. For example, the dramatic conformational response of double-stranded DNA (dsDNA) to ligands binding in the major groove has been characterized by MD simulations (14). The design of protein-mimetic carbon nanotube pores has been explored (15). The response of DNA to an applied electric field has been studied within a nanopore, focusing on the effects of DNA orientation on observed current (16). Another study has shown that dsDNA can be stretched through a synthetic pore narrower than itself by applying a strong electric field (17). Finally, free energies of translocation of polynucleotides through α-HL have been determined using steered MD simulations (18).
In the following study, we ask two questions. First, does the conformation of the ssDNA impact upon the time taken for it to translocate through the nanopore? Second, does the conformation that ssDNA adopts within the nanopore have any effect upon the order in which the bases exit the pore? To address these questions, we have characterized the conformations of ssDNA strands as they translocate through a model pore that mimics the transmembrane domain of α-HL (13), shown in Fig. 1. Although simulation studies have indirectly demonstrated the suitability of using the CHARMM parameter set for ssDNA simulations (16,19), necessitated by the absence of detailed and systematic validation of ssDNA parameters for studying conformational dynamics, we first validate four of the most commonly used nucleic acid parameter sets: AMBER99, AMBER99 with ParmBSC0 nucleic acid torsions, CHARMM27, and GROMOS96 53A6.
Figure 1.
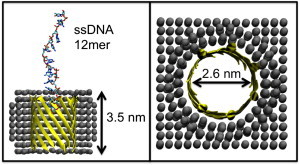
(Left) Simulation setup. Protein β-barrel is shown in ribbon, cut-away format. The membrane-mimetic slab is shown as spheres. The DNA strand is shown in licorice format. (Right) Pore dimensions, as viewed down the barrel principle axis.
Methods
Force field validation
To determine which parameter sets are most suitable for simulating ssDNA, multiple simulations with different parameter sets were performed at varying salt concentrations. This is because there is currently little, if any, validation of the widely used nucleic acid force fields for simulation of ssDNA. Four of the most commonly used nucleic acid parameter sets were tested: AMBER99 (20), AMBER99 with ParmBSC0 nucleic acid torsions (21), CHARMM27 (22), and GROMOS 53A6 (23).
Each simulation system consisted of a single DNA strand extracted from the Dickerson-Drew dodecamer (24), and thus was the B-helical conformation (as it would be in the double-stranded structure). This was placed in a 6 nm × 6 nm × 6 nm box of water, with ∼11,000 water molecules. The water model was force field dependent, being TIP3P for AMBER/ParmBSC0, TIPS3P for CHARMM, and SPC for GROMOS. Salt was added to 0.0 M, 0.1 M, 0.2 M, 0.5 M, and 1.0 M concentrations, up to a maximum of ∼200 Na+ and Cl− ions. Additional ions were added to ensure the systems were charge neutral. Simulations were performed with GROMACS version 4.5.3 (25). Extended ssDNA was created using the GROMACS pull code by applying a pulling force to one end of the ssDNA. A summary of all simulations is given in Table 1.
Table 1.
Table of simulations for ssDNA parameter validation
| Force field | No. simulations | Salt concentrations (M) | Simulation lengths (ns) |
|---|---|---|---|
| CHARMM27 | 15 | 0, 0.1, 0.2, 0.5, 1 | 100 |
| AMBER99 | 15 | 0, 0.1, 0.2, 0.5, 1 | 100 |
| AMBER99 with ParmBSC0 torsions | 15 | 0, 0.1, 0.2, 0.5, 1 | 100 |
| GROMOS96 53A6 | 15 | 0, 0.1, 0.2, 0.5, 1 | 100 |
| CHARMM27 (extended ssDNA) | 3 | 1 | 100 |
| AMBER99 (extended ssDNA) | 3 | 1 | 100 |
| AMBER99 with ParmBSC0 torsions (extended ssDNA) | 3 | 1 | 100 |
| GROMOS96 53A6 (extended ssDNA) | 3 | 1 | 100 |
At the start of this study the ParmBSC0 parameters were not implemented in GROMACS, and therefore to use this force field we converted the modified dihedral parameters to the GROMACS format. The conversion was checked through simulations of the Dickerson dodecamer in vacuo with infinite cutoffs in both AMBER11 (26) and GROMACS. The differences in the energies for the dihedrals were within 0.0014 kJmol−1 (0.0001%).
Each system was setup with reference to the original parameterization for each force field, as given in the literature, however all simulations were performed with particle mesh Ewald (PME) (27) even though the 53A6 force field was parameterized with reaction-field electrostatics. Full details are given in the Supporting Material. For the 53A6 force field, we used PME electrostatics because it has been suggested that PME performs better than the standard reaction-field method (28). All simulations were run for 100 ns, and were repeated three times for a given force field at each salt concentration. Visualization used visual molecular dynamics (29). Analysis was performed using tools included in GROMACS and locally written code.
ssDNA within a nanopore
Our previously described model of α-HL (13) was used to mimic the transmembrane region of the protein. Simulations used the GROMOS 53A6 force field (23) The initial system consisted of the α-HL barrel embedded in a ∼1000-atom methane slab, with one ssDNA dodecamer (30) of sequence 5′-ACCGACGTCGGT-3′ prethreaded into the pore by the first two bases (5′ end) to overcome the energetic barrier to pore entry. For the purposes of the rest of this work, the ssDNA sequence will be referred to as follows:
The ssDNA was positioned with the 5′ base, A1, in closest proximity to the pore. The system was solvated with ∼10,000 SPC water molecules, and salt was added to a concentration of 1 M, for a total of ∼200 Na+ and Cl− ions. Simulations were run for 100 ns, and were repeated five times with different initial velocities, to give a total of six independent simulations for each system. Electrostatics was treated using PME, with a short range cutoff of 1 nm. Van der Waals interactions were truncated at 1 nm. An electric field equivalent to a potential of ∼300 mV across the slab was applied to the system. A summary of all simulations is given in Table 2. Clustering analysis was performed using the GROMOS clustering method (31) as implemented in the GROMACS g_cluster tool. All trajectories for a given system were concatenated, and cluster analysis with a root mean-square deviation cutoff of 0.4 nm was performed using the initial conformation of the ssDNA as a reference. The resulting clusters were then reclustered with a cutoff of 0.8 nm, to find clusters with broad similarity.
Table 2.
Table of simulations for DNA translocation study
| System | No. simulations | No. simulations where ssDNA translocates fully | Simulation length (ns) |
|---|---|---|---|
| WT | 6 | 6 | 100 |
| G119K | 6 | 3 | 100 |
| G119R | 6 | 3 | 100 |
| G119W | 6 | 0 | 100 |
Because GROMOS DNA does not include terminal nucleotide definitions, the required 3′ hydroxyl parameters were created using the standard GROMOS RNA parameter as a reference. Although terminal nucleotide definitions have been reported previously (32), it was noted the charge schemes were inconsistent with the standard GROMOS parameters. Mutant pores were setup as described in our earlier work (13), simply by using the MODELER package (33) to mutate the relevant residues. The mutant pores simulated in this study are the single point mutants; G119K, G119R, and G119W. Other analysis was performed with GROMACS analysis tools and locally written code.
Results
Force field validation
Analysis of the simulations showed two distinct types of behavior in ssDNA treated with the different force fields, specifically between the AMBER-type force fields and the non-AMBER force fields. Thus, the results are divided into subsections to reflect this.
CHARMM and GROMOS
The initial coordinates of the ssDNA strand were extracted from the x-ray structure of a DNA double helix dodecamer (24), i.e., one strand from a double helix in the B-DNA conformation. To evaluate the length of the ssDNA we measured the end-to-end distance between the 3′ and 5′ terminal hydroxyl groups, the initial distance being ∼3.5 nm (Fig. S1 in the Supporting Material). The conformational dynamics of ssDNA treated by both the CHARMM27 and GROMOS96 force fields were comparable to each other. In both sets of simulations, the ssDNA lost any initial B-helical structure rapidly, forming a compact, nonlinear structure within the first 10–20 ns of simulation. Radius of gyration calculations can give a measure of compactness of a polymer (Figs. S2–S7). The radius of gyration for the ssDNA in the compact conformation was ∼0.9 nm compared to ∼1.3 nm for the initial helical conformation. This compact ssDNA structure appeared to be a random conformation of the ssDNA, and incorporated some base stacking and non-Watson-Crick basepairing. In the CHARMM27 simulations, hydrogen bonding was observed between nonmatching bases, and also between the bases and the phosphate groups of the ssDNA. Similar random (nonhelical) structures were adopted by the ssDNA treated by the GROMOS parameters. In the folded state these hydrogen bonds are most often formed between bases and the phosphate groups of the backbone of the strand, and tend to be transient, lasting <10 ns. Given that the starting ssDNA coordinates were extracted from a double helix in the B-DNA conformation (24), we also tested the simulation of a more, initially extended DNA strand. Folding of the DNA from the initially extended ssDNA conformation, was not observed with either the CHARMM or GROMOS parameters. A summary of representative conformations for each force field is given in Fig. 2.
Figure 2.
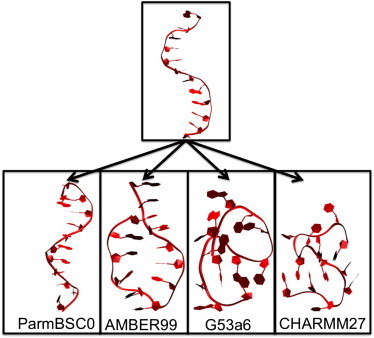
Starting and ending configurations of ssDNA, beginning from a helical conformation. Simulations were run for 100 ns. Left to right: ParmBSC0, AMBER99, GROMOS96 53A6, and CHARMM 27.
The distance between adjacent phosphate groups is a conformational descriptor that can be compared to experimental data. Experimental measurements reveal that although the interphosphate distance fluctuates as a function of sugar puckering, it is usually considered to lie between 5.9 Å and 7 Å (12). The average interphosphate distance measured for ssDNA treated with CHARMM27 was 6.41 Å with an average standard deviation of 0.42 Å. Simulations of ssDNA with GROMOS revealed an average distance interphosphate distance of 6.40 Å with an average standard deviation of 0.51 Å (Fig. S8).
AMBER99 and ParmBSC0
Our results reveal that ssDNA treated with the AMBER99 parameters can retain its initial conformation for up to 80 ns (Fig. S1). Retention of the initial conformation for at least 40 ns occurs in 5 of 15 simulations and appears to be independent of salt concentration. In the other 10 simulations, the initial conformation is lost within the first 30 ns. ParmBSC0 ssDNA retains its initial (coiled) conformation for at least 40 ns in at least 12 of 15 simulations, in some cases retaining this conformation for the whole 100 ns of simulation time (see the Supporting Material). The local base step parameters were calculated for this strand using the 3DNA web interface (34) and compared to experimental values for dsDNA, and found to still be in good agreement (Table S1). We also observed a tendency for the ssDNA treated with AMBER99 to form a hairpin conformation, in ∼40% of all simulations. In this conformation, the ssDNA forms non-Watson-Crick basepairs with itself (Fig. S9). Once formed, the hairpin structure appears to be stabilized by internal hydrogen bonds between the bases. This intrastrand hydrogen bonding appears to be independent of sequence; we did not observe any one base to exhibit a higher propensity to engage in such hydrogen bonds than the others. These bonds are relatively stable, with lifetimes of between 30 and 40 ns. The formation of this double helix secondary structure, and the propensity to retain the initial DNA conformation, suggest that the AMBER99 and ParmBSC0 parameter sets are perhaps both more appropriate for dsDNA.
In simulations in which the starting ssDNA conformation was extended, the initial conformation was no longer retained. In contrast to the GROMOS and CHARMM parameters, in all simulations using the AMBER parameters, some element of DNA folding was observed within the first 10 ns. However, the final ssDNA structure, after 100 ns of simulation still showed the hairpin-like behavior in two of the three final conformations in the AMBER99 simulations. The ssDNA treated with the ParmBSC0 parameters also formed this type of structure in one out of the three simulations.
In our simulations, the radius of gyration is ∼1.3 nm for the ssDNA initial conformation taken from the Dickerson dodecamer, ∼1.5 nm for the ssDNA in the initially extended conformation, and ∼0.90–0.95 nm when in the hairpin conformation. The initial value of the radius of gyration does not change substantially (remains within the range 1.2–1.4 nm) for the first 80 or so nanoseconds in 3 out of 15 AMBER99 simulations, and in 8 out of 15 ParmBSC0 simulations (Figs. S2–S7).
The average interphosphate distance in simulations using both the AMBER99 and ParmBSC0 parameter sets was 6.76 Å across several simulations, with an average standard deviation of 0.4 Å and 0.36 Å, respectively (Fig. S8). This further serves to highlight the similarities in the ssDNA conformations produced by these force fields. The average phosphate-phosphate distances across all force fields are given in Fig. S8. The average standard deviation of the ssDNA treated with the AMBER force fields is lower than when treated with the CHARMM/GROMOS parameters, reflecting the greater conformational flexibility of the latter two parameter sets. Although all parameter sets give reasonable values for the interphosphate distances, we note that the higher phosphate-phosphate distances from the AMBER simulations are closer to the value of 7 Å, which is usually associated with the canonical B-DNA double helix (35).
The propensity for both AMBER systems to either remain in their initial conformation, or to fold into a similar structure during the first 100 ns of a simulation, suggests possible unsuitability for representing ssDNA. Given that CHARMM simulations are more time-consuming to perform due to the CHARMM TIP3P water model, which includes water hydrogen Lennard-Jones parameters (36), the GROMOS force field was chosen for further ssDNA simulations.
ssDNA within a protein nanopore
We have previously described a minimal model of the α-HL transmembrane barrel, which retains the features of the wild-type (WT) protein that are important for DNA translocation (13). We have used our models of the WT protein and mutant pores (G119K, G119R, and G119W) to study the translocation of ssDNA through the pores under an applied electric field. In each simulation an ssDNA dodecamer was placed near the mouth of the nanopore as described in the Method section. The system was subjected to an external electric field of 300 mV across the membrane-mimetic slab. Six independent simulations of each type of pore were performed. The translocation mechanism of the DNA and the conformations it adopts within the nanopores were characterized. A summary of the simulations is provided in Table 2.
ssDNA translocation
To characterize the behavior of the ssDNA as it passes through the protein pore, the time evolution of the ssDNA translocation through each nanopore was characterized. This was quantified by measuring the time at which the center of mass of each base passed the center of mass of the ring of residues formed by N123 i.e., the terminal residues at the mouth of the nanopore. Brief excursions of the bases beyond this point, whereby a base passes this ring of residues and then returns within the nanopore were discounted.
In simulations of the WT nanopore, it was observed that the first base to exit the pore is not necessarily base A1 (which entered the pore first). In four of six simulations that complete translocation, it was either base C2 or C3 that was the first to exit the pore; in only two simulations did base A1 exit the pore first. This is usually caused by base A1 forming hydrogen-bonding interactions with N123 and N121, both of which are close to the exit of the barrel, these interactions result in the base becoming tethered to the nanopore for periods of ∼2 to 5 ns. The average translocation time per base varies from 0.7 to 4.0 ns depending upon the simulation. Perhaps a more useful metric for comparing time taken for bases to pass through the pore, is the time taken for each subsequent base to exit the pore, relative to the first one that exits. This measure allows us to evaluate the behavior of individual bases, rather than the average over the whole strand. Sharp increases in the time taken for one base to exit the pore compared to the time taken for the base preceding it, represents strong ssDNA-protein nanopore interactions that result in the base requiring more time to exit the pore than the general trend for that simulation. For the WT simulations in general there is a relatively constant rate of translocation (Fig. S11). The most notable exception is the simulation in which there is a time lag of ∼50 ns between the nanopore exit times of bases A5 and C6; the subsequent bases follow relatively quickly. The relative times for each base to exit the nanopore is shown for all six simulations of the WT protein pore model in Fig. S10.
The time evolution data for the G119K simulations show short tethering events of 2 ns in two simulations, with another two simulations having a difference of <1 ns between the first and second or third bases exiting the pore. The relative time taken by each base to exit the pore in each of the three simulations in which full DNA translocation was observed, are shown in Fig. S11. Similar to the WT nanopore simulations, the second or third base of the strand is usually first to exit. A fifth simulation shows base T12 and K147 interacting by hydrogen bonding between the primary amine of K147 and the base nitrogen or carbonyls of T12 for ∼40 ns. The simulations in which translocation of the ssDNA was observed, the average time per base for translocation showed a spread of values, 1.3, 2.8, and 6.5 ns. For the fastest average translocation time of 1.3 ns/base, the ssDNA was observed to translocate at a relatively constant rate of translocation. In contrast translocation in the other two simulations occurred in a staggered fashion, with several bases exiting the pore at once, followed by a pause of up to tens of nanoseconds until the next group of bases followed. This staggered translocation pattern was also observed in two other simulations of this mutant pore, in which the ssDNA did not fully translocate, however most of the strand had exited the pore by the end of the 100 ns simulation.
For the G119R mutant nanopore (Fig. 3), one main pattern is observed in the translocation behavior; in four out of six simulations base A1 remains tethered to the pore exit via hydrogen bonding interactions with the N123 ring of residues, whereas base C2 or C3 is the first to exit the pore. The interaction of the terminal base and the asparagine residues generally lasts for between 3 and 10 ns. However, in one simulation that did not fully complete translocation, base A1 of the strand was observed to exit the pore 63 ns after base C2 had already exited. In another simulation, the first and second bases were observed to exit within 300 ps of each other, with base C2 of the strand being the first to exit the pore. For each simulation in which ssDNA completes translocation (a total of three)—the average translocation times per base were 1.3, 2.7, and 5.5 ns. The former two simulations show a relatively constant rate of movement throughout the simulation, whereas the latter shows interrupted movement rather than a constant motion. See Fig. 3 for the conformations of the ssDNA in situations where base A1 is not the first to exit.
Figure 3.
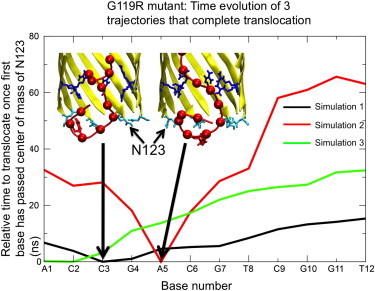
Time evolution data for three translocating simulations in G119R mutant. Arrows show first base that exits in simulations where base A1 does not exit first. The structures of the configurations at the point of this first base’s exit are displayed in the insets. Inset: R119 in dark blue, N123 in cyan, DNA in red.
ssDNA conformations within the protein nanopore
To characterize the conformations adopted by the ssDNA, we performed cluster analysis of the ssDNA conformations extracted from all the simulations. Several trends across the mutant pores were revealed by clustering the ssDNA conformations. In the WT nanopore, one major population was observed, comprising ∼40% of simulation time (∼240 ns); the remaining 60% consists of structures that are not similar enough to form a cluster.
In this cluster the ssDNA is in an extended conformation within the pore (Fig. 4), with an end-to-end distance ranging between 3.75 and 4.50 nm. This extended conformation may in part be the result of the ssDNA interacting with the barrel such that it is effectively tethered to the ring of residues formed by K147/E111 at the entrance of the barrel. The interactions are generally hydrogen bonding in nature; and occur between the lysine or glutamate side chains and the ssDNA bases, usually bases G10-T12. However, in one simulation there is a larger electrostatic component, with two phosphate groups from bases G10 and G11 of the ssDNA backbone interacting simultaneously with the amine group of a single lysine residue (Fig. 4). This terminal end of the ssDNA is tethered to the mouth of the barrel at the lysine and glutamate residues for between 20 and 50 ns, depending on the simulation.
Figure 4.
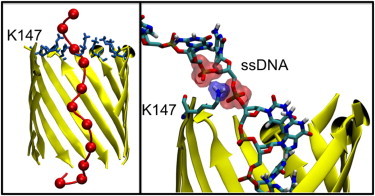
(Left) Dominant cluster in WT protein. The hemolysin barrel is shown in ribbon representation. K147 residues are shown in licorice representation. The DNA backbone is shown in tube format, with phosphorus atoms represented as van der Waals spheres. Water, slab, and ions are omitted for clarity. (Right) Interaction formed between the phosphate group of the DNA backbone and residue K147.
In the G119K mutant nanopore, there are two major clusters of ssDNA conformations, comprising 42% and 22% of simulation time for a total of 252 and 132 ns, respectively (Fig. 5). The first cluster consists of the ssDNA coiled within the pore, forming multiple interactions with the K119 residues in the lumen of the barrel. These interactions appear to be largely electrostatic, with K119 side chains often interspersed between two phosphate groups from the ssDNA backbone. DNA-nanopore hydrogen bonding was also observed; generally involving an ssDNA base and the lysine amine group. These hydrogen bonds tend to be transient; with a lifetime of a few nanoseconds. The second cluster consists of the terminal bases of the 3′ end of the DNA strand interacting with the ring of K119 residues, whereas the remainder of the strand has exited the pore. The interactions that tether the ssDNA to the K119 residues in this cluster are generally electrostatic in nature, and have a lifetime of between 20 and 40 ns.
Figure 5.
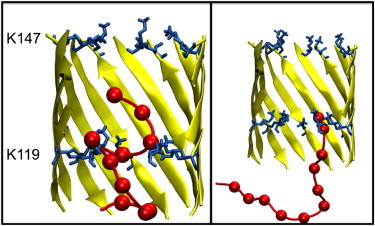
Two dominant clusters in G119K mutant. Display scheme as previous. (Left) Cluster formed by ssDNA as it interacts with the K119 ring of residues. (Right) Cluster formed by tethering of base T12 to K119.
In the G119R mutant nanopores, ∼50% of the clusters observed have ssDNA in close proximity to R119. These can be further split into two individual populations: those with multiple interactions with the arginine residues, forming a structure that coils around the arginines to maximize the number of interactions (40% of the total simulation time, ∼240 ns); and those with either the leading or tail end of the strand in contact with the arginine. The ssDNA-protein interactions are a combination of electrostatics and hydrogen bonding. On average three hydrogen bonds exist between the protein and ssDNA per simulation timestep, although this number can vary between five and two depending upon the cluster of ssDNA conformations. The number of hydrogen bonds within a time frame was calculated by using geometrical measures, for a hydrogen bond to be counted it has to have a donor and acceptor distance of 3.5 Å, and a donor-hydrogen-acceptor angle of 30°. A favorable electrostatic interaction between ssDNA and the nanopore comes from the simultaneous interaction of two ssDNA phosphate groups with a single arginine side chain (Fig. S12). The coiled structures have an end-to-end distance of ∼2.5 nm, whereas the more extended structures are ∼3.8 nm from terminal oxygen to terminal oxygen.
ssDNA conformations that result from an interaction between the leading or tail end of the strand and R119 residues comprise 10% of simulation time (∼60 ns). In this cluster the ssDNA adopts an extended conformation. The ssDNA-pore interaction is generally observed between the 3′ or 5′ terminal three ssDNA bases and the ring formed by the R119 residues. A third population consisting of 21% of the observed conformations can be described as looped structures. The looped conformations are formed when the 3′ end of the ssDNA interacts with the ring of R119 residues; more specifically, when the anionic phosphate groups form favorable electrostatic interactions with the cationic arginine guanidinium group. Although the 3′ end is engaged in interactions with the arginine residues, the 5′ end is observed to coil such that it is able to interact with base G7 or T8 of the strand, thus forming a 7 or 8 residue loop in the ssDNA. This conformation was observed to persist in solution even after the ssDNA had exited the nanopore (Fig. 6). This looped structure has an end-to-end distance of ∼1.8 nm.
Figure 6.
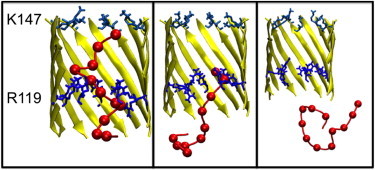
Dominant clusters in G119R mutant. Display scheme as previous, with R119 highlighted in darker blue. (Left) Cluster formed by interaction of the strand near its central region (away from termini) with R119. (Center) Cluster formed by tethering of base T12 to R119. (Right) Cluster in solution, formed by interaction of base A1 with mid-strand bases T8/C9.
We also studied a G119W mutant pore, to determine whether the observed DNA conformations were a result of electrostatic interactions or induced by the steric bulk of the residue side chains we had introduced in our mutant nanopores. The ssDNA in simulations of the G119W mutant shows two broad conformations: i), those with the ssDNA entirely within the pore in an extended configuration but only partly translocating beyond W119 (67% or 400 ns of simulation time), a representative snapshot is shown in Fig. 7 A. In this conformation the ssDNA remains relatively straight. Conformation ii), has the strand interacting mostly with the upper surface of the pore, but with part of the strand in contact with W119 (25% or 150 ns of simulation time), a representative snapshot is shown in Fig. 7 B. In the case of the ssDNA blocked within the pore, it appears that the steric bulk of the tryptophan prevents or at least slows ssDNA translocation. In two of the six simulations, bases A1 and C2 have partially threaded through the W119 ring of residues after 100 ns of simulation. However, ssDNA translocation through the entire length of the pore was not observed in any simulation. Extension of the simulations to 200 ns did not reveal any further translocation. In the second type of conformation, in which the ssDNA interacted with the upper surface of the pore, the middle of the strand formed multiple interactions with the ring of K147 residues at the upper surface of the pore. This interaction is not observed in most other mutants, and may be a consequence of the 5′ end being unable to translocate beyond the ring formed by the ring of W119 residues.
Figure 7.
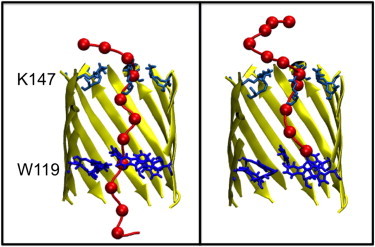
Dominant clusters in G119W mutant. Display scheme as previous. (Left) Cluster formed by interaction of the central region of the DNA strand with K147. (Right) Cluster formed by strand after first bases have passed beyond W119. This cluster is representative of the maximum distance that ssDNA translocates through this mutant.
Discussion
Evaluation of DNA parameter sets
Some exploration of the available parameter sets for treatment of DNA was necessary given the paucity of available information in the literature for ssDNA parameters compared to those for dsDNA. Our simulations of ssDNA with the initial coordinates extracted from the x-ray structure of a double strand in the B-DNA form indicate that the AMBER force fields have a propensity to maintain the helical backbone conformation for up to 80 ns; within the constraints of simulation timescale, this prohibits exploration of other conformations. Even when simulations are initiated from an extended DNA backbone, the AMBER potentials were sometimes observed to form conformations reminiscent of a double helix. Measurement of the phosphate-phosphate distances of the ssDNA backbone revealed that the values calculated from the DNA treated by the AMBER/ParmBSC0 parameters were closer to values expected for canonical double-stranded B-DNA. The observations from both sets of simulations suggest that the AMBER and ParmBSC0 parameter sets are optimized for dsDNA such that they may not be suitable for treating ssDNA.
ssDNA simulated using the CHARMM and GROMOS parameter sets gave results that were similar to each other, but distinct from the AMBER and ParmBSC0 parameters. Encouragingly, they did not retain the original conformation of the ssDNA backbone beyond ∼10 ns. Random structures were formed with some hydrogen-bonding between bases, but the hairpin-like structures observed with the Amber-based parameters were not observed. The GROMOS parameters were employed for subsequent simulation of ssDNA with model protein nanopores.
ssDNA conformations and translocation behavior
Analysis of the ssDNA conformations within the confined geometry of the nanopores revealed several trends. First, the introduction of charged residues within a pore causes considerable deformation of the ssDNA. This deformation appears to be a direct result of contact between the ssDNA and the mutated residue in the pore. In particular, the differences between the WT and both the G119K/G119R barrels are clear: the dominant in-pore cluster for the WT pore is an extended strand, which can on occasion be partially folded. In comparison, in the charged barrels, folded DNA conformations dominate.
In both the WT and mutant pores interaction of ssDNA bases with the residues of the protein nanopore can disrupt the order in which the bases exit the pore. Although this phenomenon was observed in at least one simulation of all of the nanopores we simulated, it was more pronounced in the charged mutant pores because the order of bases upon exit from the nanopore was not preserved in any of the simulations of these mutant pores. It seems reasonable that the presence of additional charged residues within the barrel serve as an extra site for electrostatic interaction with base A1, which then allows the subsequent bases to pass with relative ease. We note that even in simulations of the WT model nanopore correct ordering of the bases as they exit the pore was only preserved for two in six of the simulations.
Often, the interaction of just one base with the nanopore residues can alter the average translocation time per base substantially. Indeed, longer average translocation times are usually indicative of a staggered mechanism, whereby the ssDNA does not move through the pore at a constant velocity but rather sticks to the inside of the pore, usually through interaction with charged or polar residues, particularly through interaction with K147 at the pore entrance. For example, in the simulation in which the average translocation time per base was 4 ns, bases G11 and T12 remain hydrogen-bonded with K147 for ∼45 ns (see the Supporting Material). In other simulations the interactions is predominantly between lysine residues and the ssDNA backbone phosphate groups, and thus is purely electrostatic. This nonconstant translocation velocity was also reported from simulations of ssDNA in the full-length α-HL protein (19).
The G119W pore also reveals some insight into the mechanism of translocation. Although both the G119R and G119W mutant pores have similar dimensions, W119 acts as a physical barrier to translocation, such that any coiling of the ssDNA occurs above rather than around this residue. The discrepancy in behaviors despite similar pore dimensions is explained by the effect of the electric field on arginine: when the field is active, the arginine side chains follow the direction of the field, pointing upward and thus effectively opening the pore. As the tryptophan side chains are neutral and less flexible, the pore dimensions remain narrower. Once the DNA has translocated beyond W119, however, it generally maintains a more extended conformation, compared to the ssDNA conformation once it has passed R119 in the G119R mutant. Furthermore, base A1 of the strand does not remain in contact with the ring of tryptophan residues in G119W, unlike the arginine residues in G119R. The hydrophobic character of the tryptophan ring could also be a contributor to the lack of translocation, as there are no positive or polar groups to counter the charges on the ssDNA backbone.
Both the G119K and G119R mutant pores show similar properties in terms of ssDNA translocation, which is perhaps unsurprising given that both feature charged residues. However, it appears as though the arginine mutant forms a stronger interaction with the ssDNA, with hydrogen bonds and charge-charge interactions forming between the R119 ring and the ssDNA in some 73% of the total simulation time. G119K, by contrast, forms these interactions for ∼65% of total simulation time. Both mutants also show enhanced staggered translocation characteristics. Although the WT model can show some staggered translocation as a result of the strand interacting with K147, both charged mutants add an extra interaction site and apparently decrease the frequency of fast, nonstaggered translocation events. Visual inspection of the trajectory revealed that this staggered translocation is a consequence of the interaction of the ssDNA with the rings of positive charges formed by both lysine and arginine within the pore. When the interaction between the tail end of the ssDNA and these charged residues is disrupted, it allows further progression of the ssDNA through the pore. This is an example of the binding and sliding mechanism described in (13).
The induced conformational changes in ssDNA observed in the charged nanopores could have consequences for the reliability of sequencing a strand. This is particularly true when the ssDNA forms a loop structure after remaining in contact with a ring of charged residues, either arginine or lysine. The leading end of the strand can form interactions with these charged residues. Consequently, the electrostatic interaction between the two leads to tethering of the 5′ end of the strand for some tens of nanoseconds. The following bases can pass through while the leading end remains in the same position; as such, the order that the bases exit the pore is not necessarily the order in which they enter. Thus, our results show that more than one base can occupy the mouth of the barrel; we note that simulation studies of the full protein have also reported similar behavior (19). This has clear consequences for the read accuracy, particularly if this deformation occurs before the site where the current measurement is taken.
It is useful to consider the limitations of the current study. We have studied a relatively short ssDNA molecule for computational efficiency. The conformational response of the ssDNA to interaction with the side chains of the protein nanopores, and subsequent effect on the sequence of bases that exit the pore observed in our simulations may be more amplified by the short length of the strand; i.e., the ends of the strand are always in close proximity to the center of mass of the strand. Longer strands are likely to be used with DNA sequencing devices, and thus it would be useful to study the effect of the strand length on ssDNA conformational dynamics in a future study.
Conclusion
We have shown that the protein side chains present within the barrel of α-hemolysin have a direct effect on the conformations adopted by a single DNA strand as it moves through the nanopore, under an applied electric field. The folded conformations resulting from interaction, usually with basic side chains can lead to exit of the ssDNA in a nonlinear conformation, such that the first base to enter the nanopore is not the first base to exit. Therefore, the ssDNA sequence detected will be altered. Thus, our results suggest that for accurate ssDNA sequence readouts at the ssDNA termini, it is important to maintain the strand in a near-linear conformation.
Acknowledgments
We acknowledge use of the University of Southampton high performance computing resource, Iridis3.
Andrew Guy is funded by Oxford Nanopore Technologies.
Supporting Material
References
- 1.du Plessis D.J.F., Nouwen N., Driessen A.J.M. The Sec translocase. Biochim. Biophys. Acta. 2011;1808:851–865. doi: 10.1016/j.bbamem.2010.08.016. [DOI] [PubMed] [Google Scholar]
- 2.Carmody S.R., Wente S.R. mRNA nuclear export at a glance. J. Cell Sci. 2009;122:1933–1937. doi: 10.1242/jcs.041236. [DOI] [PMC free article] [PubMed] [Google Scholar]
- 3.Bayley H., Cremer P.S. Stochastic sensors inspired by biology. Nature. 2001;413:226–230. doi: 10.1038/35093038. [DOI] [PubMed] [Google Scholar]
- 4.Dekker C. Solid-state nanopores. Nat. Nanotechnol. 2007;2:209–215. doi: 10.1038/nnano.2007.27. [DOI] [PubMed] [Google Scholar]
- 5.Kasianowicz J.J., Brandin E., Deamer D.W. Characterization of individual polynucleotide molecules using a membrane channel. Proc. Natl. Acad. Sci. USA. 1996;93:13770–13773. doi: 10.1073/pnas.93.24.13770. [DOI] [PMC free article] [PubMed] [Google Scholar]
- 6.Song L., Hobaugh M.R., Gouaux J.E. Structure of staphylococcal alpha-hemolysin, a heptameric transmembrane pore. Science. 1996;274:1859–1866. doi: 10.1126/science.274.5294.1859. [DOI] [PubMed] [Google Scholar]
- 7.Clarke J., Wu H.-C., Bayley H. Continuous base identification for single-molecule nanopore DNA sequencing. Nat. Nanotechnol. 2009;4:265–270. doi: 10.1038/nnano.2009.12. [DOI] [PubMed] [Google Scholar]
- 8.Maglia G., Restrepo M.R., Bayley H. Enhanced translocation of single DNA molecules through α-hemolysin nanopores by manipulation of internal charge. Proc. Natl. Acad. Sci. USA. 2008;105:19720–19725. doi: 10.1073/pnas.0808296105. [DOI] [PMC free article] [PubMed] [Google Scholar]
- 9.Bhattacharya S., Derrington I.M., Aksimentiev A. Molecular dynamics study of MspA arginine mutants predicts slow DNA translocations and ion current blockades indicative of DNA sequence. ACS Nano. 2012 doi: 10.1021/nn3019943. published online. [DOI] [PMC free article] [PubMed] [Google Scholar]
- 10.Rincon-Restrepo M., Mikhailova E., Maglia G. Controlled translocation of individual DNA molecules through protein nanopores with engineered molecular brakes. Nano Lett. 2011;11:746–750. doi: 10.1021/nl1038874. [DOI] [PMC free article] [PubMed] [Google Scholar]
- 11.Astier Y., Braha O., Bayley H. Toward single molecule DNA sequencing: direct identification of ribonucleoside and deoxyribonucleoside 5′-monophosphates by using an engineered protein nanopore equipped with a molecular adapter. J. Am. Chem. Soc. 2006;128:1705–1710. doi: 10.1021/ja057123+. [DOI] [PubMed] [Google Scholar]
- 12.Murphy M.C., Rasnik I., Ha T. Probing single-stranded DNA conformational flexibility using fluorescence spectroscopy. Biophys. J. 2004;86:2530–2537. doi: 10.1016/S0006-3495(04)74308-8. [DOI] [PMC free article] [PubMed] [Google Scholar]
- 13.Bond P.J., Guy A.T., Khalid S. Molecular dynamics simulations of DNA within a nanopore: arginine-phosphate tethering and a binding/sliding mechanism for translocation. Biochemistry. 2011;50:3777–3783. doi: 10.1021/bi101404n. [DOI] [PMC free article] [PubMed] [Google Scholar]
- 14.Khalid S., Hannon M.J., Rodger P.M. Simulations of DNA coiling around a synthetic supramolecular cylinder that binds in the DNA major groove. Chemistry. 2006;12:3493–3506. doi: 10.1002/chem.200501168. [DOI] [PubMed] [Google Scholar]
- 15.García-Fandiño R., Sansom M.S. Designing biomimetic pores based on carbon nanotubes. Proc. Natl. Acad. Sci. USA. 2012;109:6939–6944. doi: 10.1073/pnas.1119326109. [DOI] [PMC free article] [PubMed] [Google Scholar]
- 16.Mathé J., Aksimentiev A., Meller A. Orientation discrimination of single-stranded DNA inside the alpha-hemolysin membrane channel. Proc. Natl. Acad. Sci. USA. 2005;102:12377–12382. doi: 10.1073/pnas.0502947102. [DOI] [PMC free article] [PubMed] [Google Scholar]
- 17.Mirsaidov U., Comer J., Timp G. Slowing the translocation of double-stranded DNA using a nanopore smaller than the double helix. Nanotechnology. 2010;21:395501. doi: 10.1088/0957-4484/21/39/395501. [DOI] [PMC free article] [PubMed] [Google Scholar]
- 18.Martin H., Jha S., Coveney P. Determination of free energy profiles for the translocation of polynucleotides through α-hemolysin nanopores using non-equilibrium molecular dynamics simulations. J. Chem. Theory Comput. 2009;5:2135–2148. doi: 10.1021/ct9000894. [DOI] [PubMed] [Google Scholar]
- 19.Wells D.B., Abramkina V., Aksimentiev A. Exploring transmembrane transport through α-hemolysin with grid-steered molecular dynamics. J. Chem. Phys. 2007;127:125101. doi: 10.1063/1.2770738. [DOI] [PMC free article] [PubMed] [Google Scholar]
- 20.Wang J., Cieplak P., Kollman P. How well does a restrained electrostatic potential (RESP) model perform in calculating conformational energies of organic and biological molecules? J. Comput. Chem. 2000;21:1049–1074. [Google Scholar]
- 21.Pérez A., Marchán I., Orozco M. Refinement of the AMBER force field for nucleic acids: improving the description of α/γ conformers. Biophys. J. 2007;92:3817–3829. doi: 10.1529/biophysj.106.097782. [DOI] [PMC free article] [PubMed] [Google Scholar]
- 22.Feller S.E., MacKerell A.D. An improved empirical potential energy function for molecular simulations of phospholipids. J. Phys. Chem. B. 2000;104:7510–7515. [Google Scholar]
- 23.Oostenbrink C., Villa A., van Gunsteren W.F. A biomolecular force field based on the free enthalpy of hydration and solvation: the GROMOS force-field parameter sets 53A5 and 53A6. J. Comput. Chem. 2004;25:1656–1676. doi: 10.1002/jcc.20090. [DOI] [PubMed] [Google Scholar]
- 24.Drew H.R., Wing R.M., Dickerson R.E. Structure of a B-DNA dodecamer: conformation and dynamics. Proc. Natl. Acad. Sci. USA. 1981;78:2179–2183. doi: 10.1073/pnas.78.4.2179. [DOI] [PMC free article] [PubMed] [Google Scholar]
- 25.Hess B., Kutzner C., Lindahl E. GROMACS 4: algorithms for highly efficient, load-balanced, and scalable molecular simulation. J. Chem. Theory Comput. 2008;4:435–447. doi: 10.1021/ct700301q. [DOI] [PubMed] [Google Scholar]
- 26.Case D.A., Darden T.A., Roberts B.P. University of California; San Francisco, CA: 2010. Amber 11. [Google Scholar]
- 27.Darden T., York D., Pedersen L. Particle mesh Ewald - an n.log(n) method for Ewald sums in large systems. J. Chem. Phys. 1993;98:10089–10092. [Google Scholar]
- 28.Lange O.F., van der Spoel D., de Groot B.L. Scrutinizing molecular mechanics force fields on the submicrosecond timescale with NMR data. Biophys. J. 2010;99:647–655. doi: 10.1016/j.bpj.2010.04.062. [DOI] [PMC free article] [PubMed] [Google Scholar]
- 29.Humphrey W., Dalke A., Schulten K. VMD: visual molecular dynamics. J. Mol. Graph. 1996;14:33–38. doi: 10.1016/0263-7855(96)00018-5. 27–28. [DOI] [PubMed] [Google Scholar]
- 30.Rozenberg H., Rabinovich D., Shakked Z. Structural code for DNA recognition revealed in crystal structures of papillomavirus E2-DNA targets. Proc. Natl. Acad. Sci. USA. 1998;95:15194–15199. doi: 10.1073/pnas.95.26.15194. [DOI] [PMC free article] [PubMed] [Google Scholar]
- 31.Daura X., Gademann K., Mark A.E. Peptide folding: when simulation meets experiment. Angew. Chem. Int. Ed. 1999;38:236–240. [Google Scholar]
- 32.Ricci C.G., de Andrade A.S., Netz P.A. Molecular dynamics of DNA: comparison of force fields and terminal nucleotide definitions. J. Phys. Chem. B. 2010;114:9882–9893. doi: 10.1021/jp1035663. [DOI] [PubMed] [Google Scholar]
- 33.Sali A., Blundell T.L. Comparative protein modelling by satisfaction of spatial restraints. J. Mol. Biol. 1993;234:779–815. doi: 10.1006/jmbi.1993.1626. [DOI] [PubMed] [Google Scholar]
- 34.Zheng G., Lu X.J., Olson W.K. Web 3DNA—a web server for the analysis, reconstruction, and visualization of three-dimensional nucleic-acid structures. Nucleic Acids Res. 2009;37(Web Server issue) doi: 10.1093/nar/gkp358. W240–6. [DOI] [PMC free article] [PubMed] [Google Scholar]
- 35.Bjelkmar P., Larsson P., Lindahl E. Implementation of the CHARMM force field in GROMACS: analysis of protein stability effects from correction maps, virtual interaction sites, and water models. J. Chem. Theory Comput. 2010;6:459–466. doi: 10.1021/ct900549r. [DOI] [PubMed] [Google Scholar]
- 36.Rich A. The rise of single-molecule DNA biochemistry. Proc. Natl. Acad. Sci. USA. 1998;95:13999–14000. doi: 10.1073/pnas.95.24.13999. [DOI] [PMC free article] [PubMed] [Google Scholar]
Associated Data
This section collects any data citations, data availability statements, or supplementary materials included in this article.