

Abstract
Gene and protein expression changes observed with tumorigenesis are often interpreted independently of each other and out of context of biological networks. To address these limitations, this study examined several approaches to integrate transcriptomic and proteomic data with known protein-protein and signaling interactions in estrogen receptor positive (ER+) breast cancer tumors. An approach that built networks from differentially expressed proteins and identified among them networks enriched in differentially expressed genes yielded the greatest success. This method identified a set of genes and proteins linking pathways of cellular stress response, cancer metabolism, and tumor microenvironment. The proposed network underscores several biologically intriguing events not previously studied in the context of ER+ breast cancer, including the overexpression of p38 mitogen-activated protein kinase and the overexpression of poly(ADP-ribose) polymerase 1. A gene-based expression signature biomarker built from this network was significantly predictive of clinical relapse in multiple independent cohorts of ER+ breast cancer patients, even after correcting for standard clinicopathological variables. The results of this study demonstrate the utility and power of an integrated quantitative proteomic, transcriptomic, and network analysis approach to discover robust and clinically meaningful molecular changes in tumors.
Breast cancer is a complex disease driven by multiple genomic, gene regulatory, proteomic, and metabolomic changes. In the post-genome era, the study of breast cancer has been partly driven by high throughput technologies that allow global profiling of “-omic” alterations in tumor tissue. These technologies enable unbiased searches for molecular events that drive tumor biology and inform prognosis and therapy.
The most widely applied of these technologies, transcriptomic profiling, has yielded multiple gene expression signatures associated with breast tumorigenesis, tumor subtype, and metastatic potential (1–3). Array comparative genomic hybridization (4) and single-nucleotide polymorphism microarrays (5) have been used to identify key somatic amplification and deletion events in breast cancer and guide molecular pathological classification. Ongoing whole genome and whole exome next generation sequencing studies are providing unbiased glimpses into the mutational landscape of breast cancer (6–8). A rapidly developing -omic technology that has shown promising application in breast cancer is MS-based proteomic analysis (9–16).
An important challenge, common to all -omic analyses of solid tumors, is the presence of nonmalignant or stromal cell admixture. Varying levels of nonmalignant cells can confound normal to tumor comparisons, distorting the effect of amplification/overexpression and deletion/underexpression of genes and proteins in the cancer cell population (17). This problem can be addressed by laser capture microdissection (LCM),1 a technology that allows for the molecular analysis of highly enriched populations of distinct cell types within a complex tissue sample (18, 19). LCM, however, yields a small number of cells (e.g. numbering in the ten thousands), the molecular interrogation of which requires highly sensitive analytical methods. We have overcome these barriers in previous studies, producing both proteomic and transcriptomic characterization of breast cancer using LCM-enriched tumor and normal samples (14, 20).
Once the technical challenges to experimental data acquisition are overcome, -omic profiling data pose both opportunities and difficulties in their interpretation. Although these profiles can offer a comprehensive picture of a disease state relative to healthy tissue, their analysis often yields long lists of molecular changes that are difficult to interpret. This difficulty is compounded when the profiling data are obtained from multiple platforms (e.g. genomic, transcriptomic, and proteomic) that require additional integration of complex molecular signals. Novel bioinformatics techniques are required to overcome these challenges and realize the potential of -omic technologies to shed light on fundamental disease biology.
Having obtained in two previously published studies both proteomic and transcriptomic profiles of estrogen receptor positive (ER+) invasive breast carcinoma, a subtype that constitutes ∼70% of all invasive human breast cancers diagnosed worldwide, we sought to integrate and interpret these data in a clinically and biologically meaningful manner (14, 20). We first investigated whether proteomic and transcriptomic profiles obtained from independent tumor versus normal purified breast epithelium sample sets yielded a concordant picture of breast cancer disease biology. We then examined three approaches for integrating these profiles with annotated biological networks to discover sets of genes and proteins associated with breast tumorigenesis (network discovery phase; Fig. 1, a–c). Finally, we investigated the ability of these gene sets to predict relapse in independent breast cancer clinical cohorts (prognostic validation phase; Fig. 1d).
Fig. 1.

Panels a–c depict the three approaches we took to integrate our proteomic and transcriptomic differential expression data sets with annotated biological networks. a, Approach 1 applied network analysis on the list of significantly differentially expressed genes whose corresponding proteins were also differentially expressed in NBE and MBE. b and c, Approaches 2 (gene-centric NSEA) and 3 (protein-centric NSEA) built networks in either the transcriptomic or proteomic data set, respectively, and chose among these the subset enriched in differentially expressed proteins or genes, respectively. Black and white arrows in the histological tissue sections denote NBE and IBC epithelium, respectively. d, shows the clinical validation approach we used to test gene expression clinical classifiers based on networks generated by Approaches 1–3 using independent training and validation cohorts of ER+ breast cancer patients. The numbers alongside each test and training data set indicate the number of ER+ patients used in the analysis from each in each cohort.
In the network discovery phase of our analysis, we explored three related approaches to identify sets of functionally linked molecules with significantly different gene and protein expression in highly enriched malignant breast epithelium (MBE) from invasive breast carcinoma (IBC) versus normal breast epithelium (NBE). The first approach built networks from proteins that were significantly differentially expressed at both the transcriptomic and proteomic level (Fig. 1a). The second, “gene-centric” approach built networks from differentially expressed genes and identified those networks that were significantly enriched in differentially expressed proteins (Fig. 1b). The third, “protein-centric” approach built networks from differentially expressed proteins and scored these networks for their enrichment in differentially expressed genes (Fig. 1c).
In the prognostic validation phase of our analysis (Fig. 1d), the gene sets underlying significantly altered networks were subsequently trained and tested as prognostic classifiers in large sets of publicly available and clinically annotated ER+ breast cancer gene expression data. After permutation analysis, only the “protein-centric” integration approach produced a classifier that was significantly predictive of relapse in these independent cohorts. This classifier was predictive despite the fact that these clinical expression data were generated from unpurified, stromally contaminated tumor tissue collected from clinically heterogeneous breast cancer cases.
In summary, this study provides motivation and outlines a framework for the integrated analysis of protein and gene expression cancer profiling data. The results suggest that the analysis of global molecular changes in small sample sets of microdissected primary tumor cells can uncover alterations relevant to large independent cohorts of complex tumor tissue samples. Finally, this study uncovers a novel molecular signature that yields potential insight into the biology of breast cancer tumorigenesis and relapse.
MATERIALS AND METHODS
Proteomic Specimen Acquisition and Processing
Proteomic data used in the network discovery phase were previously published (14). Briefly, NBE and MBE samples were obtained by LCM from each of nine different mammoplasty reduction specimens from women without a history of breast cancer and from each of nine different ER+ IBC samples, respectively (see Tables I and II for clinical characteristics of tumor and normal specimens used in the proteomic analysis) (14). Approximately 60,000 cells were isolated per tissue sample by LCM and individually subjected to MS-based shotgun proteomics analyses. For peptide/protein identification, acquired MS/MS scans were searched against the Swiss-Prot human database by using a SEQUEST algorithm. Identified proteins were grouped by using ProteinProphet (Institute for Systems Biology) (21). The spectral index (SpI) was calculated from normalized spectral counts to determine proteins with differential abundance between normal and malignant specimens. Sample label permutation analysis of SpI was performed to identify differentially abundant proteins, using a nominal two-tailed p value threshold of 0.01 (|SpI| > 0.556) to determine significance. Further details of sample acquisition and data processing for proteomic analysis can be found in Ref. 14.
Table I. Characteristics of patients with invasive breast carcinoma used in the proteomic analysis.
IBC specimens were used with LCM to procure MBE in the proteomic analysis (14). The table was adapted from Ref. 14. Neg, negative; Pos, positive.
| Sample ID | Case ID | Age | Tumor type | Size (cm) | Grade | LN | ER | PR | HER2 status |
|---|---|---|---|---|---|---|---|---|---|
| MBE1 | 155–2 | 64 | Ductal | 1.1 | 2 | Neg | Pos | Pos | Neg |
| MBE2 | 153–2 | 46 | Ductal | 1.6 | 1 | Pos | Pos | Pos | Pos |
| MBE3 | 128–3 | 79 | Lobular | 5 | 2 | Pos | Pos | Pos | Neg |
| MBE4 | 171–1 | 39 | Ductal | 2.8 | 2 | Neg | Pos | Pos | Neg |
| MBE5 | 130–2 | 54 | Ductal | 6.5 | 2 | Pos | Pos | Pos | Neg |
| MBE6 | 98–2 | 31 | Ductal | 1.7 | 3 | Pos | Pos | Pos | Neg |
| MBE7 | 122–3 | 45 | Ductal | 1.7 | 2 | Neg | Pos | Pos | Neg |
| MBE8 | 193–2 | 45 | Ductal | 1.5 | 1 | Pos | Pos | Pos | Neg |
| MBE9 | 169–1 | 34 | Ductal | 2.6 | 3 | Pos | Pos | Pos | Neg |
Table II. Characteristics of patients with normal breast specimens used in the proteomic analysis mammoplasty specimens were used with LCM to procure NBE in the proteomic analysis (14). The table was adapted from Ref. 14.
| Sample ID | Case ID | Age | Specimen type |
|---|---|---|---|
| NBE1 | 215–4 | 30 | RM |
| NBE2 | 279–1 | 18 | RM |
| NBE3 | 224–4 | 21 | RM |
| NBE4 | 222–6 | 24 | RM |
| NBE5 | 225–6 | 30 | RM |
| NBE6 | 295–4 | 25 | RM |
| NBE7 | 320–5 | 38 | RM |
| NBE8 | 331–8 | 22 | RM |
| NBE9 | 335–6 | 34 | RM |
Gene Expression Data
For the network discovery phase of our analysis, we used gene expression data that was previously published (20). Briefly, these data represent seven pairs of patient-matched LCM-purified MBE samples from IBC and NBE samples that were assayed on the Affymetrix U133X3P platform (see Table III for clinical characteristics); these samples are a subset of the patients reported in Ref. 20, corresponding to MBE samples and patient-matched NBE samples from the estrogen receptor positive (ER+) IBC specimens in the cohort). 13 of these 14 samples were obtained from patients not assayed in the proteomic analysis (the tumor sample from patient 153 was assayed in both transcriptomic and proteomic analyses). Additional details of sample acquisition and expression measurement can be found in Ref. 20. We renormalized the data in Ref. 20 from raw CEL files as described below.
Table III. Patient-matched MBE and NBE samples employed in the transcriptomic analysis.
Each row of the table represents a patient-matched tumor normal pair. The table was adapted from Ref. 14. N/A, not available; ND, not determined.
| Patient number | Age (years) | Grade | Estrogen receptor | Progesterone receptor | Her-2 | Size | Nodal status | Tumor type |
|---|---|---|---|---|---|---|---|---|
| 44 | 28 | III | Positive | Positive | Negative | 1 | Negative | Ductal |
| 45 | 36 | I | Positive | Positive | Negative | N/A | Negative | Ductal |
| 79 | 54 | I | Positive | Positive | Negative | 2.1 | Positive | Ductal |
| 102 | 55 | I | Positive | Negative | Negative | 5.2 | Positive | Ductal |
| 121 | 45 | II | Positive | Positive | Positive | 1.5 | Positive | Ductal |
| 148 | 42 | II | Positive | Positive | Negative | 1.9 | Positive | Ductal |
| 153 | 46 | I | Positive | Positive | ND | N/A | Positive | Ductal |
For the prognostic validation phase of our analysis, we used five clinically annotated gene expression data sets (22–26). These data sets were culled from Gene Expression Omnibus (http://www.ncbi.nlm.nih.gov/geo/), NCI caArray (https://array.nci.nih.gov/caarray/home.action), and the NKI website. Gene Expression Omnibus data sets used in the analysis were obtained via identifiers GSE2990 (22), GSE4922 (23), and GSE2034 (24) from the Gene Expression Omnibus website (http://www.ncbi.nlm.nih.gov/geo/). Expression data for the NKI295 breast cancer gene expression study (25) was obtained via the NKI website (http://bioinformatics.nki.nl/data.php). Expression data for Ref. 26 was obtained from the NCI caArray website (https://cabig.nci.nih.gov/tools/caArray) via identifier gray-00248. Only arrays that were directly collected and generated in the cited publications (22–26) were used, and no duplicate samples were noted to be present from both careful analysis of the data pedigree in the source publications and clustering analysis of expression profiles (not shown).
Only ER+ patients in each cohort were used for the analysis, comprising 149, 211, 209, 203, and 65 patients for the data sets in Refs. 22, 23, 24, 25, and 26, respectively. Survival measures (distant metastasis-free survival, relapse-free survival, and disease-free survival), censure times, and additional clinical covariates (age, tumor grade, tumor size, lymph node metastasis, and systemic therapy) were also obtained for each data set depending on their availability. All of these data sets, except that in Ref. 25, were profiled on an Affymetrix oligonucleotide array platform; the data set in Ref. 25 was assayed on an Agilent oligonucleotide array platform. All of the patient samples in these published clinical data sets were obtained from treatment-naïve post-surgical bulk tumor (i.e. nonmicrodissected) samples, although a subset of the patients in all cohorts with the exception of (24) underwent post-operative (i.e. adjuvant) systemic therapy. The study identifiers, cohort of origin, array platform, and clinical covariate values of all clinical samples analyzed in the prognostic validation stage of our study are provided as supplemental data.
For each gene expression data set, the data were acquired as CEL files and reprocessed using the affyrma package in MATLAB (Mathworks Inc., Natick, MA) and the Bioconductor affy package (http://www.bioconductor.org/) in R using custom chip definition files obtained from the BrainArray website (http://brainarray.mbni.med.umich.edu/Brainarray/Database/CustomCDF/CDF_download.asp)(27). Probe sets achieving fewer than 20% MAS5 present calls in any single data set (via the R function mas5calls) were removed from subsequent analyses. For the MBE versus NBE comparison of the data in Ref. 20, differential expression was determined using a t test with a q value threshold of 0.05 (nominal p < 0.0089) (Note that the q value for a gene is the false discovery rate that is implied by setting a significance threshold equal to the p value of that gene (28).) The choice of a t test, as opposed to the use of limma (which was used in the original analysis of Ref. 20 to quantify differential expression), was chosen to yield a simple test statistic to facilitate downstream set-based enrichment analyses.
Gene-Protein Set Concordance Enrichment Analysis
Gene set enrichment analysis (GSEA) was adapted to evaluate the concordance of differential gene and protein profiles of breast cancer data (29). Restricting the analysis to 1236 genes/proteins identified and quantitated on both proteomic and transcriptomic platforms, a gene/protein “concordance score” was computed by multiplying the t statistic (from the gene expression analysis) with SpI (from the proteomic analysis). This score reflected the magnitude and direction of the concordance (i.e. agreement) of observed gene and protein expression changes, with a positive score indicating concordance (gene up, protein up or gene down, protein down) and a negative score indicating discordance (gene down, protein up or gene up, protein down) of a gene/protein pair. The above genes/proteins were mapped to the MSigDB collection v.2.5 (http://www.broadinstitute.org/gsea/msigdb/index.jsp), and sets with fewer than 15 genes/proteins were removed. For each gene/protein set, an enrichment score (ES) was computed as a weighted running sum statistic over the concordance score. The ES was then recomputed for each gene set across 20,000 random shufflings of “tumor” (MBE) and “normal” (NBE) labels of samples in both proteomic and transcriptomic data sets and rescaled to yield a distribution of normalized enrichment scores (NESs). As in Ref. 29, the histogram of NES across all genes/protein sets and permutations was used to derive a background distribution for concordance enrichment, from which p and q values were computed. All of the computations were performed in MATLAB (Mathworks Inc.).
Network Set Enrichment Analysis (NSEA)
NSEA was developed to uncover biological pathways with both altered protein and gene expression in the tumor samples. Two versions of this approach were implemented (gene-centric and protein-centric NSEA), both employing Ingenuity Pathway Analysis (v8.8, content version 3204, http://www.ingenuity.com/) and a GSEA-like statistic to quantify enrichment (29). Gene-centric NSEA uses IPA to uncover biological networks significantly enriched in differentially expressed genes and chooses among these a subset of networks that is significantly enriched in differentially expressed proteins. A protein-centric version of NSEA employs IPA to uncover biological networks significantly enriched in differentially expressed proteins and chooses among these a subset of networks that is significantly enriched in differentially expressed genes. NSEA is closely related to GSEA, using Ingenuity network-derived gene and protein lists in place of manually curated gene sets and unsigned phenotype correlation statistics (Pearson r2, |SpI|) instead of the signal-to-noise or Pearson r statistics used in GSEA (29). The NSEA algorithm is described in more detail below and is also depicted in a “road map” shown in supplemental Fig. 1. To explain gene-centric and protein-centric NSEA compactly, parentheses are used to denote the “reverse” analysis, i.e. genes to proteins (proteins to genes).
Significantly altered genes (proteins) from the transcriptomic (proteomic) analysis of LCM-enriched MBE versus NBE were inputted into IPA with standard settings (using all molecules, all direct/indirect relationships, network size of 35) to obtain an “observed” collection of enriched biological networks. A background collection of 50 (500) additional gene (protein) lists was obtained through sample label permutation of the transcriptomic (proteomic) data set, choosing genes (proteins) with p < 0.0089 (|SpI| > 0.556) from each permutation. These permuted gene (protein) lists were also inputted into the Ingenuity Pathway Analysis tool to obtain a background collection of 500–1000 networks enriched in differentially expressed genes (proteins) from phenotype label-permuted data sets. The range of 500–1000 was chosen to be on the order of the size of the standard pathway collections used for GSEA (e.g. MSigDB).
Network collections derived from observed and permuted transcriptomic (proteomic) data were tested for proteomic (transcriptomic) enrichment against the LCM-enriched malignant breast epithelium versus normal epithelium protein (gene) expression data set using a weighted Kolmogorov-Smirnov-like ES for each network (29). In this step, |SpI| (Pearson r2) values were computed for all proteins (transcripts) in the breast protein (gene) expression data set of correlation with NBE versus MBE phenotypic status. For each observed or background network, an ES was computed as the maximum of a weighted running sum statistic of ranked |SpI| (r2) values corresponding to proteins (genes) encoding nodes in the given network. An unsigned score, i.e. |SpI| (r2), was chosen as correlation metric to capture networks enriched in both up-regulated and down-regulated proteins (genes). This score was then recomputed across 20,000 permutations of tumor (MBE) and normal (NBE) sample labels in the protein (gene) expression data set to yield a background ES distribution for each set. ESs were Z-transformed across all phenotype label permutations for each network set to yield NESs. The histogram of NES across all network sets and phenotype label permutations was used to derive a null distribution for network set enrichment. Each observed network set was superimposed on this null distribution to obtain a one-tailed permutation p value for proteomic (transcriptomic) enrichment. p values were Bonferonni-corrected by a factor corresponding to the number of observed networks. Networks with p < 0.05 following the Bonferonni correction were determined to be significantly enriched in the proteomic (transcriptomic) data set. NSEA was restricted to gene (protein) sets that had more than five genes (proteins) measured in the transcriptomic (proteomic) data set, because small sets may distort the background distribution of NESs, as discussed in Ref. 29. All of the computations were performed in MATLAB (v7.9.0; Mathworks Inc.; http://www.mathworks.com).
Prognostic Classifier Validation
Networks enriched in significantly altered genes and proteins were tested for their ability to prognostically stratify the patients in data sets of Refs. 22–26 on the basis of gene expression. Each network was mapped to a set of genes on each expression array via the Entrez Gene ID and Hugo Symbols provided with the Ingenuity output file and the gene mappings bundled with the Affymetrix chip definition files (22–24, 26) or UniGene identifiers provided with the text output of (25). A support vector machine classifier with a linear kernel was trained on 5-year distant metastasis-free survival in ER+ patients from Ref. 22 and tested in ER+ patients from Refs. 23–26. Briefly, this classifier consisted of a threshold on a weighted sum of gene expression values; a patient whose score fell above or below the threshold was, respectively, assigned a “good” or “poor” prognostic category label by the classifier. The support vector machine algorithm determined the optimal weights and threshold for the classifier during the training step. Z-transformed gene expression data were used as input into the classifier in both training and test sets.
The efficacy of the classifier was then validated against disease-free (DFS) and relapse-free survival (RFS) measures (DFS in Refs. 23, 25 and 26 and RFS in Ref. 24). DFS, RFS, and distant metastasis-free survival are closely related survival measures that refer to the time elapsed between diagnosis and the reappearance of breast cancer (including a second primary tumor), local or distant breast cancer metastasis, or distant metastasis, respectively, in a patient. The estimated hazard ratios of high risk versus low risk groups in each cohort and in meta-analysis across cohorts were determined using Cox regression; the hazard ratio is a standard metric used in clinical trials to quantify the effect of a grouping variable (e.g. risk stratification) on the rate of events (e.g. disease relapse) in a group of patients over the period of the study. For cohorts having additional clinical data (i.e. lymph node status, ER status, age, tumor size, grade, and treatment), the independent prognostic ability of each classifier subject to these additional covariates using multivariate Cox regression was also determined. We also computed receiver operator characteristic curves for each classifier and each test-cohort by varying the classifier threshold from a value in which all patients received a “Poor” to a value in which all patients received a “Good” prognosis label. Classifier labels were compared with the 5-year survival measure (DFS in (23), RFS in (24), DFS in (25), DFS in (26)) to compute the sensitivity and specificity of the test for each value of the classifier threshold. Receiver operator characteristic curves were computed by plotting sensitivity versus 1-specificity, and the areas under the curve (AUCs) were computed and reported. AUCs are measures of the efficacy of a binary classifier and vary between 0.5 and 1.
Permutation testing was applied to compare classifiers obtained from observed (i.e. network-derived) gene lists with random gene sets. For each observed gene list, random gene lists of the same size were chosen from the list of genes assayed on the training set microarray (22). Classifiers were trained on these random gene lists, and hazard ratios in the test cohorts were computed using Cox regression (± clinical covariates). A background distribution of hazard ratios from these 1000 random gene lists was computed, and the observed hazard ratios (either in meta-analysis or individual cohorts and either univariate or multivariate) were compared against the appropriate background distribution. All of the computations were performed in MATLAB (Mathworks Inc.).
RESULTS
Concordance of Differential Gene and Protein Expression in ER+ Invasive Breast Carcinoma
Global protein and gene expression were examined in two cohorts of laser capture microdissected ER+ breast cancer samples (Tables I–III). As noted above, both data sets have been previously published (14, 20): the proteomic data set was derived from LCM-enriched MBE from ER+ breast cancer patients and NBE from mammoplasty specimens of non-breast cancer patients (Tables I and II), whereas the transcriptomic data set consisted of patient-matched MBE and patient-matched NBE (Table III). Quality control filtering (see “Materials and Methods”) of gene expression data from seven ER+ IBC and patient-matched adjacent normal tissue yielded 9804 genes, of which 966 were differentially expressed between purified NBE and IBC cells (q < 0.05, Student's t test). (Note that these results differ from those presented in Ref. 20 because we are analyzing only ER+ IBC tissues and have used a different array normalization/quality control pipeline; see “Materials and Methods.”) Analysis of protein expression in nine ER+ MBE tumors and (non-patient matched) NBE samples yielded 1623 proteins, of which 121 were differentially expressed (|SpI| > 0.556).
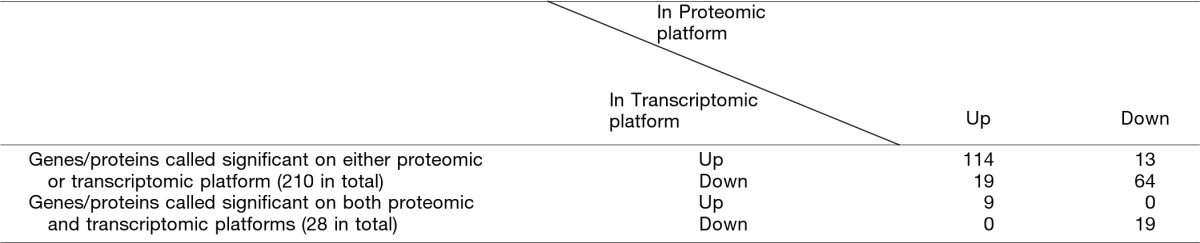
A total of 1236 genes-protein pairs were detected on both transcriptomic and proteomic platforms in the two cohorts. The normal-tumor differential expression of these genes/proteins as measured by the t statistic and SpI, respectively, is plotted in Fig. 2a. Global concordance of differential gene and protein expression was modest but highly significant (r2 = 0.19, p < 1 × 10⁻¹²). Moreover, there was a significant overlap between genes/proteins determined to be significantly differentially expressed on each platform (p < 5 × 10⁻⁸; Fisher's exact test). Examining the direction of differential expression (i.e. up versus down in tumor) in 210 genes/proteins called significant in either platform showed striking concordance (p < 1 × 10⁻¹²; Fisher's exact test; Table IV). Restricting the comparison with 28 genes/proteins called significant on both platforms showed 100% concordance in the direction of expression change (p = 1.21 × 10⁻⁷; Fisher's exact test; Table IV). These 28 genes/proteins are shown in supplemental Table 1.
Fig. 2.

Concordance of differential gene and protein expression in NBE and MBE epithelial samples. a, scatter plot of differential protein expression (SpI) and differential gene expression (t statistic) for 1236 genes/proteins measured on both transcriptomic and proteomic platforms. Each point represents a gene/protein. Points are colored according to whether the corresponding gene/protein is significant in none, one, or both of the genomic and proteomic data sets. b, gene-protein set concordance analysis results for 1015 MsigDB gene/protein sets plotted as a histogram of observed normalized concordance enrichment score (black) against the background distribution obtained through shufflings of tumor and normal sample labels (red). NES scores for gene-protein sets showing significant concordance (q < 0.25, NES > 1.36) are highlighted in blue. See “Materials and Methods” for details of the analysis.
Table IV. Concordance in up versus down expression of genes/proteins detected and called significant on either or both proteomic and transcriptomic platform.
Both show highly significant concordance (p < 1 × 10⁻¹² and p = 1.21 × 10⁻⁷, respectively, Fisher's exact test).
Finally, the pathway concordance of gene and protein differential expression was investigated using the MSigDB database and gene-protein set concordance enrichment analysis, analogous to GSEA. Briefly, the 1236 genes/proteins detected by both proteomic and transcriptomic platforms were mapped onto 1015 gene/protein sets of 15 members or more. Gene/protein sets were assigned an enrichment score relative to a “concordance signal” computed from the proteomic spectral index and the transcriptomic t statistic. Computing this enrichment score for original and phenotype label permuted data sets yielded observed and null distributions of the NESs and p values for enrichment across gene/protein sets (see “Materials and Methods” for additional details). The vast majority of gene/protein sets (927 of 1015) demonstrated positive enrichment (NES > 0) (tumor versus normal), with 310 showing significant positive enrichment (q < 0.25) (Fig. 2b). These results suggest a significant degree of pathway level concordance in the differential gene/protein expression in invasive ER+ breast cancer. More broadly, both the single gene/protein and pathway level results strongly suggest that proteomic and transcriptomic profiling approaches reflect consistent, although complementary, features of the same biological process. This concordance is notable in that it emerges from the analysis of nearly independent (31 of 32 samples) breast cancer sample sets with multiple sources of biological (tumor-normal, tumor-tumor, and gene-protein) and experimental (microarray and LC-MS) variation.
Network Integration of Transcriptomic and Proteomic Results
Three distinct strategies were examined to integrate transcriptomic and proteomic data with known networks to gain insight into the biology of invasive ER+ breast tumorigenesis (Fig. 1a). The first and simplest approach built IPA networks directly from genes/proteins that were significantly altered in both proteomic and transcriptomic data sets. The second approach (gene-centric NSEA) built IPA networks from significantly altered genes and then chose the subset of those networks significantly enriched in differentially expressed proteins (Fig. 1b). The third approach (protein-centric NSEA) built IPA networks from significantly altered proteins and then chose the subset of those networks significantly enriched in differentially expressed genes (Fig. 1c). Networks emerging from each approach were evaluated for their ability to prognostically stratify patients across multiple clinical breast cancer gene expression data sets (Fig. 1d). Underlying this strategy was the hypothesis that a network of genes/proteins contributing both to tumorigenesis and clinical relapse would reveal potentially important features of breast cancer biology.
Approach 1: Build Networks from Both Differentially Expressed Genes and Proteins
A list of 28 genes/proteins with significant expression changes in both transcriptomic (q < 0.05) and proteomic data sets (|SpI| > 0.556) (supplemental Table 1) was subjected to IPA core analysis with standard settings (see “Materials and Methods”), yielding two significant networks containing 15 and 13 focus molecules. Each of the two networks was examined for their ability to predict relapse using ER+ breast cancer patients from five independent cohorts (22–26) and their corresponding gene expression data sets. For each network, a support vector machine classifier was trained in one cohort (22) to predict 5-year survival (22). Significant survival time differences between the resulting “favorable” and “poor” classification categories were determined across the remaining four independent clinical test sets (23–26) using Cox regression. Each of the networks yielded nominally significant classifiers in meta-analysis across the four cohorts (Table V). However, neither of these two associations remained significant when compared against a null distribution of classifiers built from 1000 random gene sets (Table V).
Table V. Cox regression results for two gene-protein networks arising from Approach 1.
| Network | Ivshina |
Chin |
Wang |
Van de Vijver |
Meta-analysis |
||||||||||
|---|---|---|---|---|---|---|---|---|---|---|---|---|---|---|---|
| P (Cox) | HR (Cox) | P (perm) | P (Cox) | HR (Cox) | P (perm) | P (Cox) | HR (Cox) | P (perm) | P (Cox) | HR (Cox) | P (perm) | P (Cox) | HR (Cox) | P (perm) | |
| 1 | 8.0E-04 | 2.18 | 0.13 | 0.01 | 4.20 | 0.10 | 0.17 | 1.36 | 0.67 | 0.22 | 1.34 | 0.46 | 8.3E-05 | 1.66 | 0.28 |
| 2 | 1.3E-03 | 2.17 | 0.13 | 0.37 | 1.64 | 0.66 | 0.21 | 1.38 | 0.66 | 0.94 | 0.98 | 0.95 | 0.01 | 1.45 | 0.66 |
Approach 2: Gene-centric NSEA
966 of 9804 genes with significant differential gene expression between NBE and MBE (q < 0.05, Student's t test) were identified. Input of this gene list into IPA yielded 45 significant networks. Gene-centric NSEA (see “Materials and Methods”) was applied to determine enrichment of these 45 networks in the proteomic data set. Interestingly, none of the transcriptomically derived networks yielded significant enrichment in differentially expressed proteins. Specifically, 17 of the 45 networks were not included in the enrichment analysis because of inadequate power, i.e. less than five proteins in the network were represented in the proteomic data set. The remaining 28 networks contained between 5 and 15 detected proteins, but none of these networks showed a significant enrichment when compared with the background NES distribution (p < 0.05, following Bonferonni correction for 28 hypotheses). We did not test any of the transcriptomically derived networks as clinical relapse predictors because of this lack of observed proteomic concordance.
Approach 3: Protein-centric NSEA
121 differentially expressed proteins were inputted into IPA, yielding seven significant networks. Protein-centric NSEA found that two of the seven protein-derived networks showed significant enrichment in the gene expression data set (p < 0.05, after Bonferonni correction for seven hypotheses) (Fig. 3 for network 1; see supplemental Fig. 2 for network 2). These two significant gene/protein enriched networks were tested for their ability to predict relapse across independent clinical gene-expression cohorts. As in Approach 1, an support vector machine classifier on network genes was trained on 5-year relapse-free survival in one ER+ breast cancer cohort (22), and then the performance of this network was tested across four independent test cohorts of ER+ patients applying Cox regression on DFS (23, 25, 26) or RFS (24). The classifier performance (quantified as hazard ratios) was compared between the network genes and classifiers created from 1000 random gene sets to yield a stringent permutation p value for predicting relapse versus relapse-free survival.
Fig. 3.

The single gene and protein network generated by Approach 3 (Network 1) that demonstrated significance as a clinical relapse predictor following a stringent permutation based test. Nodes correspond to proteins in the Ingenuity Pathway Database. a and b show the network with protein and gene expression overlaid, respectively. In each figure, red and green coloring represents proteins/genes that are up- and down-regulated, respectively, in the laser capture microdissected cancer cells relative to normal epithelium. Nodes in a and b are annotated with the spectral index and log fold change for that protein and gene, respectively.
Although both of the above networks showed nominal significance in meta-analysis across the four test cohorts, only one network (Network 1; see Fig. 3) was significant following permutation (p = 0.004, permutation test). Stated differently, Network 1 outperformed 99.6% of random gene sets as a prognostic clinical classifier, yielding a nominal p value of 6.5 × 10⁻¹¹ and a hazard ratio of 2.35 in meta-analysis across the four cohorts. Network 1 was also nominally significant in all four individual test cohorts (p = 0.002 in Ref. 23, p = 0.0003 in Ref. 24, p = 0.0004 in Ref. 25, and p = 0.002 in Ref. 26; Cox regression) (Table VI). Kaplan-Meier curves illustrating the performance of the Network 1-based classifier on the four test cohorts and in meta-analysis are shown in Fig. 4. Receiver operator characteristic curves were also computed for this classifier across each of the cohorts (AUC = 0.61 in Ref. 23, AUC = 0.64 in Ref. 24, AUC = 0.67 in Ref. 25, and AUC = 0.66 in Ref. 26) and are provided in supplemental Fig. 3. Genes contributing to the Network 1-based classifier were: ACLY, ASAH1, BLVRA, COL14A1, CRABP2, DCN, FTH1, KRT15, MVP, MYH11, MYLK, NME1, and PARP1.
Table VI. Cox regression results for two gene-protein networks arising from Approach 3.
Results that are significant following permutation are highlighted in bold type.
| Network | Ivshina |
Chin |
Wang |
Van de Vijver |
Meta-analysis |
||||||||||
|---|---|---|---|---|---|---|---|---|---|---|---|---|---|---|---|
| P (Cox) | HR (Cox) | P (perm) | P (Cox) | HR (Cox) | P (perm) | P (Cox) | HR (Cox) | P (perm) | P (Cox) | HR (Cox) | P (perm) | P (Cox) | HR (Cox) | P (perm) | |
| 1 | 0.0016 | 2.09 | 0.16 | 0.0017 | 7.60 | 0.01 | 3.2E-04 | 2.25 | 0.06 | 3.7E-04 | 2.53 | 0.04 | 6.5E-11 | 2.35 | 0.004 |
| 2 | 0.01 | 1.71 | 0.46 | 0.51 | 1.40 | 0.76 | 0.0018 | 2.02 | 0.14 | 0.06 | 1.58 | 0.28 | 2.5E-05 | 1.72 | 0.23 |
Fig. 4.

Kaplan-Meier curves for a clinical classifier built from Network 1 from Approach 3 that was trained in Ref. 22 and tested across four independent cohorts. Panels a–d show results for the four independent test cohorts in Refs. 23, 24, 25, and 26, respectively. Panel e shows the results of meta-analysis across all four cohorts. Kaplan-Meier curves depict the percentage of patients without disease (a, b, and d) or relapse (c) as a function of time from diagnosis, stratified by computed prognostic class. Disease and relapse events were treated equivalently in the meta-analysis results shown in e. Notches on each curve (marked with ×) represent censure times. The significance of outcome differences between the two prognostic classes in each analysis was computed using the log rank test and is displayed alongside the respective Kaplan-Meier curve.
Multivariate Cox regression analysis revealed that the Network 1-based predictor was independent of histological grade, lymph node status, age at diagnosis, and tumor size in the data sets from Refs. 24 (p = 0.002, Cox regression) and 25 (p = 0.0026, Cox regression) and showed a trend for independence in the Ref. 23 data set (p = 0.06, Cox regression); clinical covariate data (beyond ER status) was not available for the data set in Ref. 24. Applying multivariate Cox-regression in a meta-analysis across the three cohorts yielded a robust p value of 5.7 × 10⁻⁶ and a hazard ratio of 2.14 after correcting for the four clinical variables. Importantly, this result remained significant after comparison with 1000 random gene sets (p = 0.01, permutation). Multivariate Cox regression results for the Network 1 based classifier are shown in Table VII. These results were also unchanged when including systemic adjuvant chemotherapy as a fifth covariate (supplemental Table 2).
Table VII. Multivariate Cox regression results for Network 1 arising from Approach 3.
Multivariate Cox regression was performed correcting for lymph node status, age, tumor size, and grade in each cohort and in meta-analysis. Age, tumor size, and grade covariate data were not available for the data in Ref. 24.
| Network | Ivshina |
Chin |
Van de Vijver |
Meta-analysis |
||||||||
|---|---|---|---|---|---|---|---|---|---|---|---|---|
| P (Cox) | HR (Cox) | P (perm) | P (Cox) | HR (Cox) | P (perm) | P (Cox) | HR (Cox) | P (perm) | P (Cox) | HR (Cox) | P (perm) | |
| 1 | 0.060 | 1.60 | 0.31 | 0.0020 | 7.54 | 0.026 | 0.0026 | 2.37 | 0.041 | 5.7E-06 | 2.14 | 0.014 |
In summary, protein-centric NSEA yielded a network that was robustly informative of breast cancer relapse. Furthermore, this network-based expression biomarker was prognostically significant even after correcting for commonly used clinicopathological variables and comparison against 1000 random gene sets.
DISCUSSION
Methodological Considerations
We examined three approaches for integrating differential proteomic and transcriptomic results with annotated biological networks for ER+ invasive breast cancer-derived data sets. Approach 1 built a network from intersecting differentially expressed genes and proteins identified in the proteomic and transcriptomic analyses. Although simple, the approach ignored much of the transcriptomic data set, the majority of which mapped to proteins that were undetected on the proteomic platform. Furthermore, this approach only took into account the most significant changes in both data sets, which is likely to be conservative and insensitive. Approach 2 (gene-centric NSEA) built networks from significantly differentially expressed genes and evaluated those for enrichment with significantly altered proteins. This approach failed to yield any altered networks. There are several likely explanations for this result. First, the comparatively small number of proteins detected on the proteomic platform (versus gene expression) resulted in a minimal overlap between transcriptomically derived networks and proteins detected in the proteomic data set. Second, transcriptomic analysis yielded a large number of networks, many of which are likely driven by “biological noise” (i.e. false positives).
The success of Approach 3 may be attributed to a notable feature of the protein-centric approach: protein expression is more directly linked to the biological state of a tissue. Quantitative proteomics measures protein expression, albeit with bias against the detection of low abundance molecular species. In contrast, gene expression platforms yield comprehensive genome-wide snapshots of the transcriptomic state. However, many of these gene expression changes are not reflected in the proteome, because of factors such as post-transcriptional regulation, variable rates of protein turnover, and post-translational modification. Thus, many gene expression changes are likely not functionally important, representing “passenger” rather than “driver” events in tumorigenesis. However, a subset of these transcriptomic changes may emerge as important biological signals because of their closeness in network space to differentially expressed proteins. Therefore, anchoring a network analysis on significant protein changes and then evaluating the resulting networks for significant differential gene expression changes may leverage the comprehensiveness of transcriptomic data while buffering for biological noise.
There are several precedents in the literature of network-based interpretation of differential proteomic cancer data sets. For example, in a previous study, IPA was used to analyze global protein profiles of nontransformed and transformed breast cancer cell lines (30). In a second study, differential proteomic changes in normal versus tumor cells of ApcMin/+ mice were interpreted in the context of previously constructed gene coexpression networks (31). Similar to both of these studies, NSEA employs the existing biological networks to identify differentially expressed modules. However, unlike in Refs. 30 and 31, NSEA integrates both transcriptomic and proteomic expression data from the same tissue to identify networks altered at the gene and protein level. The choice of protein-protein interaction instead of gene coexpression networks (used in Ref. 33) is not essential to NSEA; however, it is believed that protein-protein interactions more reliably reflect underlying biology by capturing signaling, binding, and other biochemical interactions between molecules. The use of IPA for biological network analysis could similarly be replaced with any other proprietary or public network database (e.g. STRING (32) or SPIKE (33)) and alternate methods of scoring subnetworks enriched for differentially expressed genes/proteins (34–36).
Notably, Network 1 was discovered through the analysis of a small cohort of purified epithelial tissue, although it was prognostically validated in a large cohort of unpurified (i.e. stromally contaminated) tumor tissue. The small size of our network discovery data sets (seven MBE-NBE pairs for gene expression and nine MBE and nine NBE samples for proteomic analysis) is a testament to the power of an integrated approach that combines different levels of biological signal with functional network annotation. In addition, because Network 1 was initially discovered in the analysis of highly purified epithelial tissue, one would expect the strength of any biological signal originating in this tissue compartment to diminish with the presence of stromal contamination. All of the samples profiled in the expression data sets analyzed in the prognostic validation component of our study (22–26) were unpurified samples, many of which were likely highly contaminated by stroma. The choice of using these data sets was made out of necessity, because, to our knowledge, there are no large genomic case studies with clinically annotated profiles of highly enriched breast cancer epithelium. However, despite this potential confounder of stromal contamination, our analysis was able to detect a significant statistical effect on relapse using a clinical classifier built from our network. The cohort-to-cohort differences in the degree and significance of prognostic impact seen with this classifier (Tables V–VII) are likely related to issues of statistical power and sampling noise in the face of this significant confounder. We surmise that the classifier resulting from the discovered network would show more profound and consistent prognostic impact using LCM-enriched MBE expression profiles from a clinically annotated cohort of ER+ breast cancer patients.
Guidelines for Evaluating Clinical Relapse Signatures
Part of the above analysis involved evaluation of significantly altered gene/protein networks for their ability to predict breast cancer relapse. An important caveat of evaluating gene sets and gene signatures for relapse is that it is quite possible to train a prognostically informative classifier (i.e. a biomarker(s) that predicts clinical outcome) from a random gene set. As has been previously observed in the gene expression literature, such a “random classifier” will even perform well on multiple validation data sets (37, 38). This baseline predictive ability may arise from the “footprint” of proliferative index or tumor grade on all genes in the genome (37–39). As a result, a clinical classifier built from a random gene set will encode this generic molecular feature and be somewhat predictive of prognosis, without necessarily reflecting novel tumor biology. Indeed, this caveat has been observed with many of the network-derived and random gene sets of the present study.
In prognostic validation phase of our study, this challenge was overcome through permutation, i.e. by ranking the prognostic ability of an observed gene set relative to a collection of randomly chosen gene sets. A gene set that performs no better than random on the test set is likely not encoding an interesting biological principle. For example, such was the case with both networks obtained by Approach 1. However, with Approach 3, a network was found that robustly surpassed this stringent permutation-based significance criterion. Furthermore, this network-based biomarker signature was significant even after correcting for commonly used clinicopathological variables used in determining breast cancer prognosis. As a result, this network very likely encodes a biologically significant feature of breast cancer molecular biology.
Biological and Clinical Implications of Discovered Network
Protein and gene expression changes superimposed on the prognostically significant network obtained via protein-centric NSEA (Fig. 3) suggest an overlap of three interrelated biological processes: 1) activation of stress response signaling, 2) altered small molecule metabolism, and 3) modulation of cytoskeletal and extracellular matrix components. These three themes comprise a host of interesting molecules and fuel many intriguing conjectures, a subset of which is discussed below.
Central to this network are the two canonical stress-activated protein kinases, JNK and p38 MAPK. These kinases mediate cellular response to environmental and genotoxic stresses, in particular, reactive oxygen species formation, while also playing important roles in inflammation, differentiation, survival, and cell migration (40). The impact of these kinases in cancer is complex- and context-specific. Thus, although certain cells employ the signaling pathways involving these kinases to inhibit growth and promote apoptosis, other cells employ JNK and p38MAPK to facilitate proliferation, survival, and invasion through activation of Ap1. This dual function mirrors the dual role of oxidative stress in cancer, in which tumor progression is promoted by inducing genomic instability, whereas apoptosis and other forms of cell death are simultaneously enhanced. Although phosphorylation activity of these two stress-activated protein kinases has not been measured, mild overexpression of JNK at the gene level and of p38 MAPK on both the protein and gene levels was observed in this study, as shown in Fig. 3.
In addition, consistent with JNK activation, dramatic down-regulation of ferritin heavy chain at the protein level was observed. Ferritin is the major iron storage protein in human cells, and its down-regulation causes reactive oxygen species accumulation and JNK activation through the increase of intracellular labile iron pools (41, 42). Conversely, JNK activation has also been shown to cause ferritin degradation, release of labile iron pools, and reactive oxygen species formation (43). Down-regulation of ferritin commonly occurs between early and late stages of esophageal carcinoma and is an essential event in transforming growth factor-β-induced epithelial to mesenchymal transition in cultured cancer cells (42). Interestingly, ferritin heavy chain is not found to be down-regulated at the transcript level. However, ferritin heavy chain is classically known to be post-transcriptionally regulated via a pathway involving iron response proteins IRP1 and IRP2. The analysis did not determine post-translational or transcription modifications, but either of these factors could be a possible explanation for this discordance (44).
Striking proteomic and transcriptomic up-regulation of heat shock protein HSBP1 (also known as Hsp27) was also observed. This finding is consistent with previous observations in which HSBP1 was found to be overexpressed in more than 50% of breast cancers and other epithelial tumors; heat shock protein has also been associated with multidrug resistance to chemotherapy (45–47). Similar to JNK and p38 MAPK, heat shock proteins are activated by cellular stress. In addition, HSBP1 is associated with the activation of JNK and inhibition of p38 MAPK in hematopoietic cells (48, 49) and is a substrate of the kinase MAPKAP-K2, which is directly phosphorylated by p38 MAPK (50).
HSBP1 prevents the cleavage of PARP1 (51), which was one of the most significantly altered proteins in the proteomic data set. PARP1 cleavage is a hallmark of programmed cell death in both normal and cancer cells (52). The enzyme mediates a key response to genotoxic stress by sensing double- and single-stranded breaks in DNA and rapidly recruiting a plethora of DNA repair proteins to the lesion site. PARP1 is also linked intricately to cancer cell metabolism, because its enzymatic activity causes significant depletion of cellular NAD+ and ATP, leading to a novel form of metabolic cell death termed parthananos (53). Most importantly, PARP1 has emerged as a centerpiece of breast cancer therapeutics, because PARP1 inhibitors have shown efficacy in the treatment of “triple negative” (i.e. ER, PR, and Her-2-Neu negative) breast cancers (52). Furthermore, recent overexpression and RNA interference knockdown experiments have implicated p38 MAPK as a major modulator of sensitivity to PARP1 inhibitors in breast cancer cell lines, providing an intriguing link between these two nodes in Network 1 (54, 55). PARP1 is significantly up-regulated across both the proteomic and gene expression data sets, which suggests an intriguing novel role for this molecule in the stress response of ER+ tumors.
Small molecule metabolism enzymes acid ceramidase, ATP citrate lyase (ACLY), and nucleotide diphosphate kinase 1 (NME1) were concordantly up-regulated in both the proteomic and transcriptomic data sets. Acid ceramidase, an enzyme that mediates the conversion of ceramide to sphingosine, links small molecule metabolism and stress response pathways in the network in Fig. 3. Ceramide accumulation provides a key molecular signal to coordinate the cellular response to serum deprivation, ionizing radiation, inflammatory cytokine stimulation, and other stresses (56). Notably, ceramide activates JNK and also causes programmed cell death through PARP1 cleavage (57, 58). Ceramide-mediated apoptosis can be prevented through the overexpression of acid ceramidase, which metabolizes intracellular ceramide to sphingosine (59).
ACLY is a central metabolic enzyme that is essential for acetyl-CoA synthesis from citrate (60). The enzyme shuttles carbon moieties derived from glycolysis into de novo lipid synthesis, providing an important link between the Warburg effect and cancer anabolism (61). Pharmacological and genetic inhibition of ACLY suppresses tumor growth in multiple cell lines and xenografts (61). In addition to its established role in lipogenesis, it was shown that acetyl-CoA proteins derived from ACLY serve as the primary substrate for chromatin modifying histone acetylases, suggesting that ACLY may be involved in the epigenetic regulation of the differentiation state of tumor cells (62). Intriguingly, ACLY has been shown to undergo phosphorylation at a catalytic histidine residue by another protein in Network 1, the enzyme NME1 (63).
NME1 is a small molecule metabolism enzyme that was up-regulated in both the transcriptomic and proteomic data sets. NME1 catalyzes synthesis of non-ATP nucleotide diphosphates. NME1 overexpression is also associated with the inhibition of JNK and p38 MAPK, as well as broad inhibition of the proliferative kinases ERK, Akt, and PI3K (64, 65). NME1 is also known as a “metastasis suppressor,” because loss or underexpression of the protein is associated with high metastatic potential in breast cancer and other tumor types (65). This property may underlie its prognostic value in the network-based clinical predictor reported in this study.
The periphery of the proposed network contains multiple down-regulated extracellular matrix and cytoskeletal proteins that include decorin and type XIV collagen (COL14A1). Decorin is a extracellular matrix proteoglycan whose overexpression causes inhibition of the oncogenic Erbb2 protein in breast carcinoma cell lines (66). Decorin is degraded by matrix metalloproteases, which are endopeptidases that cleave multiple components of the extracellular matrix and are ubiquitously up-regulated across human cancers, including breast cancers (67, 68). Matrix metalloproteinases are transcriptionally activated by JNK and p38 MAPK but are generally regulated through post-translational cleavage from an inactive zymogen state (40, 67). Furthermore, decorin binds to type XIV collagen, and this interaction is postulated to promote the organized connection of collagen fibrils in the extracellular matrix (69). In vitro-based data demonstrate that decorin suppresses breast metastases (70–72), whereas direct clinical data show that human breast tumors with reduced decorin expression are associated with poor outcome (73).
Taken together, Network 1 highlights an intriguing interplay of stress response, cancer metabolism, and tumor microenvironment pathways. The dual property of this network as being 1) proteomically and transcriptomically altered in the breast cancer versus normal epithelium analysis and 2) prognostically informative across a large clinical collection of breast cancer patients underscores the potentially important role of these pathways in the biology of tumorigenesis and metastasis in ER+ breast cancers.
The functional role of this network in breast cancer is not established by our study. The patterns discussed above represent hypotheses that would require significant additional experimentation to functionally validate. Because many of the central nodes in this network are involved in phosphosignaling (JNK and p38 MAPK), targeted and global kinase profiling of MBE and NBE would critically test these hypotheses. Additional functional insight could be gained through knockdown and overexpression experiments in human breast cancer cell lines or genetically engineered mouse models combined with histological and molecular phenotypic profiling following each perturbation. Such experiments are outside the scope of our present study but represent a potentially fruitful direction of future experimental efforts.
Conclusion
This study has demonstrated the power of an integrated quantitative proteomic, transcriptomic, and network analysis approach to discover robust and potentially meaningful clinical molecular changes in breast cancer. The work began by demonstrating a basic concordance between proteomic and transcriptomic expression changes measured in two studies of ER+ invasive ductal carcinoma patients. Leveraging this concordance, three novel methods were implanted to integrate proteomic and transcriptomic expression changes with biologically annotated networks, leading to the discovery of novel molecular features in breast cancer biology. The most successful approach constructed networks from significantly altered proteins and then chose among these networks significantly enriched in differentially expressed genes. Strikingly, it was found that a network enriched in differentially expressed genes and proteins in cancerous versus normal breast epithelium was informative of breast cancer relapse. This network linked pathways in cellular stress response, cancer metabolism, and tumor microenvironment through experimentally annotated signaling and binding interactions. The present results suggest physiologically important intersections of diverse cellular pathways that mediate both tumorigenesis and clinical aggressiveness in breast cancer. The findings have the potential to open new avenues of research into the molecular mechanisms of breast tumorigenesis and the development of novel therapeutics strategies for human breast cancer.
Acknowledgments
We thank the Enterprise Research IS group at Partners Healthcare for in-depth support and access to the HPC facilities. This work is Contribution 962 from the Barnett Institute.
Footnotes
* This work was supported by National Institutes of Health Grants RO1GM15847 (to B. L. K.) and R01CA112021 (to D. C. S.) and funds from the Susan G. Komen Breast Cancer Foundation (to B. L. K. and D. C. S.), the NCI SPORE in breast cancer at Massachusetts General Hospital (to D. C. S.), and the Avon Foundation (to D. C. S.). The costs of publication of this article were defrayed in part by the payment of page charges. This article must therefore be hereby marked “advertisement” in accordance with 18 U.S.C. Section 1734 solely to indicate this fact.
 This article contains supplemental material.
1 The abbreviations used are:
- LCM
- laser capture microdissection
- ER+
- estrogen receptor positive
- MAPK
- mitogen-activated protein kinase
- PARP
- poly(ADP-ribose) polymerase
- MBE
- malignant breast epithelium
- IBC
- invasive breast carcinoma
- NBE
- normal breast epithelium
- SpI
- spectral index
- GSEA
- gene set enrichment analysis
- ES
- enrichment score
- NES
- normalized enrichment score
- NSEA
- network set enrichment analysis
- IPA
- Ingenuity Pathway Analysis
- DFS
- disease-free survival
- RFS
- relapse-free survival
- AUC
- area under the curve
- HR
- hazard ratio
- P (Cox)
- P-value obtained by Cox regression
- P (perm)
- P-value obtained by a permutation test
- RM
- reduction mammoplasty
- HPC
- High Performance Computing
- MAPKAP-K2
- MAPK-activated protein kinase 2
- PR
- progesterone receptor
- ACLY
- ATP citrate lyase
- NME1
- nucleotide diphosphate kinase 1.
REFERENCES
- 1. Bièche I., Lidereau R. (2011) Genome-based and transcriptome-based molecular classification of breast cancer. Curr. Opin. Oncol. 23, 93–99 [DOI] [PubMed] [Google Scholar]
- 2. Bombonati A., Sgroi D. C. (2011) The molecular pathology of breast cancer progression. J. Pathol. 223, 307–317 [DOI] [PMC free article] [PubMed] [Google Scholar]
- 3. Zhang X. H., Wang Q., Gerald W., Hudis C. A., Norton L., Smid M., Foekens J. A., Massagué J. (2009) Latent bone metastasis in breast cancer tied to Src-dependent survival signals. Cancer Cell 16, 67–78 [DOI] [PMC free article] [PubMed] [Google Scholar]
- 4. Easton D. F., Pooley K. A., Dunning A. M., Pharoah P. D., Thompson D., Ballinger D. G., Struewing J. P., Morrison J., Field H., Luben R., Wareham N., Ahmed S., Healey C. S., Bowman R., Meyer K. B., Haiman C. A., Kolonel L. K., Henderson B. E., Le Marchand L., Brennan P., Sangrajrang S., Gaborieau V., Odefrey F., Shen C. Y., Wu P. E., Wang H. C., Eccles D., Evans D. G., Peto J., Fletcher O., Johnson N., Seal S., Stratton M. R., Rahman N., Chenevix-Trench G., Bojesen S. E., Nordestgaard B. G., Axelsson C. K., Garcia-Closas M., Brinton L., Chanock S., Lissowska J., Peplonska B., Nevanlinna H., Fagerholm R., Eerola H., Kang D., Yoo K. Y., Noh D. Y., Ahn S. H., Hunter D. J., Hankinson S. E., Cox D. G., Hall P., Wedren S., Liu J., Low Y. L., Bogdanova N., Schürmann P., Dörk T., Tollenaar R. A., Jacobi C. E., Devilee P., Klijn J. G., Sigurdson A. J., Doody M. M., Alexander B. H., Zhang J., Cox A., Brock I. W., MacPherson G., Reed M. W., Couch F. J., Goode E. L., Olson J. E., Meijers-Heijboer H., van den Ouweland A., Uitterlinden A., Rivadeneira F., Milne R. L., Ribas G., Gonzalez-Neira A., Benitez J., Hopper J. L., McCredie M., Southey M., Giles G. G., Schroen C., Justenhoven C., Brauch H., Hamann U., Ko Y. D., Spurdle A. B., Beesley J., Chen X., Mannermaa A., Kosma V. M., Kataja V., Hartikainen J., Day N. E., Cox D. R., Ponder B. A. (2007) Genome-wide association study identifies novel breast cancer susceptibility loci. Nature 447, 1087–1093 [DOI] [PMC free article] [PubMed] [Google Scholar]
- 5. Horlings H. M., Lai C., Nuyten D. S., Halfwerk H., Kristel P., van Beers E., Joosse S. A., Klijn C., Nederlof P. M., Reinders M. J., Wessels L. F., van de Vijver M. J. (2010) Integration of DNA copy number alterations and prognostic gene expression signatures in breast cancer patients. Clin. Cancer Res. 16, 651–663 [DOI] [PubMed] [Google Scholar]
- 6. Navin N., Kendall J., Troge J., Andrews P., Rodgers L., McIndoo J., Cook K., Stepansky A., Levy D., Esposito D., Muthuswamy L., Krasnitz A., McCombie W. R., Hicks J., Wigler M. (2011) Tumour evolution inferred by single-cell sequencing. Nature 472, 90–94 [DOI] [PMC free article] [PubMed] [Google Scholar]
- 7. Shah S. P., Morin R. D., Khattra J., Prentice L., Pugh T., Burleigh A., Delaney A., Gelmon K., Guliany R., Senz J., Steidl C., Holt R. A., Jones S., Sun M., Leung G., Moore R., Severson T., Taylor G. A., Teschendorff A. E., Tse K., Turashvili G., Varhol R., Warren R. L., Watson P., Zhao Y., Caldas C., Huntsman D., Hirst M., Marra M. A., Aparicio S. (2009) Mutational evolution in a lobular breast tumour profiled at single nucleotide resolution. Nature 461, 809–813 [DOI] [PubMed] [Google Scholar]
- 8. Ding L., Ellis M. J., Li S., Larson D. E., Chen K., Wallis J. W., Harris C. C., McLellan M. D., Fulton R. S., Fulton L. L., Abbott R. M., Hoog J., Dooling D. J., Koboldt D. C., Schmidt H., Kalicki J., Zhang Q., Chen L., Lin L., Wendl M. C., McMichael J. F., Magrini V. J., Cook L., McGrath S. D., Vickery T. L., Appelbaum E., Deschryver K., Davies S., Guintoli T., Lin L., Crowder R., Tao Y., Snider J. E., Smith S. M., Dukes A. F., Sanderson G. E., Pohl C. S., Delehaunty K. D., Fronick C. C., Pape K. A., Reed J. S., Robinson J. S., Hodges J. S., Schierding W., Dees N. D., Shen D., Locke D. P., Wiechert M. E., Eldred J. M., Peck J. B., Oberkfell B. J., Lolofie J. T., Du F., Hawkins A. E., O'Laughlin M. D., Bernard K. E., Cunningham M., Elliott G., Mason M. D., Thompson D. M., Jr, Ivanovich J. L., Goodfellow P. J., Perou C. M., Weinstock G. M., Aft R., Watson M., Ley T. J., Wilson R. K., Mardis E. R. (2010) Genome remodelling in a basal-like breast cancer metastasis and xenograft. Nature 464, 999–1005 [DOI] [PMC free article] [PubMed] [Google Scholar]
- 9. Sanders M. E., Dias E. C., Xu B. J., Mobley J. A., Billheimer D., Roder H., Grigorieva J., Dowsett M., Arteaga C. L., Caprioli R. M. (2008) Differentiating proteomic biomarkers in breast cancer by laser capture microdissection and MALDI MS. J. Proteome Res. 7, 1500–1507 [DOI] [PMC free article] [PubMed] [Google Scholar]
- 10. Johann D. J., Rodriguez-Canales J., Mukherjee S., Prieto D. A., Hanson J. C., Emmert-Buck M., Blonder J. (2009) Approaching solid tumor heterogeneity on a cellular basis by tissue proteomics using laser capture microdissection and biological mass spectrometry. J. Proteome Res. 8, 2310–2318 [DOI] [PMC free article] [PubMed] [Google Scholar]
- 11. Schulz D. M., Böllner C., Thomas G., Atkinson M., Esposito I., Höfler H., Aubele M. (2009) Identification of differentially expressed proteins in triple-negative breast carcinomas using DIGE and mass spectrometry. J. Proteome Res. 8, 3430–3438 [DOI] [PubMed] [Google Scholar]
- 12. Weitzel L. R., Byers T., Allen J., Finlayson C., Helmke S. M., Hokanson J. E., Hunsucker S. W., Murphy J. R., Newell K., Queensland K. M., Singh M., Wischmeyer P. E., Duncan M. W., Elias A. (2010) Discovery and verification of protein differences between Er positive/Her2/neu negative breast tumor tissue and matched adjacent normal breast tissue. Breast Cancer Res. Treat. 124, 297–305 [DOI] [PubMed] [Google Scholar]
- 13. Bauer J. A., Chakravarthy A. B., Rosenbluth J. M., Mi D., Seeley E. H., De Matos Granja-Ingram N., Olivares M. G., Kelley M. C., Mayer I. A., Meszoely I. M., Means-Powell J. A., Johnson K. N., Tsai C. J., Ayers G. D., Sanders M. E., Schneider R. J., Formenti S. C., Caprioli R. M., Pietenpol J. A. (2010) Identification of markers of taxane sensitivity using proteomic and genomic analyses of breast tumors from patients receiving neoadjuvant paclitaxel and radiation. Clin. Cancer Res. 16, 681–690 [DOI] [PMC free article] [PubMed] [Google Scholar]
- 14. Cha S., Imielinski M. B., Rejtar T., Richardson E. A., Thakur D., Sgroi D. C., Karger B. L. (2010) In situ proteomic analysis of human breast cancer epithelial cells using laser capture microdissection: Annotation by protein set enrichment analysis and gene ontology. Mol. Cell. Proteomics 9, 2529–2544 [DOI] [PMC free article] [PubMed] [Google Scholar]
- 15. Kang S., Kim M. J., An H., Kim B. G., Choi Y. P., Kang K. S., Gao M. Q., Park H., Na H. J., Kim H. K., Yun H. R., Kim D. S., Cho N. H. (2010) Proteomic molecular portrait of interface zone in breast cancer. J. Proteome Res. 9, 5638–5645 [DOI] [PubMed] [Google Scholar]
- 16. Bateman N. W., Sun M., Bhargava R., Hood B. L., Darfler M. M., Kovatich A. J., Hooke J. A., Krizman D. B., Conrads T. P. (2011) Differential proteomic analysis of late-stage and recurrent breast cancer from formalin-fixed paraffin-embedded tissues. J. Proteome Res. 10, 1323–1332 [DOI] [PubMed] [Google Scholar]
- 17. Harrell J. C., Dye W. W., Harvell D. M., Sartorius C. A., Horwitz K. B. (2008) Contaminating cells alter gene signatures in whole organ versus laser capture microdissected tumors: A comparison of experimental breast cancers and their lymph node metastases. Clin. Exp. Metastasis 25, 81–88 [DOI] [PubMed] [Google Scholar]
- 18. Fuller A. P., Palmer-Toy D., Erlander M. G., Sgroi D. C. (2003) Laser capture microdissection and advanced molecular analysis of human breast cancer. J. Mammary Gland Biol. Neoplasia 8, 335–345 [DOI] [PubMed] [Google Scholar]
- 19. Espina V., Wulfkuhle J., Liotta L. A. (2009) Application of laser microdissection and reverse-phase protein microarrays to the molecular profiling of cancer signal pathway networks in the tissue microenvironment. Clin. Lab. Med. 29, 1–13 [DOI] [PubMed] [Google Scholar]
- 20. Ma X. J., Dahiya S., Richardson E., Erlander M., Sgroi D. C. (2009) Gene expression profiling of the tumor microenvironment during breast cancer progression. Breast Cancer Res. 11, R7. [DOI] [PMC free article] [PubMed] [Google Scholar]
- 21. Nesvizhskii A. I., Keller A., Kolker E., Aebersold R. (2003) A statistical model for identifying proteins by tandem mass spectrometry. Anal. Chem. 75, 4646–4658 [DOI] [PubMed] [Google Scholar]
- 22. Sotiriou C., Wirapati P., Loi S., Harris A., Fox S., Smeds J., Nordgren H., Farmer P., Praz V., Haibe-Kains B., Desmedt C., Larsimont D., Cardoso F., Peterse H., Nuyten D., Buyse M., Van de Vijver M. J., Bergh J., Piccart M., Delorenzi M. (2006) Gene expression profiling in breast cancer: Understanding the molecular basis of histologic grade to improve prognosis. J. Natl. Cancer Inst. 98, 262–272 [DOI] [PubMed] [Google Scholar]
- 23. Ivshina A. V., George J., Senko O., Mow B., Putti T. C., Smeds J., Lindahl T., Pawitan Y., Hall P., Nordgren H., Wong J. E., Liu E. T., Bergh J., Kuznetsov V. A., Miller L. D. (2006) Genetic reclassification of histologic grade delineates new clinical subtypes of breast cancer. Cancer Res. 66, 10292–10301 [DOI] [PubMed] [Google Scholar]
- 24. Wang Y., Klijn J. G., Zhang Y., Sieuwerts A. M., Look M. P., Yang F., Talantov D., Timmermans M., Meijer-van Gelder M. E., Yu J., Jatkoe T., Berns E. M., Atkins D., Foekens J. A. (2005) Gene-expression profiles to predict distant metastasis of lymph-node-negative primary breast cancer. Lancet 365, 671–679 [DOI] [PubMed] [Google Scholar]
- 25. van de Vijver M. J., He Y. D., van't Veer L. J., Dai H., Hart A. A., Voskuil D. W., Schreiber G. J., Peterse J. L., Roberts C., Marton M. J., Parrish M., Atsma D., Witteveen A., Glas A., Delahaye L., van der Velde T., Bartelink H., Rodenhuis S., Rutgers E. T., Friend S. H., Bernards R. (2002) A gene-expression signature as a predictor of survival in breast cancer. N. Engl. J. Med. 347, 1999–2009 [DOI] [PubMed] [Google Scholar]
- 26. Chin K., DeVries S., Fridlyand J., Spellman P. T., Roydasgupta R., Kuo W. L., Lapuk A., Neve R. M., Qian Z., Ryder T., Chen F., Feiler H., Tokuyasu T., Kingsley C., Dairkee S., Meng Z., Chew K., Pinkel D., Jain A., Ljung B. M., Esserman L., Albertson D. G., Waldman F. M., Gray J. W. (2006) Genomic and transcriptional aberrations linked to breast cancer pathophysiologies. Cancer Cell 10, 529–541 [DOI] [PubMed] [Google Scholar]
- 27. Dai M., Wang P., Boyd A. D., Kostov G., Athey B., Jones E. G., Bunney W. E., Myers R. M., Speed T. P., Akil H., Watson S. J., Meng F. (2005) Evolving gene/transcript definitions significantly alter the interpretation of GeneChip data. Nucleic Acids Res. 33, e175. [DOI] [PMC free article] [PubMed] [Google Scholar]
- 28. Storey J. D., Tibshirani R. (2003) Statistical significance for genomewide studies. Proc. Natl. Acad. Sci. U.S.A. 100, 9440–9445 [DOI] [PMC free article] [PubMed] [Google Scholar]
- 29. Subramanian A., Tamayo P., Mootha V. K., Mukherjee S., Ebert B. L., Gillette M. A., Paulovich A., Pomeroy S. L., Golub T. R., Lander E. S., Mesirov J. P. (2005) Gene set enrichment analysis: A knowledge-based approach for interpreting genome-wide expression profiles. Proc. Natl. Acad. Sci. U.S.A. 102, 15545–15550 [DOI] [PMC free article] [PubMed] [Google Scholar]
- 30. Bateman N. W., Sun M., Hood B. L., Flint M. S., Conrads T. P. (2010) Defining central themes in breast cancer biology by differential proteomics: Conserved regulation of cell spreading and focal adhesion kinase. J. Proteome Res. 9, 5311–5324 [DOI] [PubMed] [Google Scholar]
- 31. Zhu W., Fang C., Gramatikoff K., Niemeyer C. C., Smith J. W. (2011) Proteins and an inflammatory network expressed in colon tumors. J. Proteome Res. 10, 2129–2139 [DOI] [PMC free article] [PubMed] [Google Scholar]
- 32. Szklarczyk D., Franceschini A., Kuhn M., Simonovic M., Roth A., Minguez P., Doerks T., Stark M., Muller J., Bork P., Jensen L. J., von Mering C. (2011) The STRING database in 2011: Functional interaction networks of proteins, globally integrated and scored. Nucleic Acids Res. 39, D561–D568 [DOI] [PMC free article] [PubMed] [Google Scholar]
- 33. Elkon R., Vesterman R., Amit N., Ulitsky I., Zohar I., Weisz M., Mass G., Orlev N., Sternberg G., Blekhman R., Assa J., Shiloh Y., Shamir R. (2008) SPIKE: A database, visualization and analysis tool of cellular signaling pathways. BMC Bioinformatics 9, 110. [DOI] [PMC free article] [PubMed] [Google Scholar]
- 34. Ideker T., Ozier O., Schwikowski B., Siegel A. F. (2002) Discovering regulatory and signalling circuits in molecular interaction networks. Bioinformatics 18, (Suppl. 1) S233–S240 [DOI] [PubMed] [Google Scholar]
- 35. Komurov K., White M. A., Ram P. T. (2010) Use of data-biased random walks on graphs for the retrieval of context-specific networks from genomic data. PLoS Comput. Biol. 6, e1000889. [DOI] [PMC free article] [PubMed] [Google Scholar]
- 36. Dittrich M. T., Klau G. W., Rosenwald A., Dandekar T., Müller T. (2008) Identifying functional modules in protein-protein interaction networks: An integrated exact approach. Bioinformatics 24, i223–i231 [DOI] [PMC free article] [PubMed] [Google Scholar]
- 37. Wirapati P., Sotiriou C., Kunkel S., Farmer P., Pradervand S., Haibe-Kains B., Desmedt C., Ignatiadis M., Sengstag T., Schütz F., Goldstein D. R., Piccart M., Delorenzi M. (2008) Meta-analysis of gene expression profiles in breast cancer: Toward a unified understanding of breast cancer subtyping and prognosis signatures. Breast Cancer Res. 10, R65. [DOI] [PMC free article] [PubMed] [Google Scholar]
- 38. Haibe-Kains B., Desmedt C., Piette F., Buyse M., Cardoso F., Van't Veer L., Piccart M., Bontempi G., Sotiriou C. (2008) Comparison of prognostic gene expression signatures for breast cancer. BMC Genomics 9, 394. [DOI] [PMC free article] [PubMed] [Google Scholar]
- 39. Reis-Filho J. S., Weigelt B., Fumagalli D., Sotiriou C. (2010) Molecular profiling: Moving away from tumor philately. Sci. Transl. Med. 2, 47ps43. [DOI] [PubMed] [Google Scholar]
- 40. Wagner E. F., Nebreda A. R. (2009) Signal integration by JNK and p38 MAPK pathways in cancer development. Nat. Rev. Cancer 9, 537–549 [DOI] [PubMed] [Google Scholar]
- 41. Pham C. G., Bubici C., Zazzeroni F., Papa S., Jones J., Alvarez K., Jayawardena S., De Smaele E., Cong R., Beaumont C., Torti F. M., Torti S. V., Franzoso G. (2004) Ferritin heavy chain upregulation by NF-κB inhibits TNFα-induced apoptosis by suppressing reactive oxygen species. Cell 119, 529–542 [DOI] [PubMed] [Google Scholar]
- 42. Zhang K. H., Tian H. Y., Gao X., Lei W. W., Hu Y., Wang D. M., Pan X. C., Yu M. L., Xu G. J., Zhao F. K., Song J. G. (2009) Ferritin heavy chain-mediated iron homeostasis and subsequent increased reactive oxygen species production are essential for epithelial-mesenchymal transition. Cancer Res. 69, 5340–5348 [DOI] [PubMed] [Google Scholar]
- 43. Antosiewicz J., Ziolkowski W., Kaczor J. J., Herman-Antosiewicz A. (2007) Tumor necrosis factor-α-induced reactive oxygen species formation is mediated by JNK1-dependent ferritin degradation and elevation of labile iron pool. Free Radic. Biol. Med. 43, 265–270 [DOI] [PubMed] [Google Scholar]
- 44. Pantopoulos K. (2004) Iron metabolism and the IRE/IRP regulatory system: An update. Ann. N.Y. Acad. Sci. 1012, 1–13 [DOI] [PubMed] [Google Scholar]
- 45. Sherman M., Multhoff G. (2007) Heat shock proteins in cancer. Ann. N.Y. Acad. Sci. 1113, 192–201 [DOI] [PubMed] [Google Scholar]
- 46. Ciocca D. R., Calderwood S. K. (2005) Heat shock proteins in cancer: Diagnostic, prognostic, predictive, and treatment implications. Cell Stress Chaperones 10, 86–103 [DOI] [PMC free article] [PubMed] [Google Scholar]
- 47. Ciocca D. R., Oesterreich S., Chamness G. C., McGuire W. L., Fuqua S. A. (1993) Biological and clinical implications of heat shock protein 27,000 (Hsp27): A review. J. Natl. Cancer Inst. 85, 1558–1570 [DOI] [PubMed] [Google Scholar]
- 48. De A. K., Kodys K. M., Yeh B. S., Miller-Graziano C. (2000) Exaggerated human monocyte IL-10 concomitant to minimal TNF-α induction by heat-shock protein 27 (Hsp27) suggests Hsp27 is primarily an antiinflammatory stimulus. J. Immunol. 165, 3951–3958 [DOI] [PubMed] [Google Scholar]
- 49. Lee Y. J., Lee D. H., Cho C. K., Chung H. Y., Bae S., Jhon G. J., Soh J. W., Jeoung D. I., Lee S. J., Lee Y. S. (2005) HSP25 inhibits radiation-induced apoptosis through reduction of PKCδ-mediated ROS production. Oncogene 24, 3715–3725 [DOI] [PubMed] [Google Scholar]
- 50. Rousseau S., Dolado I., Beardmore V., Shpiro N., Marquez R., Nebreda A. R., Arthur J. S., Case L. M., Tessier-Lavigne M., Gaestel M., Cuenda A., Cohen P. (2006) CXCL12 and C5a trigger cell migration via a PAK1/2-p38α MAPK-MAPKAP-K2-HSP27 pathway. Cell. Signal. 18, 1897–1905 [DOI] [PubMed] [Google Scholar]
- 51. Garrido C., Bruey J. M., Fromentin A., Hammann A., Arrigo A. P., Solary E. (1999) HSP27 inhibits cytochrome c-dependent activation of procaspase-9. FASEB J. 13, 2061–2070 [DOI] [PubMed] [Google Scholar]
- 52. Rouleau M., Patel A., Hendzel M. J., Kaufmann S. H., Poirier G. G. (2010) PARP inhibition: PARP1 and beyond. Nat. Rev. Cancer 10, 293–301 [DOI] [PMC free article] [PubMed] [Google Scholar]
- 53. David K. K., Andrabi S. A., Dawson T. M., Dawson V. L. (2009) Parthanatos, a messenger of death. Front. Biosci. 14, 1116–1128 [DOI] [PMC free article] [PubMed] [Google Scholar]
- 54. Meng F., Zhang H., Liu G., Kreike B., Chen W., Sethi S., Miller F. R., Wu G. (2011) p38γ mitogen-activated protein kinase contributes to oncogenic properties maintenance and resistance to poly(ADP-ribose)-polymerase-1 inhibition in breast cancer. Neoplasia 13, 472–482 [DOI] [PMC free article] [PubMed] [Google Scholar]
- 55. Turner N. C., Lord C. J., Iorns E., Brough R., Swift S., Elliott R., Rayter S., Tutt A. N., Ashworth A. (2008) A synthetic lethal siRNA screen identifying genes mediating sensitivity to a PARP inhibitor. EMBO J. 27, 1368–1377 [DOI] [PMC free article] [PubMed] [Google Scholar]
- 56. Hannun Y. A. (1996) Functions of ceramide in coordinating cellular responses to stress. Science 274, 1855–1859 [DOI] [PubMed] [Google Scholar]
- 57. Pyne N. J., Pyne S. (2010) Sphingosine 1-phosphate and cancer. Nat. Rev. Cancer 10, 489–503 [DOI] [PubMed] [Google Scholar]
- 58. Cuvillier O., Pirianov G., Kleuser B., Vanek P. G., Coso O. A., Gutkind S., Spiegel S. (1996) Suppression of ceramide-mediated programmed cell death by sphingosine-1-phosphate. Nature 381, 800–803 [DOI] [PubMed] [Google Scholar]
- 59. Strelow A., Bernardo K., Adam-Klages S., Linke T., Sandhoff K., Krönke M., Adam D. (2000) Overexpression of acid ceramidase protects from tumor necrosis factor-induced cell death. J. Exp. Med. 192, 601–612 [DOI] [PMC free article] [PubMed] [Google Scholar]
- 60. Vander Heiden M. G., Cantley L. C., Thompson C. B. (2009) Understanding the Warburg effect: The metabolic requirements of cell proliferation. Science 324, 1029–1033 [DOI] [PMC free article] [PubMed] [Google Scholar]
- 61. Hatzivassiliou G., Zhao F., Bauer D. E., Andreadis C., Shaw A. N., Dhanak D., Hingorani S. R., Tuveson D. A., Thompson C. B. (2005) ATP citrate lyase inhibition can suppress tumor cell growth. Cancer Cell 8, 311–321 [DOI] [PubMed] [Google Scholar]
- 62. Wellen K. E., Hatzivassiliou G., Sachdeva U. M., Bui T. V., Cross J. R., Thompson C. B. (2009) ATP-citrate lyase links cellular metabolism to histone acetylation. Science 324, 1076–1080 [DOI] [PMC free article] [PubMed] [Google Scholar]
- 63. Wagner P. D., Steeg P. S., Vu N. D. (1997) Two-component kinase-like activity of nm23 correlates with its motility-suppressing activity. Proc. Natl. Acad. Sci. U.S.A. 94, 9000–9005 [DOI] [PMC free article] [PubMed] [Google Scholar]
- 64. Boissan M., De Wever O., Lizarraga F., Wendum D., Poincloux R., Chignard N., Desbois-Mouthon C., Dufour S., Nawrocki-Raby B., Birembaut P., Bracke M., Chavrier P., Gespach C., Lacombe M. L. (2010) Implication of metastasis suppressor NM23-H1 in maintaining adherens junctions and limiting the invasive potential of human cancer cells. Cancer Res. 70, 7710–7722 [DOI] [PubMed] [Google Scholar]
- 65. Otsuki Y., Tanaka M., Yoshii S., Kawazoe N., Nakaya K., Sugimura H. (2001) Tumor metastasis suppressor nm23H1 regulates Rac1 GTPase by interaction with Tiam1. Proc. Natl. Acad. Sci. U.S.A. 98, 4385–4390 [DOI] [PMC free article] [PubMed] [Google Scholar]
- 66. Santra M., Eichstetter I., Iozzo R. V. (2000) An anti-oncogenic role for decorin. Down-regulation of ErbB2 leads to growth suppression and cytodifferentiation of mammary carcinoma cells. J. Biol. Chem. 275, 35153–35161 [DOI] [PubMed] [Google Scholar]
- 67. Egeblad M., Werb Z. (2002) New functions for the matrix metalloproteinases in cancer progression. Nat. Rev. Cancer 2, 161–174 [DOI] [PubMed] [Google Scholar]
- 68. Bissell M. J., Radisky D. C., Rizki A., Weaver V. M., Petersen O. W. (2002) The organizing principle: Microenvironmental influences in the normal and malignant breast. Differentiation 70, 537–546 [DOI] [PMC free article] [PubMed] [Google Scholar]
- 69. Ehnis T., Dieterich W., Bauer M., Kresse H., Schuppan D. (1997) Localization of a binding site for the proteoglycan decorin on collagen XIV (undulin). J. Biol. Chem. 272, 20414–20419 [DOI] [PubMed] [Google Scholar]
- 70. Reed C. C., Waterhouse A., Kirby S., Kay P., Owens R. T., McQuillan D. J., Iozzo R. V. (2005) Decorin prevents metastatic spreading of breast cancer. Oncogene 24, 1104–1110 [DOI] [PubMed] [Google Scholar]
- 71. Araki K., Wakabayashi H., Shintani K., Morikawa J., Matsumine A., Kusuzaki K., Sudo A., Uchida A. (2009) Decorin suppresses bone metastasis in a breast cancer cell line. Oncology 77, 92–99 [DOI] [PubMed] [Google Scholar]
- 72. Goldoni S., Seidler D. G., Heath J., Fassan M., Baffa R., Thakur M. L., Owens R. T., McQuillan D. J., Iozzo R. V. (2008) An antimetastatic role for decorin in breast cancer. Am. J. Pathol. 173, 844–855 [DOI] [PMC free article] [PubMed] [Google Scholar]
- 73. Troup S., Njue C., Kliewer E. V., Parisien M., Roskelley C., Chakravarti S., Roughley P. J., Murphy L. C., Watson P. H. (2003) Reduced expression of the small leucine-rich proteoglycans, lumican, and decorin is associated with poor outcome in node-negative invasive breast cancer. Clin. Cancer Res. 9, 207–214 [PubMed] [Google Scholar]