

Abstract
A growing number of studies implicate the microbiome in the pathogenesis of intestinal inflammation. Previous work has shown that adults with esophagitis related to gastroesophageal reflux disease have altered esophageal microbiota compared to those who do not have esophagitis. In these studies, sampling of the esophageal microbiome was accomplished by isolating DNA from esophageal biopsies obtained at the time of upper endoscopy. The aim of the current study was to identify the esophageal microbiome in pediatric individuals with normal esophageal mucosa using a minimally invasive, capsule-based string technology, the Enterotest™. We used the proximal segment of the Enterotest string to sample the esophagus, and term this the “Esophageal String Test” (EST). We hypothesized that the less invasive EST would capture mucosal adherent bacteria present in the esophagus in a similar fashion as mucosal biopsy. EST samples and mucosal biopsies were collected from children with no esophageal inflammation (n = 15) and their microbiome composition determined by 16S rRNA gene sequencing. Microbiota from esophageal biopsies and ESTs produced nearly identical profiles of bacterial genera and were different from the bacterial contents of samples collected from the nasal and oral cavity. We conclude that the minimally invasive EST can serve as a useful device for study of the esophageal microbiome.
Introduction
Recent studies of the human microbiome have provided robust support for the important role of the microbiome in health and disease [1], [2]. Whereas a significant body of work defines the intestinal microbiology, few studies have investigated the esophageal microbiome. To date, these studies utilized mucosal biopsy samples that were obtained at the time of endoscopic procedures [3], [4], [5], [6], [7], [8]. While technically feasible, this methodology is invasive, time consuming, costly, and carries potential complications. In addition, repeated and frequent sampling following therapeutic interventions are impractical and the full characterization of esophageal mucosal microbiome is limited to a ∼3 mm section of procured tissue.
To address this issue, we utilized the proximal section of a minimally invasive device, the Enterotest™, to sample the esophageal mucosal microbial microenvironment. This capsule-based string technology involves the subject swallowing a weighted gelatin capsule filled with a string in which the proximal end is taped to the cheek and the trailing end, with the capsule attached, travels to the duodenum. At the time of endoscopy, 12–18 hours after string placement, the tape is removed from the cheek and the string is retrieved. The aim of this study was to harvest adherent secretions from the proximal portion of the string that was situated in the esophagus and analyze ribosomal RNA gene sequences. We hypothesized that analogous to fecal sampling, the intraluminal contents in the esophagus would be reflective of the mucosal microbial environment present on esophageal mucosal tissue.
Materials and Methods
Esophageal string test (EST)
This study was approved by the Colorado Multiple Institutional Review Board (COMIRB). Written informed consent and HIPPA authorization were obtained from all participants or from parents or legal guardians of participants younger than 18 years. Assent was obtained from all participants under 18 years.
Children 7–20 years of age who were undergoing an endoscopy with biopsy to determine causes of abdominal pain, vomiting, growth failure, or dysphagia were enrolled in this study. Exclusion criteria included a history of esophageal stricture, narrowing, fundoplication, gelatin allergy or other co-morbidities with increase risk (bleeding diatheses, connective tissue diseases) of endoscopic complications. Review of endoscopic and pathology records were performed to determine normal diagnoses. All children with normal mucosal biopsies were included in this study report.
The night prior to the endoscopy, subjects swallowed an Enterotest™ capsule (Figure S1). This technology was developed and began successful use in the 1970's to identify small intestinal infections (e.g. Giardia lamblia) [9], [10], [11] and was subsequently used to sample gastric contents for Helicobacter pylori [12], [13]. The pediatric Enterotest™ consists of a weighted gelatin capsule filled with 90 cm of nylon string. The proximal end of the string (∼10 cm) extrudes from one end of the capsule, which is held and taped to the cheek after the capsule is swallowed. When swallowed, the capsule deploys the capture material, the nylon string, during its passage through the esophageal, gastric and duodenal lumen and is finally released into the duodenum where it eventually is passed in the stool. No food or medications were consumed after the EST was in place. The EST was removed before or just after induction of general anesthesia. Locations of esophageal and gastric segments of the EST were determined using a combination of pH indicator sticks supplied with the tests, and by measuring the distance to the lower esophageal sphincter at the time of endoscopy.
Microbiome identification
Mucosal biopsies were then obtained from the middle to distal part of the esophagus. Nasal swabs, a 2 cm segment of oral string and a 2 cm segment of the middle part of the esophageal string were collected from each subject. Biopsies, swabs and string samples were snap frozen in liquid nitrogen and kept at −80°C until DNA extraction.
DNA from all samples was extracted using Qiagen DNAeasy Extraction Kits for blood and tissue according to manufacturer's specifications (Qiagen, Valencia, CA). DNA was amplified in triplicate with barcoded PCR primers that include adaptors for the Roche 454 sequencing platform [14]. Negative PCR controls were performed for each barcode, and PCR was repeated for any sample where the negative control was positive. Amplicons were pooled after normalization of DNA concentration [15], and sequenced using the Roche 454 FLX platform according to manufacturer's specifications (Roche, Branford, CT). Sequence data were assigned to samples of origin using bar code sequences added during PCR, and screened for basic quality defects (short sequences <200 nucleotides in length, >1 sequence ambiguity, best read with quality ≥20 over a 10-nucleotide moving window) by the program BARTAB [16]. Non-bacterial sequences were removed from datasets by requiring a close match with a bacterial rRNA secondary structure model within Infernal [17]. Sequences identified as potential chimeras by ChimeraSlayer [18] were also removed from datasets. The Ribosomal Database Project Classifier software was used to make taxonomic assignments [19]. Taxonomic information was used to construct sequence groups with identical taxonomic rank, which were used for bacterial community analyses, and to identify specific bacteria that were differentially present between locations.
Statistical analyses
Microbiome DNA results obtained from mucosal biopsy samples were considered the “gold standard” reference; microbiome results obtained from the EST samples were compared to those obtained from the biopsies in all statistical analyses. We defined common genera as ≥1% relative abundance in any sample and rare genera as <1% relative abundance in any sample.
Descriptive statistics included common ecological parameters such as Shannon diversity [20]. For individual taxa, the percentage of samples where the taxa was present, and the median value of the relative abundance, are presented. Comparisons between two groups were performed individually for each taxa using the paired version of the two-part test and the negative log p-values are displayed using the Manhattan plot [21]. The two-part test is the sum of two squared tests statistics, one comparing the proportion of non-zero counts and one comparing the medians of the non-zero counts. All analyses were performed using SAS Version 9.2 software (SAS Institute Inc.: Cary, NC, 2008).
Results
Sample collection
Fifteen subjects (female, n = 10) were enrolled in this study ranging in age from 11 to 18 (median age of 15) with the following ethnic diversity; twelve White, one Black, one Hispanic and one other. Five subjects were on proton pump inhibitor (PPI) for heartburn at the time of the study, two were on inhaled steroids for asthma or rhinitis, three were on food elimination diet, and one was on inhaled steroid in addition to PPI and food elimination diet. All subjects had normal histological biopsy findings. Thirteen nasal swabs and fifteen oral strings, ESTs and biopsies were collected. Bacterial ribosomal RNA gene amplification products from mucosal biopsies and from the nasal cavity, oral cavity and EST were visualized by gel electrophoresis (Figure S2).
Microbiome complexity is similar in oral, nasal and esophageal microenvironments
To determine the extent of the bacterial diversity of the different microenvironments, we evaluated the number of phylum-level taxa present in the oral, nasal and esophageal samples. No significant differences in the complexity of microbiome diversity were observed between the nasal swab, oral string or esophageal biopsy or EST samples at this broad taxonomic level (Figure 1). Variation in this pattern emerged at subphylum levels. In addition, similar numbers of bacterial phyla occur in each location.
Figure 1. Microbiome phylum-level diversity is similar in esophageal, oral and nasal microenvironments.

Microbiome diversity was measured from DNA samples taken from the esophageal mucosa, oral and nasal samples as identified using 454 pyrosequencing. Each point represents the number of Taxa present in each sample. The mean ± standard error of the mean are presented.
EST and mucosal biopsy capture similar bacterial assemblages
To determine the ability of the EST to capture the esophageal microbiome, we procured DNA samples from paired esophageal mucosal biopsies and ESTs and then compared the sequence patterns in each. As shown in Manhattan plots (Figure 2), only 2 statistically significant differences were identified in comparing biopsy and EST, Pasteurella and Actinomyces. Pasteurella was increased in EST samples compared to mucosal biopsies (P = 0.04), whereas Actinomyces was detected more often in biopsy samples, although only in small quantities (relative abundance less than 5%, P = 0.04). These results support the use of the EST to sample the microbiome as compared to the “gold standard”, the mucosal biopsy.
Figure 2. Esophageal genera captured on mucosal biopsies and ESTs are similar.

Bacterial taxa were compared from 15 matched biopsy and EST samples, the negative log p-value from this comparison is displayed for each taxa. The gray horizontal lines indicate significant differences (p<0.05 and p<0.01). The phyla are represented in different colors as in the key. Genera that were significantly different are numbered. Numbers represent: 1, Actinomyces; 2, Pasteurella. 2, had higher relative abundance in EST versus biopsy.
Phylum-level contents of esophageal biopsy and EST microbiomes are similar
We next compared the individual subject esophageal phyla present in the matching mucosal biopsies and ESTs (Figure 3). Individually, the relative abundance was similar for Actinobacteria, Bacteroidetes, Firmicutes, Fusobacteria and Proteobacteria in both biopsy and EST (Figure 3A). In addition, the aggregate compilation of data from all subjects analyzed also showed virtually identical patterns of relative abundance in these predominant phyla present in biopsies and ESTs (Figure 3B).
Figure 3. Esophageal phyla captured on mucosal biopsies and ESTs are similar.

A. Bar graphs indicate phylum detected in 15 matched biopsy (B) and EST samples (E) with each line corresponding to one subject sample. Each phylum is indicated in a different color. The width of the bar corresponds to the relative phylum abundance. B. Bar graphs present the aggregate of all subjects (1–15) of the relative phylum abundance detected in biopsies (B) and ESTs (E).
Similar genera in the esophageal biopsy and EST microbiomes
To determine whether a similar pattern of microbiome population was present at the genus level, we again compared the individual subjects EST and mucosal biopsy samples (Figure 4A). Thirty-one genera were identified in both EST and biopsy samples, with Streptococcus, Prevotella, and Veillonella being the 3 most common (Figure 4B–C). Comparison of the top 10 genera present on 15 biopsies (Figure 4B) and corresponding ESTs (Figure 4C) indicated that the composition was similar across the two sample sources.
Figure 4. Similar genera in the esophageal biopsy and EST microbiomes.

A. Bar graphs indicate genera detected in 15 matched biopsy (B) and EST samples (E) with each line corresponding to one subject sample. Each genus is indicated in a different color. The width of the bar corresponds to the relative genus abundance. B. Pie chart composed of the 10 most prevalent genera in biopsies (n = 15). C. Pie chart composed of the 10 most prevalent genera in ESTs (n = 15). The average percentage of each genus is indicated based on the total bacterial population measured.
The overlap between the genera present on the biopsies and the EST is higher than 75% (Figure 5). The number of genera was higher on biopsies than on ESTs (97 vs. 49). The most common genera defined as ≥1% relative abundance in any samples were largely shared between the biopsy and EST (Figure 5), with only three genera that were discordant (3 in biopsy only, Table 1). Table 1 summarizes the common genera identified in this study and the proportion of subjects where each genus was identified along with the median relative abundance of each group. Genera were ordered based on a composite rank of proportion of samples positive and relative abundance independently for the two sample types. Table 1 is ordered by the rank present in the biopsy samples. Rare taxa were different, with a large proportion identified in the biopsy only, 50 compared to 21 in EST (4 in EST only). Rare taxa represented only 2% of genera in biopsy and 1% in EST. These rare genera were detected in low numbers of samples (38/48, 79%, were seen in a single sample).
Figure 5. Percentage of common genera captured on mucosal biopsies and ESTs.
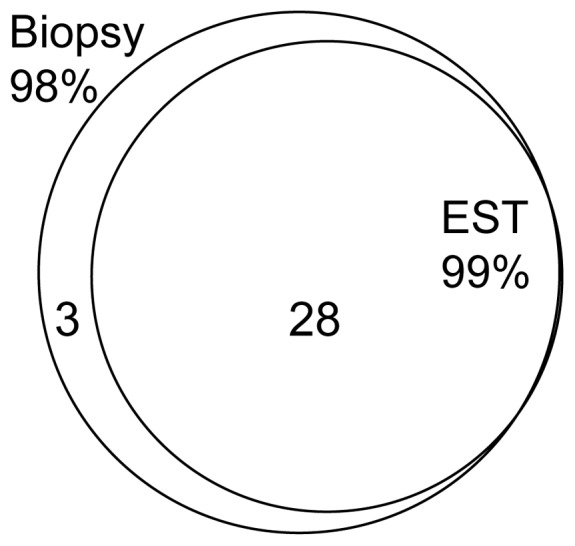
Venn diagram indicating the overlap between biopsies and ESTs for the common genera identified (≥1% relative abundance).
Table 1. Prominent Genera of Esophageal Microbiome.
| Biopsy | EST | |||||||
| Phyla | Genera | Rank | Median | Percent Detected* | Rank | Median | Percent Detected* | Disagreement (%)† |
| Firmicutes | Streptococcus | 1 | 38.7 | 100 | 1 | 35.3 | 100 | 0 |
| Bacteroidetes | Prevotella | 2 | 15.5 | 100 | 2 | 25.6 | 100 | 0 |
| Firmicutes | Veillonella | 3 | 5.1 | 100 | 3 | 7.7 | 100 | 0 |
| Proteobacteria | Haemophilus | 4 | 2.1 | 100 | 5 | 2.5 | 100 | 0 |
| Proteobacteria | Pasteurella | 5 | 1.6 | 100 | 4 | 3.3 | 100 | 0 |
| Bacteroidetes | Porphyromonas | 6 | 1.4 | 100 | 9 | 1.8 | 80 | 20 |
| Firmicutes | Granulicatella | 7 | 1.0 | 100 | 8 | 1.0 | 87 | 13 |
| Fusobacteria | Fusobacterium | 8 | 2.1 | 93 | 6 | 2.8 | 87 | 30 |
| Proteobacteria | Neisseria | 9 | 0.6 | 93 | 10 | 0.5 | 67 | 40 |
| Firmicutes | Gemella | 10 | 0.6 | 93 | 7 | 0.9 | 93 | 13 |
| Actinobacteria | Rothia | 11 | 0.7 | 73 | 15 | 0.1 | 53 | 47 |
| Fusobacteria | Leptotrichia | 12 | 0.7 | 73 | 11 | 0.3 | 67 | 33 |
| Proteobacteria | Campylobacter | 13 | 0.5 | 87 | 13 | 0.2 | 60 | 40 |
| Actinobacteria | Actinomyces | 14 | 0.5 | 80 | 16 | 0 | 47 | 47 |
| Firmicutes | Oribacterium | 15 | 0.3 | 60 | 12 | 0.2 | 67 | 33 |
| Firmicutes | Solobacterium | 16 | 0.2 | 60 | 18 | 0 | 33 | 40 |
| Actinobacteria | Atopobium | 17 | 0.2 | 53 | 19 | 0 | 27 | 53 |
| Firmicutes | Megasphaera | 18 | 0.2 | 53 | 21 | 0 | 20 | 33 |
| Firmicutes | Peptostreptococcus | 19 | 0.1 | 53 | 22 | 0 | 20 | 60 |
| Bacteroidetes | Capnocytophaga | 20 | 0 | 47 | 17 | 0 | 47 | 27 |
| Proteobacteria | Pseudomonas | 21 | 0 | 47 | 27 | 0 | 7 | 40 |
| Proteobacteria | Aggregatibacter | 22 | 0 | 40 | 14 | 0.1 | 53 | 27 |
| Tenericutes | Mycoplasma | 23 | 0 | 27 | 28 | 0 | 7 | 20 |
| Proteobacteria | Delftia | 24 | 0 | 20 | 30 | 0 | nd | 20 |
| Proteobacteria | Kingella | 25 | 0 | 20 | 23 | 0 | 20 | 27 |
| Proteobacteria | Phocoenobacter | 26 | 0 | 20 | 24 | 0 | 13 | 20 |
| Proteobacteria | Stenotrophomonas | 27 | 0 | 20 | 31 | 0 | nd | 20 |
| Fusobacteria | Streptobacillus | 28 | 0 | 13 | 20 | 0 | 27 | 13 |
| Proteobacteria | Bibersteinia | 29 | 0 | 13 | 26 | 0 | 7 | 7 |
| Proteobacteria | Bradyrhizobium | 30 | 0 | 13 | 29 | 0 | nd | 13 |
| Fusobacteria | Sneathia | 31 | 0 | 7 | 25 | 0 | 7 | 0 |
Percentage of samples that contained the genus.
Disagreement between paired EST and biopsy samples.
In bold are the genera significantly different between the biopsy and the EST.
This table lists the top 20 genera in rank of median relative abundance. Also featured are the percentage detection and disagreement from the 15 individual biopsies and ESTs, (nd, not detected).
Bacterial communities are different in the oral, nasal, and esophageal microenvironments
We defined the bacterial community of each microenvironment captured by the string and swabs. Comparisons of the microbiome captured in oral cavity and EST samples reveal two genera differences (Figure 6A); Prevotella was found in significantly higher amounts in the EST (P = 0.002), whereas Neisseria was significantly lower in ESTs (P = 0.03). In addition, comparisons of the microbiome captured in the nasal cavity and EST samples revealed significant differences across several phyla and genera (Figure 6B). Finally, results with the nasal and oral microbiome revealed multiple differences in these two locations (Figure 6C). These results suggest that each of these microenvironments harbor specific taxa that distinguish the sites, and importantly, that the esophageal segment of the EST does not become contaminated by the oral microbiome upon removal.
Figure 6. Oral and nasal microbiomes differ from the esophageal microbiome.

DNA samples were taken from the oral, nasal and EST and the microbiome identified using 454 pyrosequencing. Bacterial phyla are compared between biopsy and EST samples and results displayed using Manhattan plot as follows. A. Esophagus (EST) compared to the oral cavity, Genera that were significantly different are numbered. Numbers represent: 1, Prevotella; 2, Neisseria. 1, had higher relative abundance in EST. B. Esophagus (EST) compared to the nasal cavity. Numbers represent 1, Corynebacterium; 2, Propionibacterium; 3 Porphyromonas; 4, Prevotella; 5, Staphylococcus; 6, Streptococcus; 7, Veillonella; 8, Fusobacterium; 9, Haemophilus; 10, Pasteurella. Numbers 3, 4, 6–10 were higher in EST. C. Nasal cavity compared to the oral cavity. Numbers represent: 1, Corynebacterium; 2, Propionibacterium; 3, Porphyromonas; 4, Prevotella; 5, Staphylococcus; 6, Streptococcus; 7, Veillonella; 8, Fusobacterium; 9, Aggregatibacterium; 10, Haemophilus; 11, Pasteurella. Numbers 3, 4, 6–11 were higher in oral samples. Gray horizontal lines indicate significant differences (p<0.05 and p<0.01). Phyla are represented on the X-axis as different colors as in the key.
Discussion
As the role of the microbiota in the pathogenesis of disease becomes increasingly evident, there is need for development of new and less invasive tools with which to sample microbiomes in specific microenvironments throughout the body [1]. Use of mucosal biopsies has contributed to an emerging body of data identifying changes in esophageal microbiome in both health and disease [4], [5], [6], [7], [8], [22]. In this study, we surveyed the microbiome associated with normal non-inflamed mucosal biopsy samples the “gold standard” and the proximal section of the Enterotest or Esophageal String Test (EST). Results from our studies contribute to a growing body of research defining the esophageal microbiome and provide strong evidence that the microbial composition captured by the EST accurately reflects the microbiome as compared to mucosal biopsy samples. The EST technique is less costly and incurs less risk, while potentially providing a more comprehensive view of the esophagus than is obtained with a more limited, single ∼3 mm mucosal biopsy sample, as the EST interrogates a significantly greater surface area of the esophagus. We conclude that the EST is an appropriate tool with which to assess the esophageal microbial microenvironment.
Several methods have been used to capture esophageal microbiome samples but all have utilized endoscopy. Previous studies measuring the esophageal microbiome from mucosal biopsy sampling identified patterns of remarkable similarity to that identified with the EST [4]. Consistent with these studies, our results reveal that the predominant genera in the esophagus are Streptococcus, Prevotella and Veillonella [3], [4], [5], [6], [8]. Esophageal aspirates and esophageal brushing were able to capture similar bacteria [6] [5]. While these later two techniques seek to procure mucosal samples without biopsy, they both require upper endoscopy to obtain samples. Thus, while each of these techniques captures similar bacteria to the EST, the EST offers the benefit of its minimally invasive nature.
Traditional culture techniques have been used to identify the makeup of the esophageal microbiome, thus, leaving non-cultivable bacteria unidentified [23]. Our study took advantage of culture-independent sequencing techniques that are capable of identifying many organisms in parallel, without prior knowledge of growth requirements. This technique provides a more complete catalog of the esophageal microbial community as a reference for future studies.
Direct comparisons of the microbiome in the nasal, oral and esophageal cavities have not been previously reported. While one might expect that the intimate anatomical connections of these organs would lend to their possessing similar microbiomes, our results and that of others have indicated that the nasal microbiome [24], [25] is distinct from the oral and esophageal microbiomes [5]. Our study compared all three bacterial assemblages simultaneously, and found that despite some similarities between sites, distinct differences occur in the normal, oral and nasal cavity, and the esophagus. Whether this trend holds during inflammatory processes, awaits further study.
Over the last decade, a growing body of knowledge has demonstrated the influence of the gastrointestinal microbiome on health and disease. For instance, alterations of the colonic microbiome have been associated with Crohn's disease as well as obesity [26], [27], [28], [29]. Although such studies indicate potential roles of the colonic microbiome in colonic disease, much less is known about the role of the microbiome in the esophagus. A critical issue has been access to specimens for analysis of esophageal microbiology. In contrast to the relative ease in obtaining fecal samples, human studies of the rest of the gastrointestinal tract rely primarily on samples obtained through mucosal biopsies at the time of endoscopy. Repeated sampling of anatomical spaces is required to address stability since the microbiome can change over time and with treatments [30], [31]. Access to esophageal luminal contents with minimally invasive collection, as with the EST, will allow more sampling opportunities for exploring upper gastrointestinal tract diseases.
In the current study, some of the subjects were on various treatments (PPI, steroids, restricted diet) at the time of sample collection that could affect the microbiome as compared to normal individuals without any treatment: e.g., the use of PPIs was found to increase the bacterial load on esophageal biopsies [32]. Furthermore, steroid responsiveness has been associated with the microbiome in inflammatory bowel diseases [33]. Diet is another factor that is known to influence the microbiota [28], [34]. Dentogingival health may also affect the oral microbiome [35] and potentially the esophageal microbiome. However, the goal of this study was to determine if the EST could accurately reflect the mucosal microbiome, and we did not have adequate power to determine the effect of a specific treatment on the esophageal microbiota. Larger studies, facilitated by the EST, will address this issue as adequate numbers of subjects without esophageal involvement are recruited.
Overall, the EST was well tolerated in our study, with gagging noted as the only side effect in some subjects. Contamination from adjacent sites is possible, but our results suggest clear differences in the microbiota. Consistent with previous studies our results show that, some bacteria found in the normal oral cavity, such as Spirochetes and Deferribacteres [36], are not conspicuous in the normal esophagus [5]. Our study included a larger number of females than males, but we saw no influence of gender on our findings. However, it has been reported that in the absence of disease, similar phylum level patterns are observed in the esophageal and gastric compartment independent of ethnicity or gender [36].
Rare genera were detected more frequently in biopsy samples than on the EST, and there are several possible explanations for this observation. The EST is able to capture microbiome from a greater esophageal surface area, and thereby increase the signal from common genera and making detection of rare genera less frequent with EST samples. Further, it is possible that different taxa have variable affinities for the mucosa, perhaps affecting the ability of the string to capture them. Additionally, the overnight placement of the string in the esophagus may allow particular genera to proliferate and thereby alter relative abundances seen molecularly.
In conclusion, the EST is a novel, minimally invasive device with which to sample the esophageal microbiome, with results comparable to those obtained with esophageal biopsies. Use of the device is particularly appropriate for children, as it obviates the need for endoscopy and anesthesia. Easier sampling of the esophageal lumen using the EST will facilitate future studies of the esophageal microbiome in disease and health.
Supporting Information
Esophageal String Test. The Enterotest™ capsule with the extruded string is shown. The top arrow shows the portion of the string that is taped to the cheek. The bottom arrow indicates the weighted capsule that is dislodged in the duodenum.
(TIF)
16S amplification and detection of oral, nasal and esophageal microenvironments. This is a picture of a representative 2% agarose gel with a 200 bp amplification product from the V2–V3 region of the 16S rDNA gene. DNA samples were obtained from nasal swabs, oral strings, ESTs and esophageal biopsies.
(TIF)
Acknowledgments
The authors acknowledge the efforts of Zachary Robinson, Lindsay Hosford, Alyson Yeckes, Joseph Ruybal and Ha Na Choe for their technical help and Dr. Randall Holmes for the critical review and discussion of the manuscript. We thank the physicians (Robert Kramer, Edward Hoffenberg, Edwin Liu, Edwin de Zoeten, Shikha Sundaram, Cara Mack, Michael Narkewicz, Ronald Sokol, Jason Soden, Deborah Neigut, David Brumbaugh and Christine Waasdorp Hurtado) and nurses (Tammy Armstrong and Jo Anne Newton) and research coordinator (Rachel Harris) and technical staff (Bill Marcovich) who contributed to this work by helping to collect samples and recruiting subjects. We are grateful to our patients and families who consented to be a part of this study.
Funding Statement
The authors recognize the support of REDCap for subjects' database supported by the National Center for Research Resources and the National Center for Advancing Translational Sciences, National Institutes of Health, Colorado CTSI Grant Number UL1 RR025780. This work was supported by the American Partnership For Eosinophilic Disorders (APFED) Junior Faculty HOPE Research Grant (SF); National Center for Research Resources and the National Center for Advancing Translational Sciences, National Institutes of Health, Colorado CTSI Grant Number KL2 RR025779 (SF) and UL1 RR025780 (GTF) and the Campaign Urging Research for Eosinophilic Diseases (CURED) (SJA/GTF). The content is solely the responsibility of the authors and does not necessarily represent the official views of the NIH. The funders had no role in study design, data collection and analysis, decision to publish, or preparation of the manuscript.
References
- 1. The Human Microbiome Project Consortium (2012) Structure, function and diversity of the healthy human microbiome. Nature 486: 207–214. [DOI] [PMC free article] [PubMed] [Google Scholar]
- 2. Huse SM, Ye Y, Zhou Y, Fodor AA (2012) A Core Human Microbiome as Viewed through 16S rRNA Sequence Clusters. PLoS One 7: e34242. [DOI] [PMC free article] [PubMed] [Google Scholar]
- 3. Pajecki D, Zilberstein B, dos Santos MA, Ubriaco JA, Quintanilha AG, et al. (2002) Megaesophagus microbiota: a qualitative and quantitative analysis. J Gastrointest Surg 6: 723–729. [DOI] [PubMed] [Google Scholar]
- 4. Pei Z, Bini EJ, Yang L, Zhou M, Francois F, et al. (2004) Bacterial biota in the human distal esophagus. Proc Natl Acad Sci U S A 101: 4250–4255. [DOI] [PMC free article] [PubMed] [Google Scholar]
- 5. Norder Grusell E, Dahlen G, Ruth M, Ny L, Quiding-Jarbrink M, et al. (2012) Bacterial flora of the human oral cavity, and the upper and lower esophagus. Dis Esophagus [DOI] [PubMed] [Google Scholar]
- 6. Macfarlane S, Furrie E, Macfarlane GT, Dillon JF (2007) Microbial colonization of the upper gastrointestinal tract in patients with Barrett's esophagus. Clin Infect Dis 45: 29–38. [DOI] [PubMed] [Google Scholar]
- 7. Yang L, Lu X, Nossa CW, Francois F, Peek RM, et al. (2009) Inflammation and intestinal metaplasia of the distal esophagus are associated with alterations in the microbiome. Gastroenterology 137: 588–597. [DOI] [PMC free article] [PubMed] [Google Scholar]
- 8. Gagliardi D, Makihara S, Corsi PR, Viana Ade T, Wiczer MV, et al. (1998) Microbial flora of the normal esophagus. Dis Esophagus 11: 248–250. [DOI] [PubMed] [Google Scholar]
- 9. Thomas GE, Goldsmid JM, Wicks AC (1974) Use of the enterotest duodenal capsule in the diagnosis of giardiasis. A preliminary study. S Afr Med J 48: 2219–2220. [PubMed] [Google Scholar]
- 10. Goldsmid JM, Davies N (1978) Diagnosis of parasitic infections of the small intestine by the Enterotest duodenal capsule. Med J Aust 1: 519–520. [DOI] [PubMed] [Google Scholar]
- 11. Gracey M, Suharjono, Sunoto (1977) Use of a simple duodenal capsule to study upper intestinal microflora. Arch Dis Child 52: 74–76. [DOI] [PMC free article] [PubMed] [Google Scholar]
- 12. Kopanski Z, Schlegel-Zawadzka M, Witkowska B, Cienciala A, Szczerba J (1996) Role of the enterotest in the diagnosis of the Helicobacter pylori infections. Eur J Med Res 1: 520–522. [PubMed] [Google Scholar]
- 13. Leong RW, Lee CC, Ling TK, Leung WK, Sung JJ (2003) Evaluation of the string test for the detection of Helicobacter pylori. World J Gastroenterol 9: 309–311. [DOI] [PMC free article] [PubMed] [Google Scholar]
- 14. Hamady M, Walker JJ, Harris JK, Gold NJ, Knight R (2008) Error-correcting barcoded primers for pyrosequencing hundreds of samples in multiplex. Nat Methods 5: 235–237. [DOI] [PMC free article] [PubMed] [Google Scholar]
- 15. Harris JK, Sahl JW, Castoe TA, Wagner BD, Pollock DD, et al. (2010) Comparison of Normalization Methods for Construction of Large Multiplex Amplicon Pools for Next-Generation Sequencing. Appl Environ Microbiol [DOI] [PMC free article] [PubMed] [Google Scholar]
- 16. Frank DN (2009) BARCRAWL and BARTAB: software tools for the design and implementation of barcoded primers for highly multiplexed DNA sequencing. BMC Bioinformatics 10: 362. [DOI] [PMC free article] [PubMed] [Google Scholar]
- 17. Nawrocki EP, Kolbe DL, Eddy SR (2009) Infernal 1.0: inference of RNA alignments. Bioinformatics 25: 1335–1337. [DOI] [PMC free article] [PubMed] [Google Scholar]
- 18. Haas BJ, Gevers D, Earl AM, Feldgarden M, Ward DV, et al. (2011) Chimeric 16S rRNA sequence formation and detection in Sanger and 454-pyrosequenced PCR amplicons. Genome Res 21: 494–504. [DOI] [PMC free article] [PubMed] [Google Scholar]
- 19. Wang Q, Garrity GM, Tiedje JM, Cole JR (2007) Naive Bayesian classifier for rapid assignment of rRNA sequences into the new bacterial taxonomy. Appl Environ Microbiol 73: 5261–5267. [DOI] [PMC free article] [PubMed] [Google Scholar]
- 20. Jost L (2007) Partitioning diversity into independent alpha and beta components. Ecology 88: 2427–2439. [DOI] [PubMed] [Google Scholar]
- 21. Wagner BD, Robertson CE, Harris JK (2011) Application of two-part statistics for comparison of sequence variant counts. PLoS One 6: e20296. [DOI] [PMC free article] [PubMed] [Google Scholar]
- 22. Pei Z, Yang L, Peek RM Jr, Levine SM, Pride DT, et al. (2005) Bacterial biota in reflux esophagitis and Barrett's esophagus. World J Gastroenterol 11: 7277–7283. [DOI] [PMC free article] [PubMed] [Google Scholar]
- 23. Pace NR (1997) A molecular view of microbial diversity and the biosphere. Science 276: 734–740. [DOI] [PubMed] [Google Scholar]
- 24. Frank DN, Feazel LM, Bessesen MT, Price CS, Janoff EN, et al. (2010) The human nasal microbiota and Staphylococcus aureus carriage. PLoS One 5: e10598. [DOI] [PMC free article] [PubMed] [Google Scholar]
- 25. Lemon KP, Klepac-Ceraj V, Schiffer HK, Brodie EL, Lynch SV, et al. (2010) Comparative analyses of the bacterial microbiota of the human nostril and oropharynx. MBio 1. [DOI] [PMC free article] [PubMed] [Google Scholar]
- 26. Frank DN, St Amand AL, Feldman RA, Boedeker EC, Harpaz N, et al. (2007) Molecular-phylogenetic characterization of microbial community imbalances in human inflammatory bowel diseases. Proc Natl Acad Sci U S A 104: 13780–13785. [DOI] [PMC free article] [PubMed] [Google Scholar]
- 27. Frank DN, Robertson CE, Hamm CM, Kpadeh Z, Zhang T, et al. (2011) Disease phenotype and genotype are associated with shifts in intestinal-associated microbiota in inflammatory bowel diseases. Inflamm Bowel Dis 17: 179–184. [DOI] [PMC free article] [PubMed] [Google Scholar]
- 28. Turnbaugh PJ, Hamady M, Yatsunenko T, Cantarel BL, Duncan A, et al. (2009) A core gut microbiome in obese and lean twins. Nature 457: 480–484. [DOI] [PMC free article] [PubMed] [Google Scholar]
- 29. Willing BP, Dicksved J, Halfvarson J, Andersson AF, Lucio M, et al. (2010) A pyrosequencing study in twins shows that gastrointestinal microbial profiles vary with inflammatory bowel disease phenotypes. Gastroenterology 139: 1844–e1841, 1844-1854, e1841. [DOI] [PubMed] [Google Scholar]
- 30. Costello EK, Lauber CL, Hamady M, Fierer N, Gordon JI, et al. (2009) Bacterial community variation in human body habitats across space and time. Science 326: 1694–1697. [DOI] [PMC free article] [PubMed] [Google Scholar]
- 31. Grice EA, Kong HH, Conlan S, Deming CB, Davis J, et al. (2009) Topographical and temporal diversity of the human skin microbiome. Science 324: 1190–1192. [DOI] [PMC free article] [PubMed] [Google Scholar]
- 32. Osias GL, Bromer MQ, Thomas RM, Friedel D, Miller LS, et al. (2004) Esophageal bacteria and Barrett's esophagus: a preliminary report. Dig Dis Sci 49: 228–236. [DOI] [PubMed] [Google Scholar]
- 33. Michail S, Durbin M, Turner D, Griffiths AM, Mack DR, et al. (2011) Alterations in the gut microbiome of children with severe ulcerative colitis. Inflamm Bowel Dis [DOI] [PMC free article] [PubMed] [Google Scholar]
- 34. Jumpertz R, Le DS, Turnbaugh PJ, Trinidad C, Bogardus C, et al. (2011) Energy-balance studies reveal associations between gut microbes, caloric load, and nutrient absorption in humans. Am J Clin Nutr 94: 58–65. [DOI] [PMC free article] [PubMed] [Google Scholar]
- 35. Dahlen G (2009) Bacterial infections of the oral mucosa. Periodontol 2000 49: 13–38. [DOI] [PubMed] [Google Scholar]
- 36. Lawson RD, Coyle WJ (2010) The noncolonic microbiome: does it really matter? Curr Gastroenterol Rep 12: 259–262. [DOI] [PubMed] [Google Scholar]
Associated Data
This section collects any data citations, data availability statements, or supplementary materials included in this article.
Supplementary Materials
Esophageal String Test. The Enterotest™ capsule with the extruded string is shown. The top arrow shows the portion of the string that is taped to the cheek. The bottom arrow indicates the weighted capsule that is dislodged in the duodenum.
(TIF)
16S amplification and detection of oral, nasal and esophageal microenvironments. This is a picture of a representative 2% agarose gel with a 200 bp amplification product from the V2–V3 region of the 16S rDNA gene. DNA samples were obtained from nasal swabs, oral strings, ESTs and esophageal biopsies.
(TIF)