Abstract
X-ray phase contrast imaging has overcome the limitations of X-ray absorption imaging in many fields. Particular effort has been directed towards developing phase retrieval methods: These reveal quantitative information about a sample, which is a requirement for performing X-ray phase tomography, allows material identification and better distinction between tissue types, etc. Phase retrieval seems impossible with conventional X-ray sources due to their low spatial coherence. In the only previous example where conventional sources have been used, collimators were employed to produce spatially coherent secondary sources. We present a truly incoherent phase retrieval method, which removes the spatial coherence constraints and employs a conventional source without aperturing, collimation, or filtering. This is possible because our technique, based on the pixel edge illumination principle, is neither interferometric nor crystal based. Beams created by an X-ray mask to image the sample are smeared due to the incoherence of the source, yet we show that their displacements can still be measured accurately, obtaining strong phase contrast. Quantitative information is extracted from only two images rather than a sequence as required by several coherent methods. Our technique makes quantitative phase imaging and phase tomography possible in applications where exposure time and radiation dose are critical. The technique employs masks which are currently commercially available with linear dimensions in the tens of centimeters thus allowing for a large field of view. The technique works at high photon energy and thus promises to deliver much safer quantitative phase imaging and phase tomography in the future.
Keywords: X-ray imaging, differential phase contrast
Phase imaging is particularly well suited to many applications where relevant features are poorly revealed by absorption radiography. Images of improved clarity and contrast are produced by making use of additional information encoded in photons that are not absorbed by the sample. In mammography, for example, phase imaging not only leads to improved delineation (1, 2) but also allows higher energy X-rays to be used thus leading to dose reduction (3). Image contrast due to phase variations reduces more slowly than absorption contrast as photon energy increases thus suggesting that X-ray radiography could in the future be performed with a significantly reduced radiation dose. The method we present here results in both quantitative phase and absorption images from only two images using a totally incoherent source without collimation or filtering. This advance makes the method available to a much wider range of laboratories and opens the way to new applications; in particular, not having to collimate or filter the source results in the full emitted flux being available for imaging, which makes the method accessible to a broader range of applications, especially where radiation dose and acquisition time are critical.
Image contrast in absorption radiography is formed by the absorption of X-rays. Such images are interpreted assuming that X-rays propagate along a straight line through the sample, i.e., they are not refracted. In quantitative phase imaging we, however, seek to quantify the refraction of X-rays as well as their attenuation. A number of quantitative techniques have been demonstrated but have, hitherto, required X-ray fields with high spatial and/or temporal coherence. Although some of these techniques have been demonstrated with an incoherent source, in each case, the spatial and/or temporal coherence of the resulting light field is increased by filtering or aperturing. One method, known as analyzer-based imaging (ABI) develops contrast using the rocking curve of an analyzer crystal (4). Algorithms have been developed to separate phase and absorption information using a variety of approximations (5–7). The technique requires a highly parallel beam with high temporal coherence thus restricting it to synchrotron light sources or monochromated laboratory sources (8, 9). Another method for performing quantitative X-ray phase contrast imaging (XPCI) is by using in-line holography (10) combined with phase extraction algorithms (11, 12). This technique requires a source of very high spatial coherence thus limiting it to synchrotron sources or microfocal laboratory sources. The final method is known as grating interferometry, which employs two (13, 14) or three gratings (15–17) to produce a periodic set of fringes through the phenomenon of Talbot self-imaging. The phase shift and attenuation due to an object is thus sensed according to the relative shift and attenuation of the fringes by phase stepping an analyzer grating. This method requires a source, albeit a secondary source, of high spatial coherence thus necessitating the use of a source grating when laboratory sources are employed to create an array of mutually incoherent but individually coherent sources.
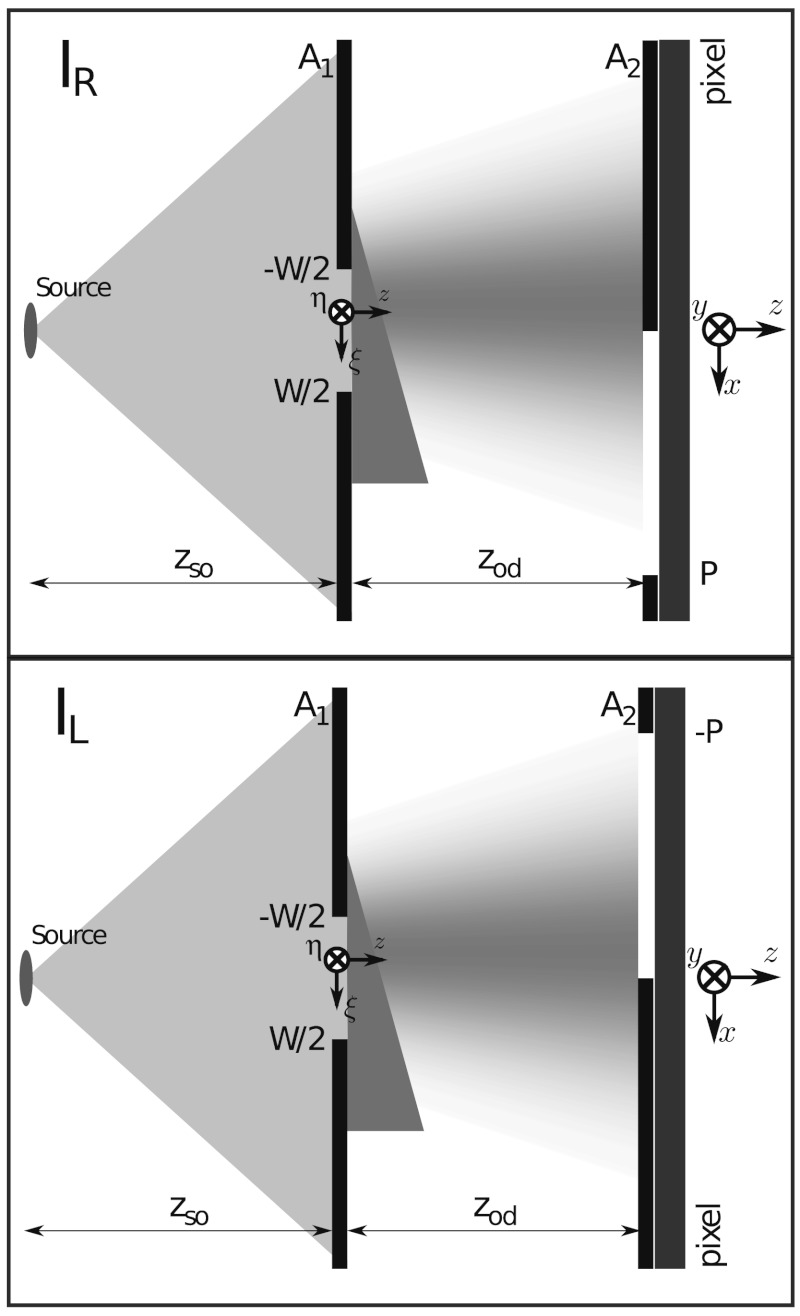
The quantitative technique presented in this paper makes use of the coded aperture XPCI (CAXPCI) system (18, 19). The technique thus employs an unfiltered and unapertured laboratory X-ray source, consequently achieving short exposure times (20) and operating at high photon energies (21). The technique requires a single beam to be incident upon a pixel edge as shown in Fig. 1. Note that this may be an actual pixel edge or an opaque edge positioned in front of a pixel. If a single beam is used, the entire object must be scanned through the beam to build up an image. Alternatively, several beams can be combined in a periodic array to image an entire object simultaneously. The width of the apertures makes the system relatively insensitive to misalignment and also scalable to large fields of view. This, however, does not come at the expense of reduced sensitivity due to the pixel edge illumination contrast mechanism (18).
Fig. 1.
Schematic diagram of the system used obtain quantitative CAXPCI images. Note that the diagram is not to scale, for example, zso = 1.6 m and W = 16 μm were used to obtain results for this paper.
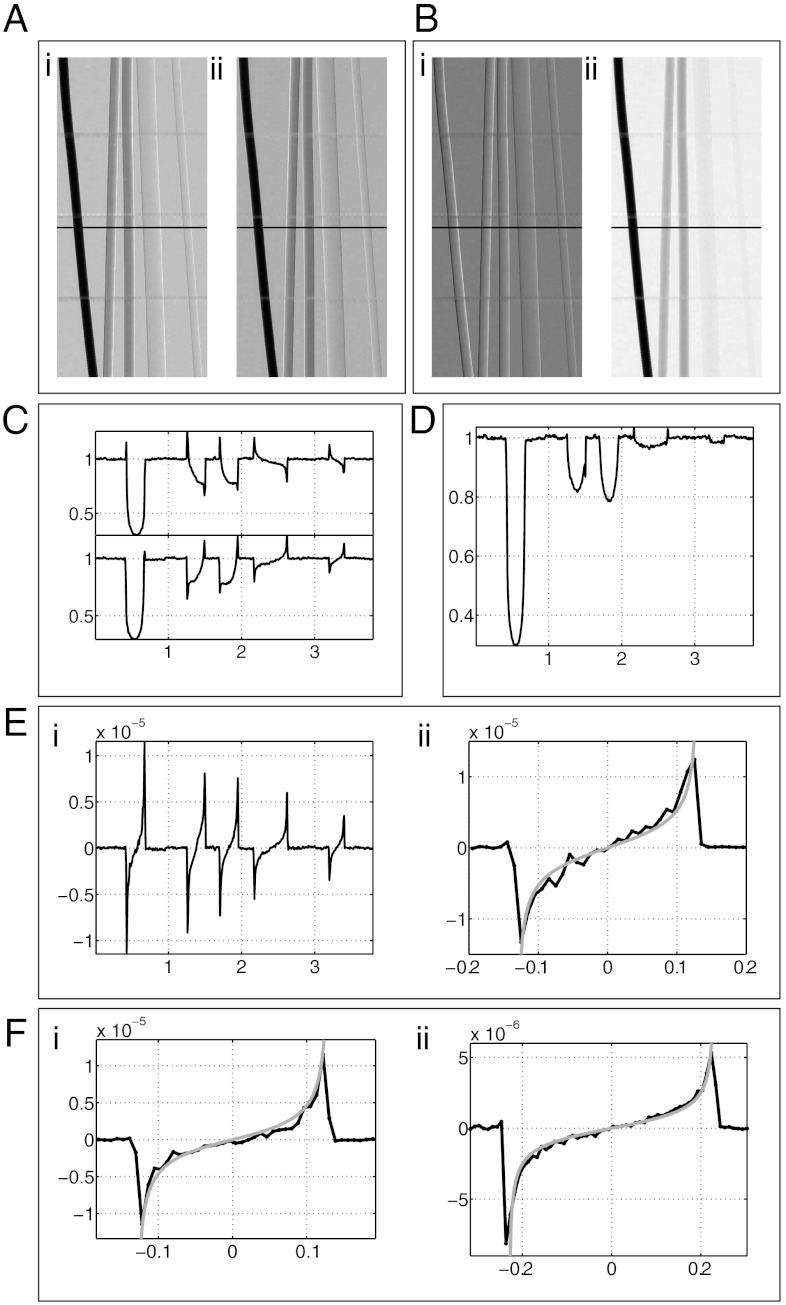
Each CAXPCI beam is shaped by aperture A1 in Fig. 1 and each corresponding pixel edge is formed by aperture A2. Although not always the case, the widths of the apertures (i.e., W and P) often obey the relationship P = W(zso + zod)/zso. In this case we say that W(zso + zod)/zso is the projected width of A1. When a wide field CAXPCI system is employed the projected pitch of the two periodic apertures must match. Positioning an object after A1 leads to the refraction and absorption of the X-ray beams incident upon A2. The alignment of A1 and A2 allows a combination of phase and absorption imaging or dark field imaging to be performed. Quantitative CAXPCI is performed by taking an image of the sample using both of the grating positions shown in Fig. 1. This work varies significantly from previous work on CAXPCI as we are now able to quantify the absorption and differential phase of a sample. Whereas in previous publications, mixed phase and absorption images such as shown in Fig. 2A were obtained, we can now separate phase and absorption information resulting in images as shown in Fig. 2B.
Fig. 2.
Phantom images and profiles. (A) Raw images, IR (i) and IL (ii) of a phantom of filaments made of titanium (125 μm radius), sapphire (125 μm radius), aluminium (125 μm radius), PEEK (225 μm radius), and PEEK (100 μm radius) respectively, going from left to right. (B) Extracted DP (i) and absorption (ii) images. (C) Raw image profiles along the line indicated in images A, i and ii. (D) Absorption image profile. Note how the raw image profiles for titanium in C possess only positive peaks and yet the peaks are still nulled in the absorption image. This is due to a subtle asymmetry in the raw profiles and is explained further in the SI Text. (E) DP image profile (i) and blow up of the titanium profile (ii) comparing the theoretical effective DP profile. (F) Monochromatic DP profiles of titanium (125 μm radius, i) and PEEK (225 μm radius, ii) along with theoretical DP profiles at the synchrotron photon energy of 20 keV. It should be noted that the plots in F are the only results in thus paper that were not acquired using a conventional source. The horizontal units of plots C–F are in millimeters.
Results
At X-ray energies the refractive index of a material is usually written as n = 1 - δ + iβ, where δ is the refractive index decrement and β is the absorption index. Both have a strong , but different, dependence upon photon energy. For thin samples one can say that the complex amplitude of a wave front that propagates through a sample will be modified by a multiplicative factor T(ξ,η) = exp(-ikϕ(ξ,η) - kμ(ξ,η)), where
 |
[1] |
and k is the wave number and integration is taken over extent of the object along the direction of wave propagation. The coordinate system (ξ,η,z) is illustrated in Fig. 1 and Greek symbols have been used to avoid confusion with coordinates in the space of the detector pixel. The CAXPCI system is sensitive to phase gradients in the ξ direction and so for the remainder of this paper ϕ′ denotes (∂/∂ξ)ϕ(ξ,η). By applying the stationary wave approximation to the Fresnel-Kirchhoff diffraction integral, the complex amplitude incident upon A2 due to a monochromatic point source is well approximated by (22)
 |
[2] |
where g(ξ,x) = ϕ(ξ) + (M/(2zod))ξ2 - (x/zod)ξ, M = (zso + zod)/zso and the summation is over all stationary points, ξi(x), of g(ξ,x). Note that the presample aperture requires that all ξi(x) satisfy ξi(x)∈[-W/2,W/2]. Note that the y dependence of Eq. 2 has been omitted for brevity only because the system is not sensitive to phase gradients in this direction. The signal detected by the pixel is found by integrating |U0|2 over the region of the pixel left exposed by the aperture. We can now relax the assumption of a point source by assuming the uncorrelated source focal spot to have a Gaussian distribution. When this is the case the detector signals IL and IR configurations may be found as (22)
 |
[3] |
 |
[4] |
where K(x,ΔP) is the effective pixel function developed in ref. (22) and defined as
 |
[5] |
where  and FWHM is the full width at half maximum of the source focal spot and erf is the standard error function
  . Note that the spatial coherence of the source is embodied in K rather than in the expression of X-ray intensity. If a polychromatic source were employed, the quantities IL and IR would be found by integrating over each monochromatic component weighted by the source spectrum and detector response. In this case the measured values of ϕ′ and μ refer to values averaged over the spectrum and are thus denoted by
  and
and  , respectively.
In order to extract ϕ′ and μ from measurements of IL and IR we must simplify (Eqs. 3 and 4). We start by defining the function
| [6] |
and substituting x = h(ξ) into (Eqs. 3 and 4), then after some manipulation we obtain expressions for IL and IR as
 |
[7] |
 |
[8] |
where C is a constant. See the SI Text for a thorough derivation of Eqs. 7 and 8. This result is valid under either of two conditions. Either the signal arising from the interference of different terms in the summation of Eq. 2 can be neglected, or, g′(ξ,x) = 0 has at most one solution for each x. The first condition holds when an incoherent source is used. The second condition holds also for the vast majority of resolvable samples encountered in practice given typical presample aperture sizes of between 15 μm and 50 μm although the apertures may be larger than this. We then form the sum and difference of IL and IR as
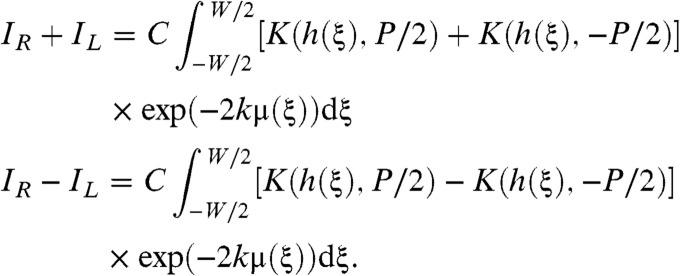 |
[9] |
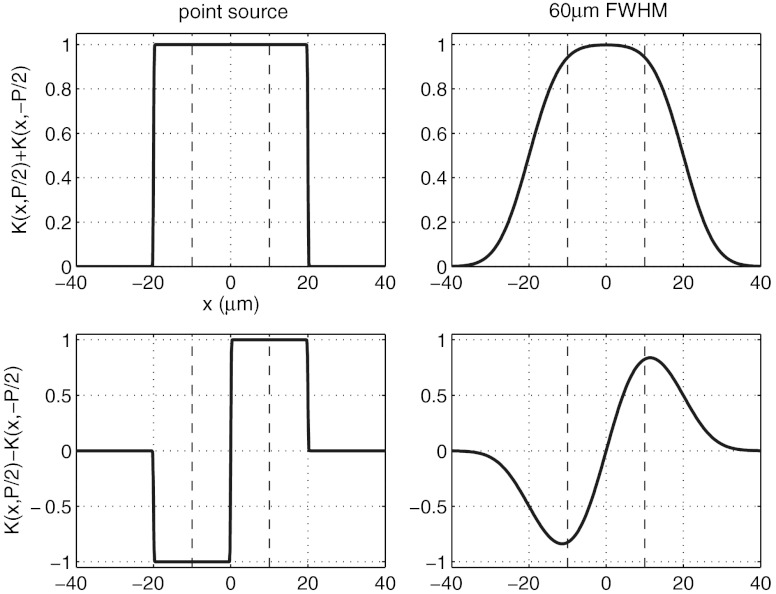
Fig. 3 shows plots of the sum and difference of the K(x, ± P/2) functions for a typical lab setup for both point sources and a source focal spot FWHM of 60 μm. Values of zso = 1.6 m and zod = 0.4 m were used. By assuming that ϕ′ and μ are approximately constant within the presample aperture we can write, to a good approximation:
| [10] |
where this result is exact in the case of a point source. In this case, IR - IL is easily evaluated as
 |
[11] |
Fig. 3.
Plots of the sum and difference of the K(x, ± P/2) functions for a point source and a source with focal spot FWHM of 60 μm. The broken lines indicate the position of the projected presample aperture.
In the case of an extended source, we expand erf in a Taylor series about x = 0 which allows us to obtain
 |
[12] |
which gives the following formulae for retrieving the differential phase (DP) image:
 |
[13] |
where the overline has been included to emphasize the mean nature of the measured phase gradient when a polychromatic source is employed. It is interesting to note the similarity between Eq. 13 and those of Chapman et al. (4) who demonstrated phase and absorption retrieval using an analyzer crystal. We indeed took inspiration from this synchrotron method in developing our incoherent source method that is, nonetheless, based on a different sensing principle. One might note the possibility of an absorption gradient alone producing a potentially spurious phase gradient in Eq. 13. However, the subpixel images acquired by scanning the sample by a subpixel amount allow this phenomenon to be detected because each part of the sample is imaged by both the IR and IL configurations. Evaluation of Eq. 13 for IR and IL corresponding to the same part of the sample is compared to the standard evaluation thus revealing any potentially erroneous phase gradients. This phenomenon was not, however, detected in the presented results. One reason for this is that this effect is made practically negligible by the use of an extended source because it acts to average any absorption gradient as is shown in the SI Text. The beams incident upon the detector aperture are approximately Gaussian, even when an absorption gradient is present. Yet, the entire beam is shifted due to a phase gradient and so phase sensitivity is not lost. In this case, only two images are required to retrieve sample phase and absorption. If, however, a point source is employed in the presence of strong absorption gradients it may be necessary to acquire more than two images. This is because we have developed a method to correct the measured phased gradient in the presence of strong absorption gradients as is also shown in the SI Text.
Image of a Ground Beetle.
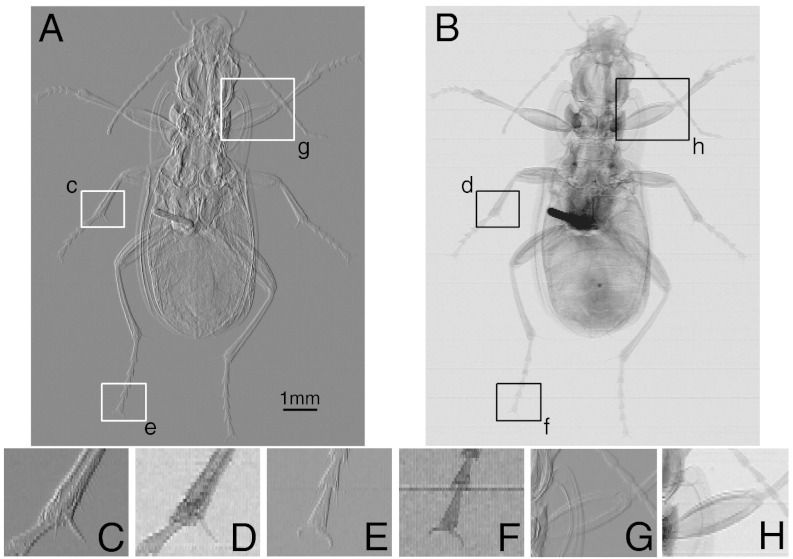
The very high sensitivity of the technique is demonstrated by images of a ground beetle in Fig. 4. These images were acquired using a Rigaku 007HF X-ray tube generator operated at 35 kVp/25 ma with a rotating Mo target. Theoretical calculation and experimental measurement confirmed the source FWHM as 60 μm. A wide field CAXPCI setup was employed with an 85 μm pixel size Anrad SMAM flat panel detector. Grating A2 had a pitch of 83.5 μm and an opening of P = 20 μm. A1 had a pitch of 66.8 μm and an opening of W = 12 μm. The gratings were manufactured by Creatv Microtech (Potomac, Maryland). Images were taken at eight subpixel positions to increase spatial resolution.
Fig. 4.
Differential phase and absorption images of a ground beetle. (A) The DP image ( ) for a ground beetle. (B) The absorption image
  of the ground beetle. The smaller images along the lower part of the figure are blown up versions of the boxed regions in A and B. In both cases the image contrast has been saturated slightly to enhance the visibility. Note also that the highly absorbing region near the center of the beetle is a metal pin. (C and D) Small hairs attached to the leg are visible on the DP contrast image (C), yet completely invisible in the absorption image (D). Other fine details are much better defined in the DP image. (E and F) Structure and fine details are much better resolved in the DP image (E). (G and H) Internal structure of over laying features are much better defined in the DP image (G).
The DP image is in general sharper and reveals substantially more detail than the absorption image. Many fibrils visible in the DP image are invisible in the absorption image. Nearly all details are better defined in the differential phase (DP) image than the absorption image. The crucial aspect of the images in Fig. 4 is that details are present in the DP image that are significantly smaller than P and the grating pitch, thus demonstrating what we know from theory, that the method’s sensitivity is indeed not constrained by either of these quantities.
Phantom Images.
We also performed phantom measurements using a number of filaments described in the caption of Fig. 2 to verify the accuracy of the technique. The first set of images were acquired using the same system as that used to image the ground beetle with the exception that a presample aperture, A1, of pitch 134 μm and W = 16 μm was used to reduce the effect of pixel spillover on the acquired images (23). This means that every second column of pixels was ignored. Subsequently, 16 subpixel images are required to obtain the same spatial resolution as the image of the ground beetle.
The phantom images reveal a number of important properties of the technique. Firstly, DP images can be obtained for highly as well as weakly absorbing materials. For example, the raw profiles of the titanium filament in Fig. 2C show very little phase contrast yet an accurate phase profile is still extracted. Further, accurate DP profiles are also obtained for the polyetheretherketone (PEEK) filaments that are weakly absorbing. The use of a polychromatic source makes it difficult to quantitatively verify the experimental results as is the case for most polychromatic imaging techniques. The concept of effective energy has been used previously (15), however, this is an unreliable approach for broad spectra because a given spectrum will result in different effective energies for samples of different thickness and/or composition. This problem is shared by all polychromatic imaging techniques, such as X-ray computed tomography (24), for example. We have, however, plotted the extracted DP profile for titanium along with the theoretical profile calculated using the effective energy, taking into account the distribution of δ(E) and β(E) for titanium, the estimated source spectrum and a filament of 125 μm nominal radius. This demonstrates agreement between theory and experiment and, in particular, that accurate phase retrieval may be performed with spatially incoherent sources.
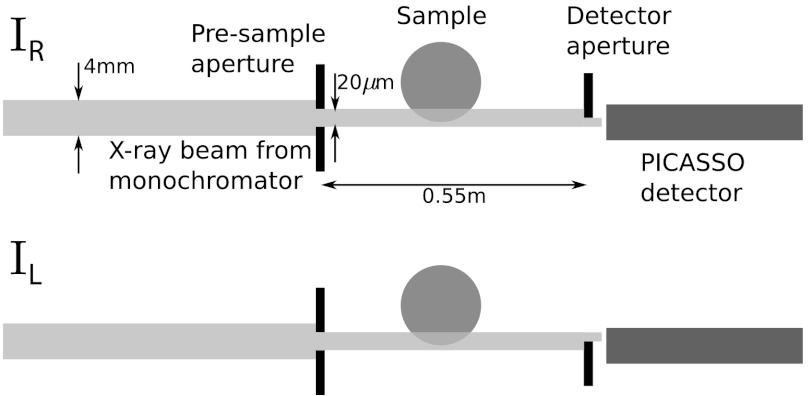
The comparison between extracted and theoretical DP is, however, much clearer when a near-monochromatic source is used. This is why we also made measurements of the same filaments using the SYnchrotron Radiation for MEdical Physics bending magnet beam line of the Elettra synchrotron radiation facility in Trieste, Italy. The beamline is described in more detail elsewhere (25, 26); we give here only the details relevant to the experiment. The sample stage was located, in the experimental room, approximately 20 m from the apparent X-ray source, which has a dimension of 0.280 × 0.080 mm2. This results in a usable beam of dimension approximately 120 × 4 mm2. A channel-cut Si (1,1,1) crystal monochromatizes the beam to nominal photon energy 20 keV with a fractional bandwidth of 0.2%. The DP image is extracted using the point source alternative in Eq. 13 and the experimental setup was quite different to that used in the laboratory as shown in Fig. 5. A single pair of slits was used to shape a beam 20 μm high and 120 mm wide. A single edge was placed in front of the detector to obtain the IL and IR images. A photon counting, linear array silicon microstrip detector known as PICASSO was employed (27). The detector works in the so-called “edge-on” configuration and provides an array of 2,368 pixels 50 μm wide and 300 μm high. An important property of the PICASSO detector is that it exhibits negligible pixel cross-talk between pixels. In this setup the image must be scanned through the beam to acquire an image.
Fig. 5.
Synchrotron experimental setup. The beam extends 120 mm into the page and an image is generated by scanning the object vertically through the beam. The diagram is not to scale.
We present DP images of PEEK and Ti filaments in Fig. 2F as these are the lowest and highest absorbing filaments, respectively, imaged using the laboratory setup. The refractive index of PEEK and Ti were obtained from ref. (28) as δ = 7.15 × 10⁻⁷, β = 2.74 × 10⁻¹⁰, and δ = 21.9 × 10⁻⁷, β = 346 × 10-10, respectively, at photon energy 20 keV. The plots show an excellent agreement between experiment and theory in both cases.
Discussion
It is important to clarify what we mean by an incoherent source. Coherence can be formally defined using the theory of coherence (29), however, this is not necessary for our purposes. For practical purposes, spatial coherence is characterized completely by the focal spot size and temporal coherence by the spectral width of the source. We say that our method is incoherent because the transverse coherence length ( ), where
  is the mean wavelength and FWHM is that of the source focal spot, is of the order of 1 μm at the presample aperture (30). Yet, the presample aperture pitch and opening are at least an order of magnitude greater than this and so spatial coherence impacts negligibly on image formation. The main limitation on focal spot size is that the projected focal spot size should not exceed P. Thus, the focal spot FWHM should satisfy FWHM < Pzso/zod. For the laboratory setup this required FWHM < 80 μm. This is to ensure that the majority of photons not absorbed by the sample are recorded in IL or IR. The limit on source spectral width is set purely by the thickness of the apertures as these need to remain strongly absorbing. CAXPCI still works if the apertures are partially absorbing (21), however, the accuracy of the quantitative phase and absorption information is compromised. Because the technique doesn’t depend upon interference there are no source spectral width limitations, in fact, a broad spectrum eliminates artifacts from the images that could appear due to diffraction by the presample aperture if a monochromatic source were employed. Thus, the quantitative CAXPCI method requires neither spatial nor temporal coherence thus allowing conventional laboratory source without aperturing or filtering to be used. A further strength of the method is its ability to be constructed from commercially available sources and detectors. The apertures, being relatively coarse, are able to be produced to enable imaging over a large field of view. There has, however, been a perception that imaging using coarse gratings to achieve a large field of view comes at the expense of sensitivity and spatial resolution. Fortunately this is not the case as demonstrated in Figs. 2 and 4. Conventionally, the spatial resolution of X-ray imaging systems is determined by the pixel size as is indeed the case with CAXPCI. However, as the detector aperture effectively redefines the pixel size we can achieve higher spatial resolution by dithering or scanning the object by subpixel increments. The final image may be reconstructed without the need for a deconvolution step. The sensitivity of the technique is not compromised either because the edge illumination principle (18) is the key to contrast generation—a subtly different mechanism to that employed in grating interferometry.
Another advantage of using relatively coarse apertures is insensitivity to misalignment of the apertures. We have developed an automated system that allows the apertures to be aligned to within precision of the stages to align the apertures. We have found that the factor which limits the quality of the alignment is in fact defects in the manufacture of the mask.
Conclusion
We have presented a means of performing quantitative DP imaging using commercially available X-ray tube generators and detectors. We believe this is a unique example of where quantitative X-ray phase imaging has been performed with an unapertured and unfiltered incoherent source. Only two raw images are required thus making the technique compatible with applications where acquisition time and radiation dose are critical. The technique thus also paves the way for X-ray phase tomography, compatible with applications outside of specialized laboratories. The pitch of the apertures is sufficiently large to allow an alignment tolerance consistent with use outside the laboratory. Furthermore, the field of view of the system may be increased easily as masks with linear dimensions in the tens of centimeters are already commercially available. This would enable the system to fully utilize the field of view of detectors currently used clinically and industrially. We have also shown that even though we employ a nonmicrofocal, unapertured and unfiltered X-ray tube generator with large-scale apertures, we still achieve high DP sensitivity and spatial resolution. It is thus reasonable to suggest that the quantitative technique could in the future lead to much safer quantitative X-ray phase medical imaging.
Supplementary Material
ACKNOWLEDGMENTS.
A.O. is supported by a Career Acceleration Fellowship (EP/G004250/1) and Challenging Engineering Grant (EP/I021884/1), both awarded by the UK Engineering and Physical Sciences Research Council, by which P.M. was also supported. P.M. is currently supported by a Discovery Early Career Research Award from the Australian Research Council (DE120101331). K.I. is supported by the Wellcome Trust (085856/Z/08/Z). We would like to thank the personnel of the Elettra synchrotron and the University of Trieste working on the SYRMEP beamline for their assistance in obtaining the synchrotron images.
Footnotes
The authors declare no conflict of interest.
*This Direct Submission article had a prearranged editor.
This article contains supporting information online at www.pnas.org/lookup/suppl/doi:10.1073/pnas.1205396109/-/DCSupplemental.
References
- 1.Castelli E, et al. Clinical mammography at the syrmep beam line. Nucl Instrum Methods Phys Res A. 2007;572:237–240. [Google Scholar]
- 2.Morita T, et al. In: A Comparison Between Film-Screen Mammography and Full-Field Digital Mammography Utilizing Phase Contrast Technology in Breast Cancer Screening Programs. Krupinski E, editor. Vol 5116. Berlin: Springer; 2008. pp. 48–54. (Lecture Notes in Computer Science). [Google Scholar]
- 3.Lewis R. Medical phase contrast X-ray imaging: Current status and future prospects. Phys Med Biol. 2004;49:3573–3583. doi: 10.1088/0031-9155/49/16/005. [DOI] [PubMed] [Google Scholar]
- 4.Chapman D, et al. Diffraction enhanced x-ray imaging. Phys Med Biol. 1997;42:2015–2025. doi: 10.1088/0031-9155/42/11/001. [DOI] [PubMed] [Google Scholar]
- 5.Paganin D, Gureyev TE, Pavlov KM, Lewis RA, Kitchen M. Phase retrieval using coherent imaging systems with linear transfer functions. Opt Commun. 2004;234:87–105. [Google Scholar]
- 6.Nesterets YI, Gureyev TE, Paganin D, Pavlov KM, Wilkins SW. Quantitative diffraction-enhanced x-ray imaging of weak objects. J Phys D Appl Phys. 2004;37:1262–1274. [Google Scholar]
- 7.Kitchen MJ, et al. X-ray phase, absorption and scatter retrieval using two or more phase contrast images. Opt Express. 2010;18:19994–20012. doi: 10.1364/OE.18.019994. [DOI] [PubMed] [Google Scholar]
- 8.Vine DJ, et al. Analyzer-based phase contrast imaging and phase retrieval using a rotating anode x-ray source. Appl Phys Lett. 2007;91:254110. [Google Scholar]
- 9.Davis T, Gao D, Gureyev T, Stevenson A, Wilkins S. Phase-contrast imaging of weakly absorbing materials using hard X-rays. Nature. 1995;373:595–598. [Google Scholar]
- 10.Snigirev A, Snigireva I, Kohn V, Kuznetsov S, Schelokov I. On the possibilities of X-ray phase contrast microimaging by coherent high-energy synchrotron radiation. Rev Sci Instrum. 1995;66:5486–5492. [Google Scholar]
- 11.Cloetens P, et al. Holotomography: Quantitative phase tomography with micrometer resolution using hard synchrotron radiation X rays. Appl Phys Lett. 1999;75:2912–2914. [Google Scholar]
- 12.Gureyev T, Raven C, Snigirev A, Snigireva I, Wilkins S. Hard X-ray quantitative non-interferometric phase-contrast microscopy. J Phys D Appl Phys. 1999;32:563–567. [Google Scholar]
- 13.Weitkamp T, et al. X-ray phase imaging with a grating interferometer. Opt Express. 2005;13:6296–6304. doi: 10.1364/opex.13.006296. [DOI] [PubMed] [Google Scholar]
- 14.Momose A, et al. Demonstration of x-ray talbot interferometry. Jpn J Appl Phys. 2003;42:L866–L868. [Google Scholar]
- 15.Pfeiffer F, Weitkamp T, Bunk O, David C. Phase retrieval and differential phase-contrast imaging with low-brilliance X-ray sources. Nat Phys. 2006;2:258–261. [Google Scholar]
- 16.Zhu P, et al. Low-dose, simple, and fast grating-based X-ray phase-contrast imaging. Proc Natl Acad Sci USA. 2010;107:13576–13581. doi: 10.1073/pnas.1003198107. [DOI] [PMC free article] [PubMed] [Google Scholar]
- 17.Gureyev TE, et al. Refracting rontgen’s rays: Propagation-based X-ray phase contrast for biomedical imaging. J Appl Phys. 2009;105:102005. [Google Scholar]
- 18.Olivo A, Speller R. A coded-aperture technique allowing X-ray phase contrast imaging with conventional sources. Appl Phys Lett. 2007;91:074106. [Google Scholar]
- 19.Olivo A, Speller R. Modelling of a novel X-ray phase contrast imaging technique based on coded apertures. Phys Med Biol. 2007;52:6555–6573. doi: 10.1088/0031-9155/52/22/001. [DOI] [PubMed] [Google Scholar]
- 20.Olivo A, Ignatyev K, Munro PRT, Speller RD. Noninterferometric phase-contrast images obtained with incoherent X-ray sources. Appl Opt. 2011;50:1765–1769. doi: 10.1364/AO.50.001765. [DOI] [PubMed] [Google Scholar]
- 21.Ignatyev K, Munro PRT, Chana D, Speller RD, Olivo A. Coded apertures allow high-energy X-ray phase contrast imaging with laboratory sources. J Appl Phys. 2011;110:014906. [Google Scholar]
- 22.Munro P, Ignatyev K, Speller R, Olivo A. The relationship between wave and geometrical optics models of coded aperture type X-ray phase contrast imaging systems. Opt Express. 2010;18:4103–4117. doi: 10.1364/OE.18.004103. [DOI] [PMC free article] [PubMed] [Google Scholar]
- 23.Ignatyev K, Munro P, Speller R, Olivo A. Effects of signal diffusion on X-ray phase contrast images. Rev Sci Instrum. 2011;82:073702. doi: 10.1063/1.3606442. [DOI] [PubMed] [Google Scholar]
- 24.Herman G. Image Reconstruction from Projections: The Fundamentals of Computerized Tomography. San Francisco: Academic Press; 1980. [Google Scholar]
- 25.Arfelli F, et al. Digital mammography with synchrotron radiation. Rev Sci Instrum. 1995;66:1325–1328. [Google Scholar]
- 26.Olivo A, et al. An innovative digital imaging set-up allowing a low-dose approach to phase contrast applications in the medical field. Med Phys. 2001;28:1610–1619. doi: 10.1118/1.1388219. [DOI] [PubMed] [Google Scholar]
- 27.Rigon L, et al. A single-photon counting silicon detector for synchrotron radiation mammography. Nucl Instrum Methods Phys Res A. 2009;608:S62–S65. [Google Scholar]
- 28.Henke BL, et al. X-ray interactions: Photoabsorption, scattering, transmission, and reflection at E = 50–30,000 eV, Z = 1–92. Atom Data Nucl Data. 1993;54:181–342. [Google Scholar]
- 29.Wolf E. Introduction to the Theory of Coherence and Polarization of Light. New York: Cambridge University Press; 2007. [Google Scholar]
- 30.Mandel L, Wolf E. Optical Coherence and Quantum Optics. Cambridge, UK: Cambridge University Press; 1995. [Google Scholar]
Associated Data
This section collects any data citations, data availability statements, or supplementary materials included in this article.


