Abstract
Objective
ShcKO mice have low body fat and resist weight gain on a high fat diet, indicating that Shc proteins may influence enzymes involved in β-oxidation. To investigate this idea, the activities of β-oxidation and ketone body metabolism enzymes were measured.
Methods
The activities of β-oxidation enzymes (acyl-CoA dehydrogenase, 3-hydroxyacyl-CoA dehydrogenase and ketoacyl-CoA thiolase) in liver and hindlimb skeletal muscle, ketolytic enzymes (acetoacetyl-CoA thiolase, β-hydroxybutyrate dehydrogenase and 3-oxoacid-CoA transferase) in skeletal muscle, and ketogenic enzymes (acetoacetyl-CoA thiolase and β-hydroxybutyrate dehydrogenase) in liver were measured from wild-type and ShcKO mice.
Results
The activities of β-oxidation enzymes were increased (P < 0.05) in the ShcKO compared to wild-type mice in the fasted but not the fed state. In contrast, no uniform increases in the ketolytic enzyme activities were observed between ShcKO and wild-type mice. In liver, the activities of ketogenic enzymes were increased (P < 0.05) in ShcKO compared to wild-type mice in both the fed and fasted states. Levels of phosphorylated hormone sensitive lipase from adipocytes were also increased (P < 0.05) in fasted ShcKO mice.
Conclusions
These studies indicate that the low Shc levels in ShcKO mice result in increased liver and muscle β-oxidation enzyme activities in response to fasting and induce chronic increases in the activity of liver ketogenic enzymes. Decreases in the level of Shc proteins should be considered as possible contributors to the increase in activity of fatty acid oxidation enzymes in response to physiological conditions which increase reliance on fatty acids as a source of energy.
Keywords: Fasting, fatty acid oxidation, liver, skeletal muscle, fed to starved transition
1. Introduction
Shc proteins have been proposed to play a role in the aging process [1,2]. Shc are adaptor proteins which bind to phosphorylated tyrosines on growth factor receptors. Three Shc isoforms of 46, 52 and 66 kD have been identified, and these isoforms are generated from the same Shc RNA by splicing or alterna tive translation initiation [3,4]. Shc proteins undergo tyrosine phosphorylation following interaction with activated epidermal growth factor receptor [4–6], platelet-derived growth factor receptor [7,8], insulin receptor [5,6], estrogen receptors [9] and other cell surface receptors [10]. Shc was initially shown to play a role in mitogenesis [4], but the diverse functions of the receptors which interact with these proteins indicates that Shc participates in a wide range of cellular processes, including energy metabolism.
One area of particular interest is the influence of Shc proteins on lipid metabolism. Studies using p66Shc−/− mice have provided some evidence that Shc proteins may influence fatty acid oxidation. Although p66Shc−/− mice have been used as a model of p66Shc specific knockout, we have shown in the present study and our previous work [11] that the levels of both the p52Shc and p46Shc isoforms are also decreased in liver and skeletal muscle from the these animals. Thus, the se mice (referred to as ShcKO in this manuscript) provide a good model of overall decreases in liver and skeletal muscle Shc protein levels. It has been shown that fat mass is decreased in ShcKO mice despite the fact that food intake is not different from wild-type animals [12]. ShcKO mice are also resistant to weight gain and fat accumulation when consuming a high fat (60% of calories from fat) diet [12]. Similarly, double mutant mice that lack both leptin and p66Shc (Ob/Ob ShcKO mice) have lower peak body weights and fat pad weights when compared to Ob/Ob mice which only lack leptin [13]. These lower fat pad weights occurred despite the fact tha t food intake did not differ between the Ob/Ob mice with or without ShcKO [13]. The results of these studies suggest that increased capacity for fatty acid oxidation could contribute to the leaner phenotype of ShcKO mice. The purpose of the present study was to evaluate whether Shc proteins have a role in regula ting the activity of fatty acid oxidation enzymes. To this end, we measured the activities of enzymes involved in β-oxidation and ketolysis in liver and skeletal muscle and ketogenesis in liver from ShcKO and wild-type mice under fed and fasted states.
2. Materials and methods
2.1 Materials
Laboratory chemicals and substrates were purchased from Sigma-Aldrich (St. Louis, MO), except bovine serum albumin (MP Biochemicals, Santa Ana, CA), sucrose and mannitol (Fisher Scientific, Pittsburgh, PA), BioRad protein assay kits (BioRad Corp., Hercules, CA), acetyl-CoA (EMD Biosciences, San Diego, CA), NAD and NADH (Roche Diagnostics, Indianapolis, IN). NuPAGE® pre-cast Novex 4–12% Bis-Tris gels, MES-SDS running buffer, sample antioxidant, LDS sample buffer, as well as XCell4 Midi-Cell system, iBlot® dry blotting transfer system and nitrocellulose membranes were all from Invitrogen (Carlsbad, CA). GelCode Blue Stain (Colloidal Coomassie Dye G-250) was from Thermo Scientific (Rockford, IL).
2.2 Animals
ShcKO mice (C57Bl/6) were provided by Dr. Pier Giuseppe Pelicci (Department of Experimental Oncology, European Institute of Oncology, Milan, Italy) and used to establish a breeding colony at UC Davis. Animal care and use protocols were approved by the UC Davis Institutional Animal Care and Use Committee and were in accordance with the guidelines of the Institute of Laboratory Animal Resources. Heterozygous ShcKO mice were mated to produce founders for the wild-type and ShcKO lines used in the present study. Male mice were used for all experiments. Animals were housed in a temperature (22–24 °C) and humidity (40–60%) controlled animal facility with a 12 hour light:dark cycle and allowed free access to LM485 diet (Teklad, Madison, WI) and water. At 3 months of age, the mice were randomly divided into two groups: fasted or fed. For 1 week prior to sacrifice, food was removed from the cages of both groups overnight and the mice were only given access to food during the light cycle. At the end of this week, food intake during light cycle feeding (3.80 ± 0.57 g/d ShcKO and 3.90 ± 0.35 g/d wild-type) was not different (P > 0.10) from 24 hour ad libitum intake (3.23 ± 0.33 g/d ShcKO and 3.83 ± 0.35 g/d) for either group of mice. Also, there was no difference (P > 0.10) in food intake between the wild-type and ShcKO mice at any time during the study. The fasted group was deprived of food for 16 hours (overnight) prior to sacrifice while the fed group were deprived of food for 16 hours (overnight) and then allowed access to food for three hours, at their normal feeding time, prior to sacrifice. Food intake during this three hour feeding period was not different (P > 0.10) between the wild-type (1.87 ± 0.22 g) and ShcKO (1.93 ± 0.29 g) mice, and represented approximately 50% of daily food intake.
2.2 Tissue Sampling and Preparation
Mice were sacrificed by cervical dislocation. Liver and hindlimb skeletal muscle were rapidly removed, weighed, frozen and powdered in a mortar and pestle maintained under liquid nitrogen. All tissue powders were stored under liquid nitrogen until use. Brain, heart, lungs, kidneys, spleen and fat pads (epididymal, perirenal, intrascapular, subcutaneous, mesenteric) were also removed and weighed.
2.3 β-oxidation enzymes
All enzyme activities were measured in skeletal muscle and liver, using a Perkin Elmer Lamda 25 UV/Vis spectrophotometer equipped with a Peltier heating control system and 9 cell changer (Perkin Elmer, Shelton, CT). Acyl-CoA dehydrogenase [EC 1.3.99.13] activity was determined at 600 nm (e = 21 mM−1cm−1), using palmitoyl-CoA as substrate [14]; 3-hydroxyacyl-CoA dehydrogenase [EC 1.1.1.35] activity was determined at 340 nm (e = 6.22 mM−1cm−1) using acetoacetyl-CoA as substrate [15]; ketoacyl-CoA thiolase [EC 2.3.1.16] activity was determined at 303 nm (e =16.9 mM−1cm−1) using acetoacetyl-CoA as substrate [16]. All enzyme activities are presented as mean ± SEM (n = 6), and expressed as µmol/min/mg protein.
2.4 Citrate synthase and lactate dehydrogenase activity
The activities of citrate synthase [EC 2.3.3.1] and lactate dehydrogenase [EC 1.1.1.27] were measured in skeletal muscle. Citrate synthase activity [17] was determined at 412 nm (e = 13.6 mM−1cm−1), while lactate dehydrogenase activity [18] was determined at 340 nm (e = 6.22 mM−1cm−1), using oxaloacetate and pyruvate as substrates, respectively. All enzyme activities are presented as mean ± SEM (n = 6) and expressed as µmol/min/mg protein.
2.5 Enzymes of ketone body metabolism
Enzyme activities were measured in skeletal muscle (ketolysis) and liver (ketogenesis). Acetoacetyl-CoA thiolase [EC 2.3.1.9] activity was measured at 303 nm (e = 21.4 mM−1cm−1) using acetoacetyl-CoA as substrate [19], and β-hydroxybutyrate dehydrogenase [EC 1.1.1.30] activity was determined at 340 nm (e = 6.22 mM−1cm−1), using acetoacetate as substrate [20]. Additionally, in skeletal muscle, 3-oxoacid CoA-transferase [EC 2.8.3.5] activity was measured at 313 nm (e = 12 mM−1cm−1), using succinyl-CoA as substrate [21]. All enzyme activities are presented as mean ± SEM (n = 6) and expressed as µmol/min/mg protein.
2.6 Antibodies
Antibodies for the study were purchased from the following companies: Cell Signaling Technologies, Danvers, MA (Rabbit anti-VDAC, anti-MnSOD, anti-total HSL, and anti-phosphoserine 563 HSL); Novus Biologicals, Littleton, CO (mouse anti-VLCAD); Sigma, St Louis, MO (mouse anti-tubulin, anti-beta actin and anti ACAA2); BD Biosciences, San Diego, CA (rabbit anti-Shc and mouse anti Cyt -C); Mito Sciences, Eugene, OR (mouse anti-MCAD and mouse anti-ACAA1); Everest Biotech, San Diego, CA (goat anti-ETF); and LI-COR Biosciences, Lincoln, NE (LI-COR Odyssey blocking buffer, secondary IRDye 680 goat anti-mouse and IRDye 800CW goat anti-rabbit antibodies and LI-COR infrared imaging system).
2.7 Gel electrophoresis and western blotting
Total protein was isolated using ice-cold Cell Lysis buffer (Cell Signaling Technologies, Danvers, MA), and additionally supplemented with Complete Mini Protease Inhibitor Cocktail and PhosStop Phosphatase Inhibitor Cocktail (Roche, Indianapolis, IN). Briefly, tissues were homogenized with 6 volumes (w/v) of the lysis buffer at 4°C and centrifuged at 500g for 15 min at 4°C. Supernatants were kept and protein concentrations determined and then diluted to 5µg/µl with lysis buffer. Aliquots of samples were then treated with 4X lithium dodecyl sulfate sample buffer (Invitrogen, Carlsbad, CA) supplemented with 100mM DTT, followed by heating at 90°C for 10 min. Samples (40 µg) were resolved by 4–12% SDS-PAGE, using MES-SDS running buffer, initially at 100V and then at 150V when proteins entered the gel, followed by 200V until the proteins were resolved. Resolved proteins were transferred to nitrocellulose membrane, using iBlot® dry blotting transfer system, following manufacturer’s instruction. Membranes were blocked with Odyssey Blocking Buffer (LI-COR Biosciences) and probed with anti-VDAC (1/1000), anti-MnSOD (1/1000), anti-ACAA1 (1/500), anti-ACAA2 (1/200), anti-Shc (1/2000), anti Cyt c (1/1000), anti-MCAD (1/10,000), anti-ETF (1/2000), anti-phosphoserine 563 HSL (1/500), anti-total HSL (1/500), anti-tubulin (1/5000) and anti-β-actin (1/5000) primary antibodies, at the indicated dilutions in LI-COR blocking buffer, for 2hr. Membranes were then probed with secondary antibodies, IRDye 680 goat anti-mouse (1/20,000) and IRDye 800CW goat anti-rabbit (1/20,000) antibodies, in LI-COR blocking buffer for 1hr. Blots were scanned on LI-COR Odyssey infrared imaging system and quantified using Odyssey 2.1 software. Use of different IRDye-labeled secondary antibodies allowed the measurement of the level of housekeeping proteins at the same time as the proteins of interest on the same membrane, therefore, improving the accuracy of quantification and normalization.
2.8 Q-PCR of Nuclear and Mitochondrial DNA
Total DNA was extracted from tissues with Qiagen DNeasy kit (Qiagen, Valencia, CA), and 10 ng was used in 25 µl Syber Green based Q-PCR on LightCycler 480 (Roche Applied Science, Indianapolis, IN). For the single copy nuclear gene (CFTR), the primers were: Cftr - Forward: CTGTGACACGTGTGCTTTCAG; Cftr - Reverse: ATGCAGCCTTTGGTGAAACAG. For the mitochondrial DNA, the primers were: mito - 8.9: CATGATCTAGGAGGCTGCTGACCTC; mito - 9.1: CGTTTACCTTCTATAAGGCTATGA. The cycling parameters were: initial denaturation at 94°C for three minutes followed by 40 cycles of denaturation at 94°C for 15 seconds, annealing at 66°C for 20 seconds and extension at 72°C for 20 seconds. Melting curves were accessed by gradual heating the reactions until 95°C at the end of the amplification. The purity of reactions was verified by ge l-electrophoresis. Calculations used the standard curve method taking into account the efficiencies of the PCR reactions, calculated by log-linear regression using LightCycler 480 analysis software (Roche Applied Science, Indianapolis, IN).
2.9 Mitochondrial Isolation
Mice were sacrificed by cervical dislocation and the livers were removed rapidly, weighed, and placed into ice-cold isolation medium (220 mmol/L mannitol, 70 mmol/L sucrose, 1 mmol/L EDTA, 20 mmol/L Tris, 0.1% fatty acid-free BSA, pH 7.4). All steps were carried out at 4°C. EDTA was used in the isolation medium to chelate both magnesium and calcium. The livers were finely chopped, rinsed free of blood in the isolation medium, and mitochondria isolated as previously described [22] with slight modifications [23]. Briefly, liver was homogenized, using ice-cold glass-Teflon homogenizer, and centrifuged at 500g for 10 min. The resulting supernatant was re-centrifuged at 10,000g for 10 min and the supernatant discarded. The pellet was re-suspended gently and sequentially washed in isolation medium without BSA and centrifuged at 10,000g. The final pellet was suspended in isolation medium without BSA and stored on ice.
2.10 Mitochondrial Respiration
Mitochondrial respiration was measured with the extracellular flux analyzer Seahorse XF-24 in 24-well micro-plate format (Seahorse Bioscience, North Billierica, MA), as previously described [24]. Freshly isolated liver mitochondria from control and ShcKO were diluted and 50 µL (containing 10 µg mitochondrial protein) plated per well, centrifuged at 2200g (Beckman CS-6 centrifuge) for 20 min at 4°C and 450 µL of MAS-3 Seahorse assay medium (115 mmol/L KCl, 10 mmol/L KH2PO4, 2 mmol/L MgCl2, 3 mmol/L HEPES, 1 mmol/L EGTA, 0.2% fatty acid free BSA) was added, supplemented with 20 µmol/L palmitoyl-L-carnitine, and either 10 mmol/L malonate to measure flux through β-oxidation alone or 2 mmol/L malate to measure rates of flux through β-oxidation and the TCA cycle [25]. EGTA was used in the assay medium to provide a chelator for calcium and EDTA was not used since the medium contained magnesium. The plate was pre-warmed for 10 min at 37°C. Oxygen consumption rates (OCR) were measured starting from basal respiration on substrate followed by addition of 2 mmol/L ADP, 1 µmol/L oligomycin, 50 µmol/L FCCP, and 4 µmol/L antimycin A plus 2 µmol/L rotenone. Mixing and measurement cycle times were as followed: basal respiration in 2 cycles (50 sec mixing and 2 min measurement, per cycle), one cycle with ADP (50 sec mixing and 8 min measurement), one cycle with oligomycin (50 sec mixing and 4 min measurement), one cycle with FCCP (50 sec mixing and 4 min measurement), one cycle with antimycin A plus rotenone (50 sec mixing and 4 min measurement). All values were calculated using the Seahorse XF-24 software and expressed as mean ± SEM (n = 6). Basal (average), ADP (average of top 20%), oligomycin (average), FCCP (average of top 20%) and antimycin/rotenone (average) oxygen consumption rates were compared between ShcKO and wild-type groups. The integrity of mitochondria was assessed for each preparation as state 3/state 4 respiration (RCR) and FCCP/state 4 respiration (RCRu). RCR values were not significantly different between the groups of mice for mitochondria respiring on 10 mM succinate plus 2 µM rotenone (3.67±0.48 for wild-type and 3.53±0.57 for ShcKO), 20 µmol/L palmitoyl-L-carnitine plus 10 mmol/L malonate (2.73±1.13 for wild-type and 3.09±0.94 for ShcKO) or 20 µmol/L palmitoyl-L-carnitine plus 2 mmol/L malate (1.66±0.22 for wild-type and 1.63±0.12 for ShcKO). Similarly, RCRu values were not significantly different between the groups of mice for mitochondria respiring on 10 mM succinate plus 2 µM rotenone (3.82±0.42 for wild-type and 3.26±0.47 for ShcKO), 20 µmol/L palmitoyl-L-carnitine plus 10 mmol/L malonate (3.24±1.32 for wild-type and 3.38±0.96 for ShcKO) or 20 µmol/L palmitoyl-L-carnitine plus 2 mmol/L malate (3.67±0.65 for wild-type and 3.30±0.38 for ShcKO). All RCR values were calculated as ratio of peak ADP (top 20%) to mean oligomycin OCRs, and expressed as mean ± SEM (n = 6).
2.11 Protein assays
Protein was determined using the BioRad protein assay kit (BioRad Laboratories, Hercules, CA) with BSA as the standard.
2.12 Statistical Analysis
Statistical analysis was performed using a two-way ANOVA. Where the overall ANOVA was significant, we identified genotypes and calorie regimes that differed significantly using Tukey’s multiple comparison procedure and maintained the family-wise error rate at 0.05. In addition, we compared enzyme activity between genotypes and between calorie regimes with a t-test or Wilcoxon test for variables that were not normally distributed as determined by a Shapiro-Wilk test. Similarly, we compared mean fat mass in organs and fat pads between genotypes with a t-test or Wilcoxon test. Mitochondrial respiration was compared between groups using a two-factor ANOVA with repeated measures on one factor and post-hoc t-test [24]. A threshold of 0.05 was used to identify significant differences. All analyses were conducted in R Version 2.11.1 (R Development Core Team 2010).
3. Results
3.1 Body composition
Organ and fat pad weights in fasted wild-type and ShcKO mice are summarized in Table 1. There was no significant difference in body weights between ShcKO and wild-type mice. However, there were decreases (P < 0.05) in the weights of the subcutaneous, epididymal and perirenal fat pads in the ShcKO compared to wild-type animals, and a trend (P = 0.10) toward a decrease in mesenteric fat pad weight in ShcKO mice. Also, liver (P < 0.03) and lung (P = 0.06) weights were lower in the ShcKO mice. In contrast to these results, there were increases in skeletal muscle (P = 0.06) and spleen (P < 0.01) weights in the ShcKO animals. There were no significant differences in heart, kidneys, brain or intrascapular fat pad weights between the groups of mice.
Table 1.
Body, organ and fat pad weights of wild-type and ShcKO mice under fasting condition.
| Body/Organ/Tissue | Wild-Type | ShcKO | P value |
|---|---|---|---|
| Body weight | 22.01 ± 0.23 | 21.71 ± 0.35 | 0.47 |
| Liver | 1.01 ± 0.02 | 0.94 ± 0.03 | 0.03 |
| Skeletal Muscle | 1.21 ± 0.03 | 1.30 ± 0.03 | 0.06 |
| Heart | 0.11 ± 0.002 | 0.11 ± 0.003 | 0.44 |
| Kidneys | 0.29 ± 0.01 | 0.29 ± 0.01 | 0.76 |
| Lungs | 0.17 ± 0.002 | 0.13 ± 0.003 | 0.06 |
| Spleen | 0.05 ± 0.002 | 0.06 ± 0.004 | 0.01 |
| Brain | 0.41 ± 0.003 | 0.41 ± 0.004 | 0.79 |
| Subcutaneous Fat | 0.45 ± 0.03 | 0.33 ± 0.04 | 0.01 |
| Epididymal Fat | 0.46 ± 0.02 | 0.33 ± 0.02 | 0.01 |
| Perirenal Fat | 0.10 ± 0.01 | 0.07 ± 0.01 | 0.02 |
| Mesenteric Fat | 0.27 ± 0.01 | 0.23 ± 0.02 | 0.10 |
| Interscapular Fat | 0.08 ± 0.01 | 0.08 ± 0.01 | 0.74 |
Data are mean ± SEM; n = 6 per group; all weights in g.
3.2 β-oxidation enzymes
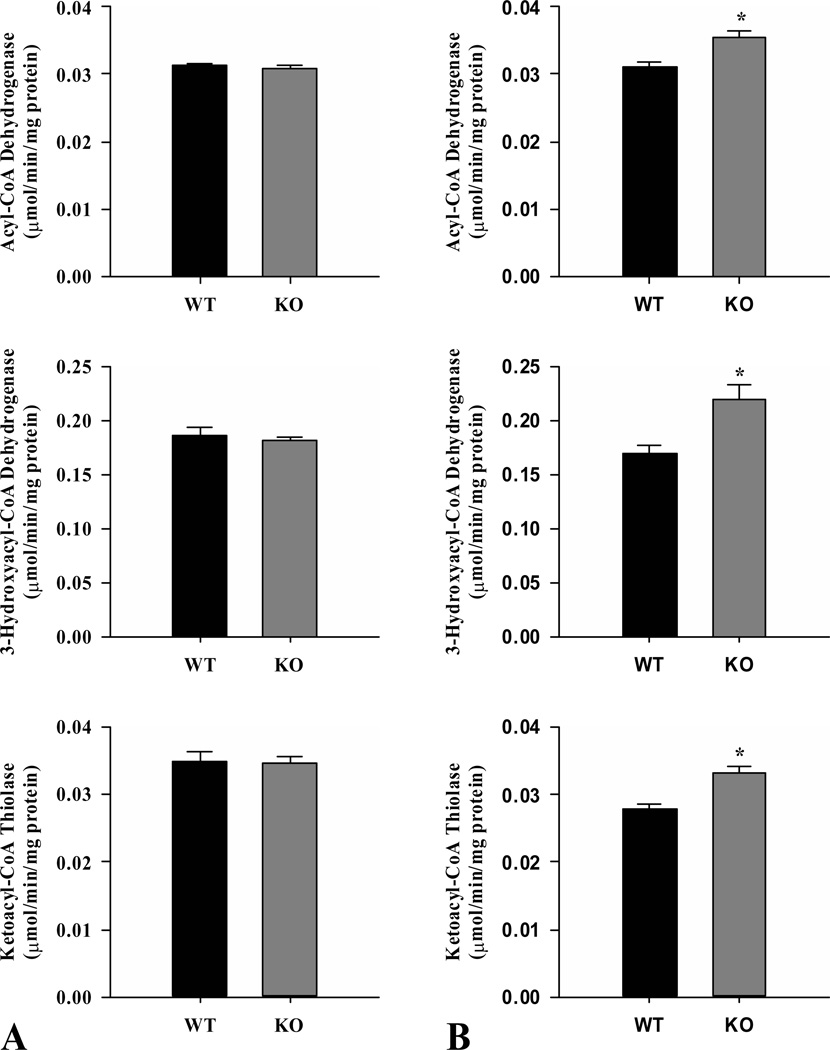
The activities of acyl-CoA dehydrogenase, 3-hydroxyacyl-CoA dehydrogenase and ketoacyl-CoA thiolase from skeletal muscle did not differ between wild-type and ShcKO in the fed state (Fig. 1A). However, all three enzymes were increased (P < 0.05) in skeletal muscle from fasted ShcKO compared to wild-type mice (Fig. 1B). In ShcKO, the activities of acyl-CoA dehydrogenase and 3-hydroxyacyl-CoA dehydrogenase were increased (P < 0.05) in the fasted compared to fed state, while no significant differences were observed in ketoacyl-CoA thiolase activity. In wild-type mice, there were no differences in the activities of acyl-CoA dehydrogenase and 3-hydroxyacyl-CoA dehydrogenase between fed and fasted states, while ketoacyl-CoA thiolase activity decreased (P < 0.05) in the fasted wild-type.
Figure 1.
Activities of the β-oxidation enzymes acyl-CoA dehydrogenase, 3-hydroxyacyl-CoA dehydrogenase and ketoacyl-CoA thiolase from hindlimb skeletal muscle of ShcKO (KO) and wild-type (WT) mice. Activities were measured under fed (A) and fasted (B) conditions. Data are mean ± SEM; n = 6 per group. * P < 0.05 between KO and WT mice.
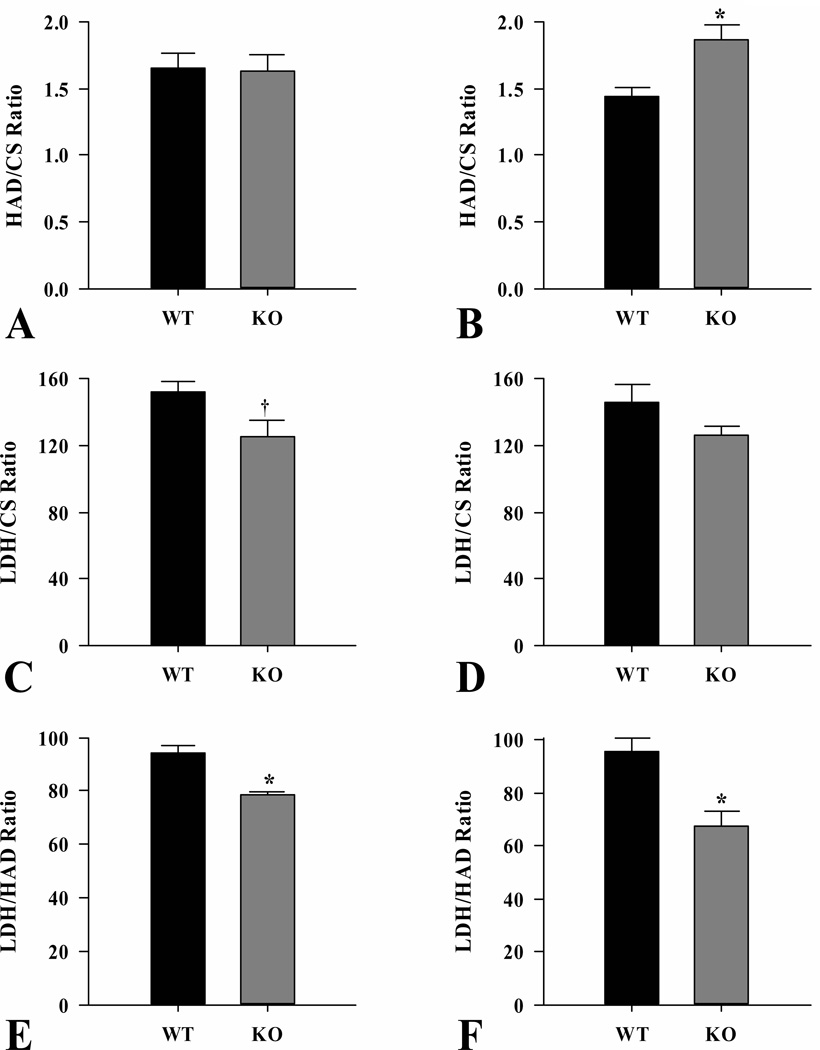
The activity ratios of representative enzymes from β-oxidation (3-hydroxyacyl-CoA dehydrogenase), anaerobic glycolysis (lactate dehydrogenase) and the citric acid cycle (citrate synthase) in skeletal muscle samples were compared (Fig. 2). The 3-Hydroxyacyl-CoA dehydrogenase/citrate synthase ratio was not different between wild-type and ShcKO mice in the fed state (Fig. 2A) while it was higher (P < 0.05) in the fasted ShcKO compared to wild-type mice (Fig. 2B). For lactate dehydrogenase/citrate synthase ratio, there was a trend (P = 0.06) in fed animals (Fig. 2A) towards a decrease in ShcKO compared to wild-type mice, while no differences between the two groups of mice were observed in the fasted state (Fig. 2B). In contrast, lactate dehydrogenase/3-hydroxyacyl-CoA dehydrogenase ratio was decreased (P < 0.05) in ShcKO compared to wild-type mice under both fed and fasting conditions (Fig. 2A and 2B, respectively).
Figure 2.
Enzyme activity ratios from hindlimb skeletal muscle of ShcKO (KO) and wild-type (WT) mice. The activities of citrate synthase (CS), hydroxyacyl-CoA dehydrogenase (HAD) and lactate dehydrogenase (LDH) were measured and the ratios HAD/CS, LDH/CS and LDH/HAD were calculated, under fed (A) and fasted (B) conditions. Data are mean ± SEM; n = 6 per group. * P < 0.05 between KO and WT mice. † P = 0.06 between KO and WT mice.
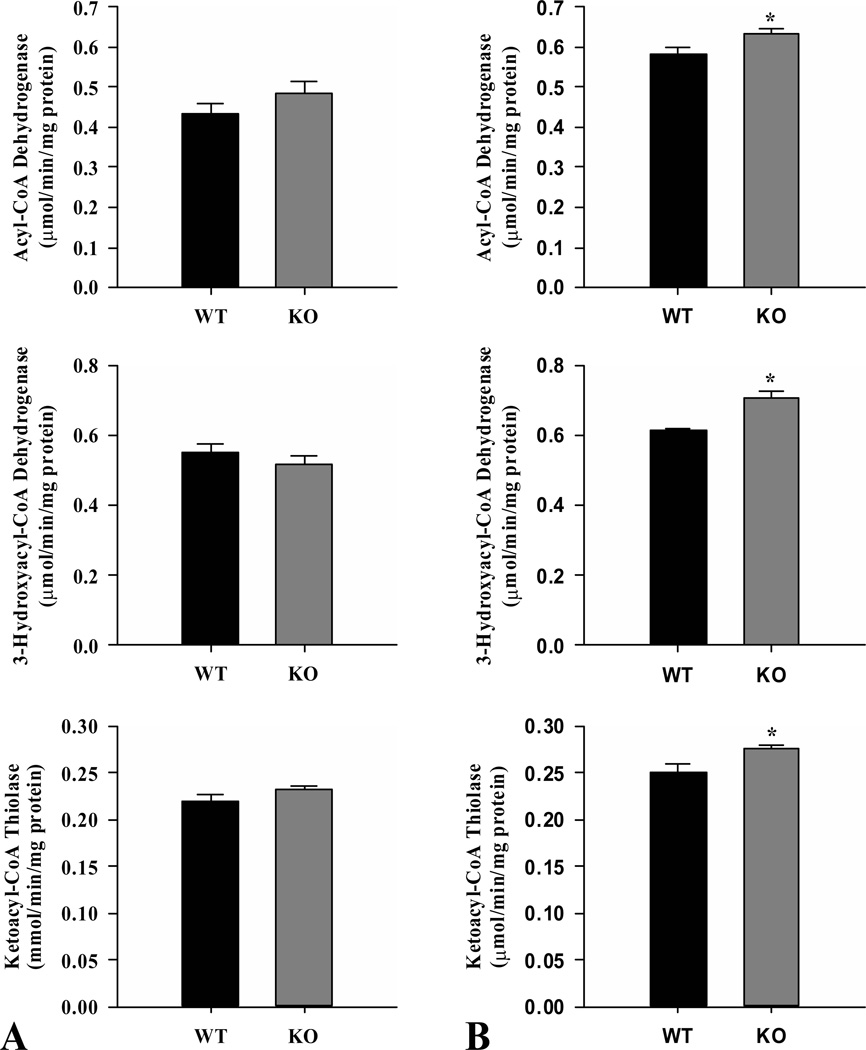
In liver, the activities of acyl-CoA dehydrogenase, 3-hydroxyacyl-CoA dehydrogenase and ketoacyl-CoA thiolase were not different between ShcKO and wild-type fed mice (Fig.3A). However, the activities of all three enzymes were increased (P < 0.05) in fasted ShcKO compared to wild-type mice (Fig. 3B). Both groups of mice showed increased activities (P < 0.05) in all three enzymes in the fasted compared to fed state. The activity ratios of 3-hydroxyacyl-CoA dehydrogenase/citrate synthase were also compared and, similar to the skeletal muscle, no differences were observed between ShcKO and wild-type mice in the fed state (Supplementary Fig. S1A). However, this ratio increased (P < 0.05) in fasted ShcKO versus wild-type mice (Supplementary Fig. S1B).
Figure 3.
Activities of the β-oxidation enzymes acyl-CoA dehydrogenase, 3-hydroxyacyl-CoA dehydrogenase and ketoacyl-CoA thiolase from livers of ShcKO (KO) and wild-type (WT) mice. Activities were measured under fed (A) and fasted (B) conditions. Data are mean ± SEM; n = 6 per group. * P < 0.05 between KO and WT mice.
3.3 Enzymes of ketone body metabolism
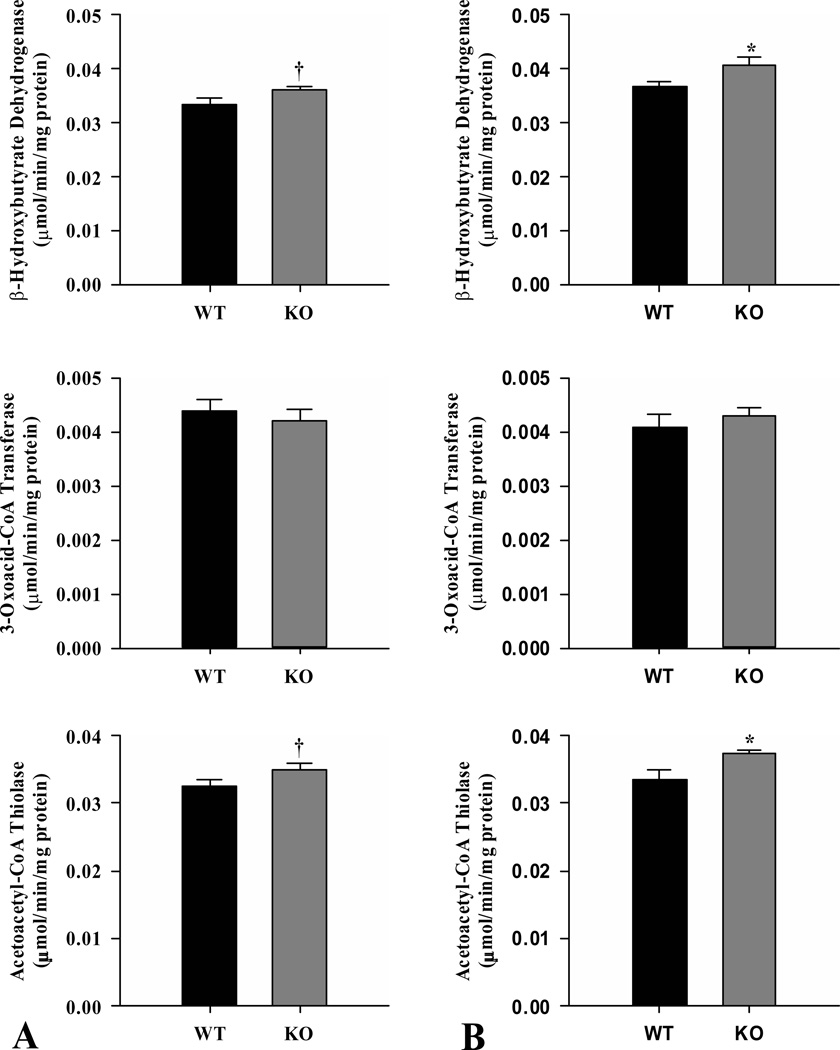
As indicators of capacity for ketone body oxidation, the activities of β-hydroxybutyrate dehydrogenase, 3-oxoacid-CoA transferase and acetoacetyl-CoA thiolase were measured in skeletal muscle from ShcKO and wild-type mice. In the fed state (Fig. 4A), there was a trend towards an increase (P = 0.07) in both β-hydroxybutyrate dehydrogenase and acetoacetyl-CoA thiolase activities in ShcKO compared to wild-type mice, while 3-oxoacid-CoA transferase activity was unchanged. In the fasted state (Fig. 4B), there was an increase (P < 0.05) in β-hydroxybutyrate dehydrogenase and acetoacetyl-CoA thiolase activities in ShcKO compared to wild-type mice, while 3-oxoacid-CoA transferase activity was unchanged. In the ShcKO mice, the activities of β-hydroxybutyrate dehydrogenase and acetoacetyl-CoA thiolase increased (P < 0.05) in the fasted compared to fed state, while 3-oxoacid-CoA transferase activity remained unchanged. In the wild-type mice, only the activity of β-hydroxybutyrate dehydrogenase showed a trend (P = 0.07) towards an increase in the fasted compared to fed state.
Figure 4.
Activities of the ketone body oxidation enzymes β–hydroxybutyrate dehydrogenase, 3-oxoacid-CoA transferase and acetoacetyl-CoA thiolase from hindlimb skeletal muscle of ShcKO (KO) and wild-type (WT) mice. Activities were measured under fed (A) and fasted (B) conditions. Data are mean ± SEM; n = 6 per group. * P < 0.05 between KO and WT mice. † P = 0.07 between KO and WT mice.
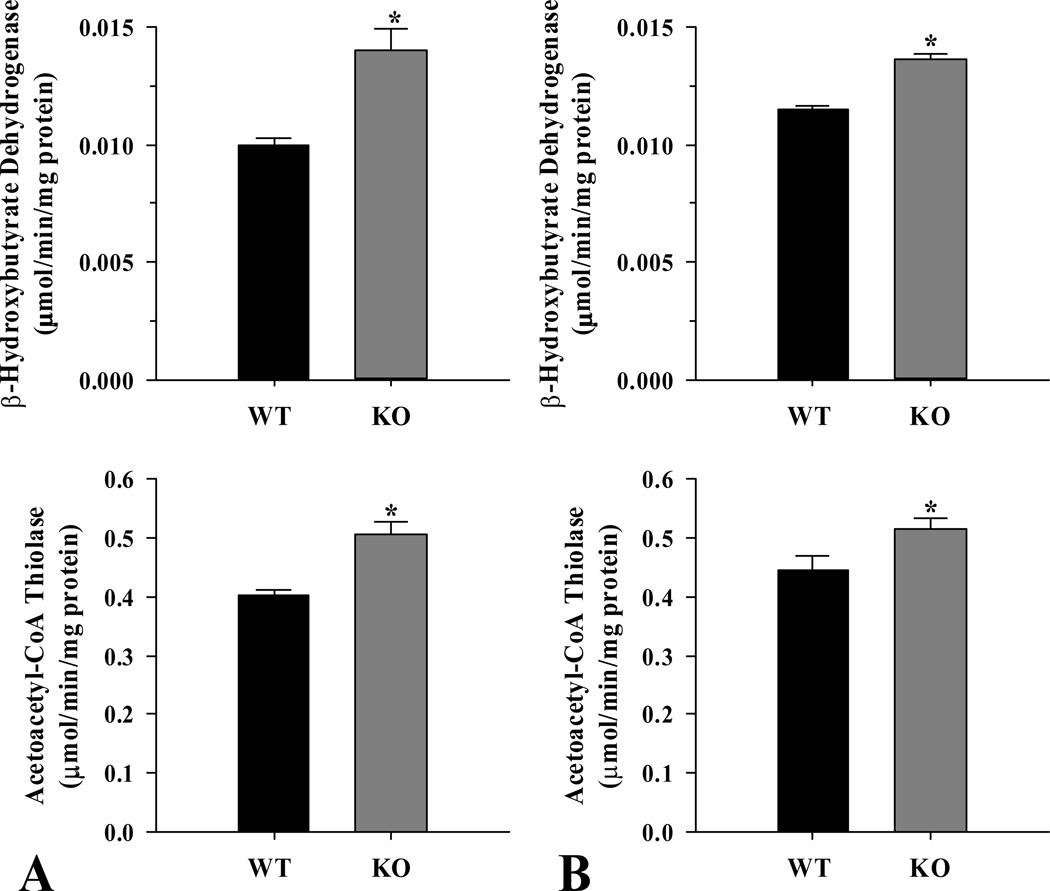
As indicators of capacity for ketone body synthesis, the activities of β-hydroxybutyrate dehydrogenase and acetoacetyl-CoA thiolase were measured in liver from ShcKO and wild-type mice (Fig. 5). Both enzymes showed higher (P < 0.05) activities in ShcKO compared to wild-type mice in both the fed (Fig. 5A) and fasted (Fig. 5B) states. In wild-type mice, both activities enzymes were increased (P < 0.05) in the fasted compared to fed state. In contrast, no enzyme activity differences were observed between the fed and fasted state in ShcKO mice.
Figure 5.
Activities of the ketone body synthesis enzymes β–hydroxybutyrate dehydrogenase, and acetoacetyl-CoA thiolase from livers of ShcKO (KO) and wild-type (WT) mice. Activities were measured under fed (A) and fasted (B) conditions. Data are mean ± SEM; n = 6 per group. * P < 0.05 between KO and WT mice.
3.4 Phosphorylated hormone sensitive lipase
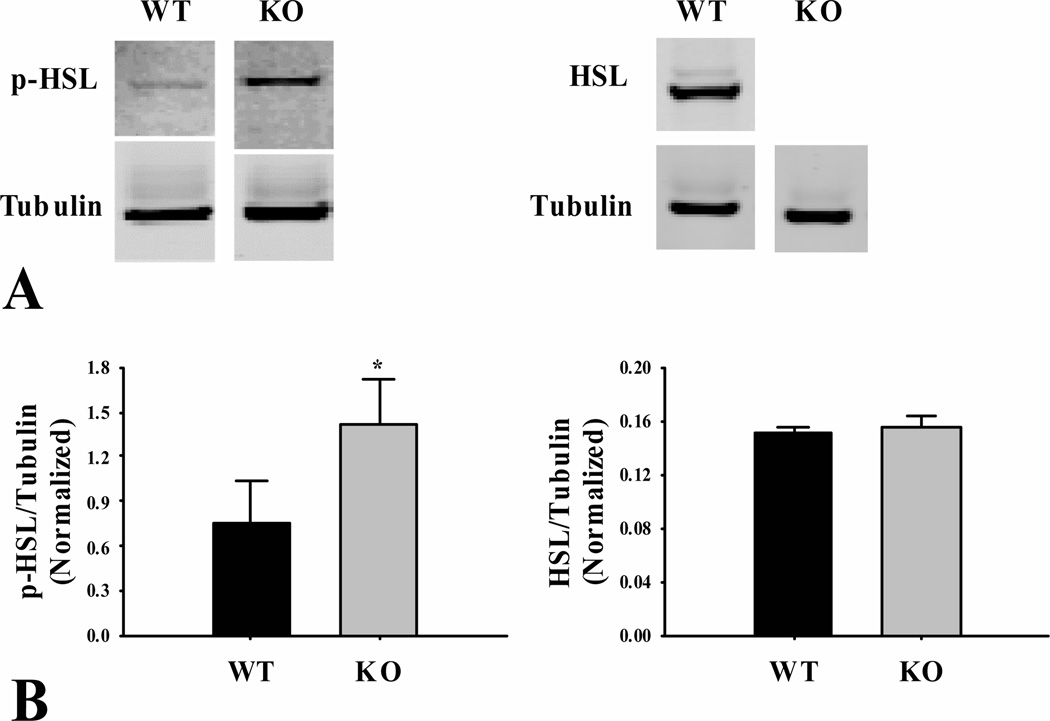
Phosphorylated hormone sensitive lipase (p-HSL) levels were measured in adipose tissue from fasted mice to provide an indication of lipolytic activity (Fig. 6). The levels of p-HSL protein were increased 92% (P < 0.05) in adipose tissue from the ShcKO compared to wild-type mice. The levels of total HSL were not different (P > 0.10) between the ShcKO and wild-type mice (Fig. 6).
Figure 6.
Protein levels of phosphorylated (p-HSL) and total hormone sensitive lipase (HSL) in epididymal fat from fasted ShcKO (KO) and wild-type (WT) mice. Western blotting was performed as described in the text. (A) representative blots showing the levels of p-HSL, HSL and tubulin and (B) densitometry values of p-HSL and HSL normalized to tubulin. * indicates a significant increase (P < 0.05) in the expression of p-HSL in ShcKO mice. Data are mean ± SEM; n = 6 per group.
3.5 Levels of the three Shc isoforms
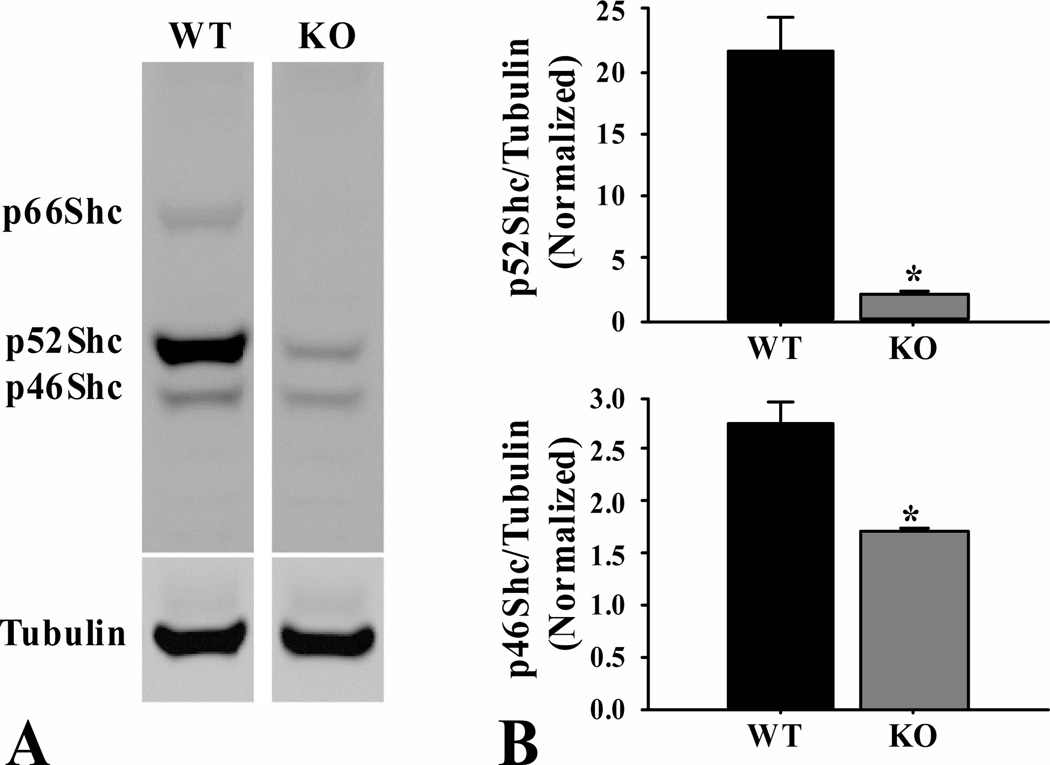
The levels of p46Shc, p52Shc and p66Shc proteins were measured in skeletal muscle from fasted mice (Fig. 7). As expected, there was no detectable p66Shc in the ShcKO mice (Fig. 7A). The levels of p52Shc and p46Shc were decreased by 90% (P < 0.05) and 37% (P < 0.05), respectively, in the ShcKO compared to wild-type mice (Fig. 7B).
Figure 7.
Protein levels of Shc isoforms from fasted ShcKO (KO) and wild-type (WT) mice. (A) Western blotting shows decreased levels of the p46Shc and p52Shc isoforms and absence of p66Shc in the KO mice. (B) Densitometry values of p46Shc and p52Shc isoforms normalized to tubulin, indicates a significant decrease (P < 0.05) in their expression in ShcKO mice. Data are mean ± SEM; n = 6 per group.
The levels of phosphorylated p52Shc and p46Shc are decreased in fasted compared to fed wild-type mice (Supplementary Fig. S2). However, the levels of non-phosphorylated p46Shc, P52Shc and p66Shc are not different between fed and fasted wild-type mice (Supplementary Fig. S2).
3.6 Mitochondrial content of tissues
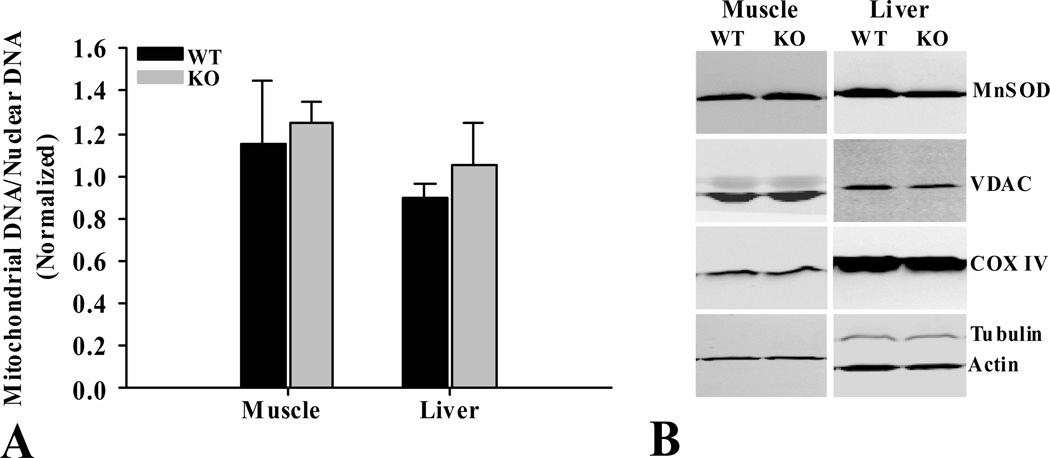
To assess the influence of Shc on mitochondrial content of tissues, mitochondrial to nuclear DNA ratio and the levels of select mitochondrial proteins (MnSOD, VDAC and COX IV) were measured in skeletal muscle and liver from fasted mice (Fig. 8). There were no differences in the mitochondrial to nuclear DNA ratios (Fig. 8A) or the levels of mitochondrial proteins (Fig. 8B), between ShcKO and wild-type mice for the tissues investigated.
Figure 8.
Mitochondrial content of skeletal muscle and liver from ShcKO (KO) and wild-type (WT) mice. (A) Mitochondrial and nuclear DNA were determined and the ratio calculated as described in the text. (B) Levels of key mitochondrial proteins (Mn-SOD, VDAC, COX IV) were also determined by western blotting, as described in the text. These two measures were taken as indicators of mitochondrial content of tissues investigated. No differences were observed between KO and WT mice for the tissues investigated. Data are mean ± SEM; n = 6 per group.
3.7 Mitochondrial Respiration
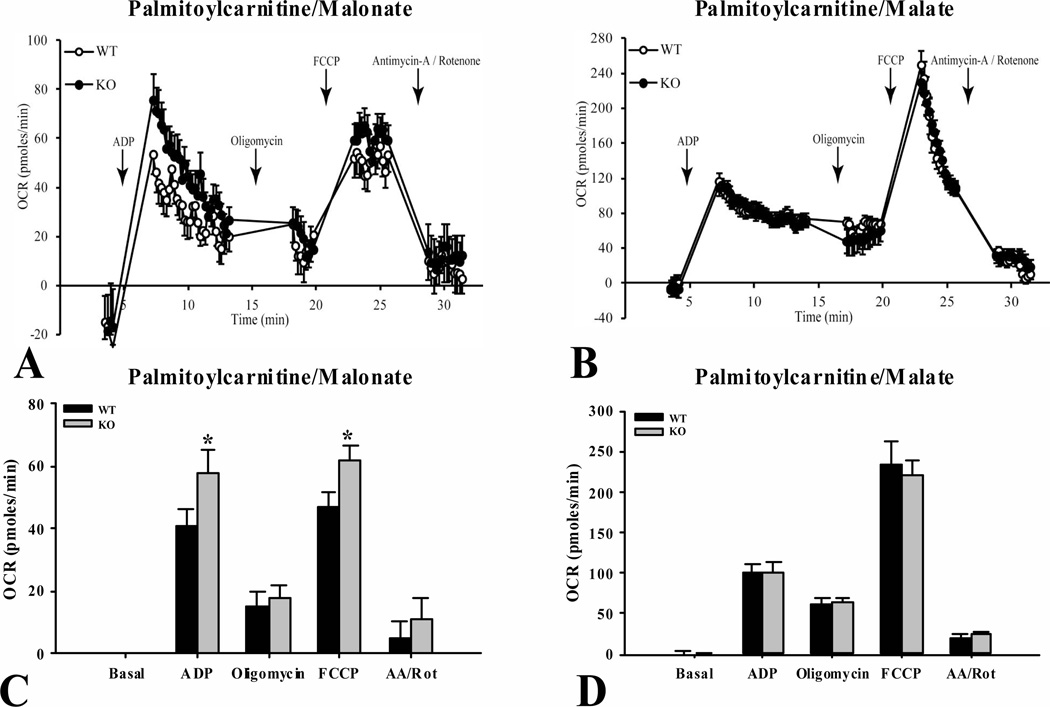
Significant increases (P < 0.05) were observed in State 3 (ADP-stimulated) and maximal (FCCP uncoupled) respiration in the ShcKO versus wild-type mitochondria when respiring on palmitoyl-L-carnitine and malonate (Fig. 9A and 9C). Malonate, a citric acid cycle inhibitor, was used to allow measurements of oxygen consumption reflecting only the capacity of the β-oxidation enzyme system. Total substrate oxidation capacity through β-oxidation and the citric acid cycle was assessed by measuring oxygen consumption in liver mitochondria respiring on palmitoyl-L-carnitine and malate, with no differences being observed between the ShcKO and wild-type mice (Fig. 9B and 9D).
Figure 9.
Oxygen consumption rates (OCR) of liver mitochondria isolated from fasted ShcKO (KO) and wild-type (WT) mice. Respiration was initiated in mitochondria, in the presence of palmitoyl-L-carnitine, with 10 mM malonate (A) to measure flux through β-oxidation alone, and with 2 mM malate (B) to measure flux through β-oxidation and the TCA cycle. Values from panel A were plotted, showing significant differences (P < 0.05) between KO and WT for peak OCR with ADP and FCCP in the presence of malonate (C). Also, values from panel B were plotted, showing no significant differences between KO and WT with ADP and FCCP in the presence of malate (D). Data are mean ± SEM; n = 6 per group. * P < 0.05 between KO and WT mice.
3.8 Expression of proteins involved in fatty acid oxidation
The levels of select proteins involved in fatty acid oxidation (VLCAD, MCAD, ETF and ACAA) were determined by Western blotting in skeletal muscle (Supplementary Fig. S3) collected from fasted mice. There were no differences in the levels of any of these proteins between ShcKO and wild-type mice.
4. Discussion
Previous studies have shown that ShcKO mice are resistant to weight gain on a high fat diet [11,12]. Also, ShcKO mice consuming a chow diet have smaller fat pads than wild-type animals although their energy intake is the same as the wild-type mice [12], and results from the present study indicate that significant differences in fat pa d weights are already present in the ShcKO mice by 3 months of age (Table 1). These results suggest that under some conditions there is an increase in fatty acid oxidation in the ShcKO mice. The observation that phosphorylated p46Shc and p52Shc levels are decreased in muscle with fasting provides indirect evidence that Shc proteins may play a role in the transition from the fed to fasted state. However, to our knowledge, there is no information about the influence of decreased Shc protein levels on the activities of β-oxidation enzymes. The purpose of the present study was to determine if the activities of the β-oxidation enzymes acyl-CoA dehydrogenase, 3-hydroxyacyl-CoA dehydrogenase and ketoacyl-CoA thiolase are altered in skeletal muscle and liver from ShcKO compared to wild-type mice under both fed and fasted conditions. There are two primary conclusions from the study. First, the activities of the three measured β-oxidation enzymes are increased in fasted ShcKO compared to wild-type mice, consistent with an increased capacity for β-oxidation in the ShcKO animals. Second, the activities of acyl-CoA dehydrogenase and 3-hydroxyacyl-CoA dehydrogenase are rapidly decreased in both liver and muscle of ShcKO, but not wild-type animals, with feeding. These results suggest that sensitivity of β-oxidation enzymes to food intake is greatly increased in ShcKO mice.
The increases in activities of β-oxidation enzymes observed in fasting ShcKO mice are similar to the enzyme changes observed under physiological conditions, such as exercise training [26–29] and chronic consumption of high fat diets [30–32], which require increased capacity for fatty acid oxidation. Unlike these chronic enzyme changes, the increase in activity of β-oxidation enzymes in ShcKO animals was rapid (16 hours of fasting), suggesting that low levels of Shc proteins in muscle and liver may lower the threshold for increasing the activity of β-oxidation enzymes in response to a period of food deprivation.
In addition to increased activity of β-oxidation enzymes, ShcKO mice also had elevated levels of phosphorylated hormone sensitive lipase in adipose tissue when compared to wild-type animals. Hormone sensitive lipase is activated by phosphorylation [33] and both the level and activity of this enzyme are significantly correlated with lipolytic capacity in human fat cells [34]. The results of the present study indicate that ShcKO mice show changes consistent with an increase in capacity for both β-oxidation and lipolysis.
It is possible that increases in activity of β-oxidation enzymes in the ShcKO mice reflect an increase in overall capacity for substrate oxidation in these animals. One way to determine if this is the case is to compare the activities of enzymes from distinct metabolic pathways. HAD/CS has been used to assess capacity for fatty acid oxidation versus overall aerobic metabolism [32,35] and LDH/HAD and LDH/CS have been used to assess capacity for anaerobic metabolism versus fatty acid oxidation or overall aerobic metabolism, respectively [32]. The increase in HAD/CS and decrease in LDH/HAD observed in the ShcKO mice in the present study under fasting conditions is consistent with an increase in capacity for fatty acid oxidation without a corresponding increase in capacity for aerobic or anaerobic metabolism in muscle from these animals. These results suggest a switch towards a preference for fatty acid as a substrate for oxidation in the ShcKO mice. In support of this idea, it has been shown that increased HAD/CS ratios in muscle are observed in strains of mice that are resistant to developing obesity despite self-selecting diets containing high amounts of fat [36]. Similarly, weight gain in rats fed a high fat diet is inversely related to the HAD/CS ratio in ske letal muscle [35]. It is possible that the increased HAD/CS ratio observed in ShcKO mice may help these animals oxidize fatty acids and may help explain why they resist weight gain when consuming a high fat diet.
Endurance exercise training induces an increase in mitochondrial biogenesis [37], and this contributes to increased capacity for fatty acid and overall substrate oxidation. However, the results of our study indicate that changes in the activities of β-oxidation enzymes in the ShcKO occur independently of alterations in mitochondrial biogenesis. The fact that neither mitochondrial to nuclear DNA ratio nor the levels of mitochondrial proteins were altered in the ShcKO mice provides strong evidence that mitochondrial number is not altered in these animals. Another way to determine if capacity for β-oxidation and overall substrate oxidation are altered in ShcKO animals is to measure oxygen consumption in mitochondria respiring on fatty acid substrates. These measurements with either malate (stimulate the citric acid cycle) or malonate (inhibit the citric acid cycle) have been used to determine capacity of β-oxidation alone or capacity of both β-oxidation and the citric acid cycle [25]. The results of our mitochondrial respiration studies indicate that capacity for β-oxidation is increased in the ShcKO mice without an increase in overall substrate oxidation capacity. This is consistent with the idea that ShcKO may promote nutrient partitioning towards increased utilization of fatty acids when lipids become available.
The results of our study suggest that changes in activities of β-oxidation enzymes in the ShcKO mice occur independently of alterations in enzyme amount, since we observed no increases in levels of proteins involved in fatty acid oxidation in either liver or skeletal muscle with fasting in the ShcKO mice. Enzymes of β-oxidation undergo post-translational modifications, including acetylation [38], phosphorylation [39] and nitrosylation [39], and these modifications likely influence enzyme activity. In addition, it is possible that Shc proteins may directly interact with enzymes of β-oxidation to influence their activities. Additional studies are needed to determine if Shc proteins influence the activities of fatty acid oxidation enzymes through post-translational modifications or direct interaction of Shc proteins with the enzymes It has been proposed that Shc-mediated ROS production suppresses the expression of β-oxidation enzymes [2] and it has been reported that Shc inhibits β-oxidation in adipocytes [12]. Our study provides the first evidence that the activities of β-oxidation enzymes are increased in ShcKO mice and changes consistent with increased β-oxidation occur in tissues other than adipose tissue. It is possible that Shc-mediated changes in ROS production may also contribute to the observed results.
During periods of fasting, the mobilization of fatty acids from adipose tissue fuels β-oxidation and leads to an increase in ketone body metabolism. To determine if the activities of ketolytic enzymes are altered in ShcKO mice, the activities of acetoacetyl-CoA thiolase, β-hydroxybutyrate dehydrogenase and 3-oxoacid CoA-transferase were measured in skeletal muscle. It has been shown that endurance training (treadmill running) over a 12 week period increases the activities of acetoacetyl-CoA thiolase, β-hydroxybutyrate dehydrogenase and 3-oxoacid CoA-transferase in rat skeletal muscle [40]. A 48 hour fast was also shown to increase the activity of 3-oxoacid CoA-transferase in skeletal muscle from rats [41]. However, it is not known if an overnight (16 hour) fast is sufficient to increase ketolytic enzyme activity in skeletal muscle of mice. The results of the present study indicate that neither a 16 hour fast nor genotype (wild-type versus ShcKO) alter muscle capacity for ketolysis. Although there was at least a trend towards increases in the activities of acetoacetyl-CoA thiolase and β-hydroxybutyrate dehydrogenase in muscle from fasted ShcKO mice, the activity of the rate limiting enzyme (3-oxoacid CoA-transferase) of ketolysis [42,43] was not altered in these animals. Thus, the decrease in Shc levels in ShcKO mice contributes to an increase in muscle β-oxidation enzyme activity but not an increase in capacity for ketolysis following a 16 hour fast. Additional studies are needed with longer periods of fasting or exercise training to further determine if the ShcKO mice show changes in the response to conditions which maximize ketolysis.
The enzymes β-hydroxybutyrate dehydrogenase and acetoacetyl-CoA thiolase are components of both the ketone body synthesis and oxidation pathways. The activities of these enzymes were measured in liver to provide an indication if the pathway for ketone body synthesis is altered in ShcKO mice. It has been shown in rats that the activity of liver acetoacetyl-CoA thiolase is not altered following a 48 hour fast [44]. Our results indicate that mice are more sensitive to fasting than rats, and show an increase in β-hydroxybutyrate dehydrogenase and acetoacetyl-CoA thiolase activities by 16 hours of fasting. The ShcKO mice, however, already show higher liver β-hydroxybutyrate dehydrogenase and acetoacetyl-CoA thiolase activities than wild-type mice in a fed and fasted states and show no further increases in the activities of these enzymes with fasting. Thus, the decreased Shc levels in ShcKO mice appear to induce chronic elevations in the activities of liver ketogenic enzymes, and this could allow rapid increases in ketone body synthesis under conditions of increased supply of fatty acids to the liver.
It is not possible at this time to determine which of the specific Shc isoforms are responsible for the changes in enzyme activities observed in the ShcKO mice. We have previously shown that, unlike the ShcKO animals, mice showing only loss of p66Shc do not show resistance to weight gain on a high fat diet [11]. This at least suggests that p46 and/or p52Shc, rather than p66Shc, may be responsible for altering lipid metabolism. However, additional work is needed to determine which specific Shc isoform is responsible for the observed changes in the activities of β-oxidation and ketone body enzyme activities.
The results of the present study show that there is a concerted change in enzyme activities in ShcKO mice which is consistent with an increase in capacity for fatty acid oxidation during fasting. However, additional studies are needed to determine the conditions under which these enzyme changes result in differences in flux through β-oixdation and ketone metabolism pathways. Further studies are also needed to determine if decreases in Shc levels are a viable target for developing interventions to promote fatty acid oxidation in conjunction with weight loss.
In conclusion, the results of the present study indicate that Shc proteins influence the activities of enzymes involved in fatty acid oxidation and ketogenesis. In particular, the low Shc protein levels in ShcKO mice appear to stimulate the activity of muscle β-oxidation enzymes in response to fasting and induce chronic increases in the activity of ketogenic enzymes in liver. These results suggest that Shc proteins may inhibit fatty acid oxidation. Increased capacity for β-oxidation may contribute to the low body fat in ShcKO mice. Decreases in the level of Shc proteins should be considered as possible contributors to the stimulation of fatty acid oxidation enzymes in response to physiological conditions which increase reliance on fatty acids as an energy source.
Supplementary Material
Supplementary Figure 1S. Enzyme activity ratios from livers of wild-type (WT) and ShcKO (KO) mice. The activities of citrate synthase (CS) and hydroxyacyl-CoA dehydrogenase (HAD) were measured and the ratio HAD/CS was calculated, under fed (A) and fasted (B) conditions. Data are mean ± SEM; n = 6 per group. * P < 0.05 between KO and WT mice.
Supplementary Figure 2S. Protein levels of phosphorylated and non-phosphoryalted Shc isoforms in skeletal muscle from wild-type (WT) mice following a 16 hour fast (Fasted) or 16 hour fast followed by 3 hours of re-feeding (Fed).
Supplementary Figure 3S. Levels of protein involved in β-oxidation as determined by western blotting (A). Protein levels were normalized to tubulin and the values for the ShcKO mice were expressed as a percentage of the wild-type values (B). VLCAD, very long chain acyl-CoA dehydrogenase; MCAD, medium chain acyl-CoA dehydrogenase; ETF, electron transfer flavoprotein; ACAA1 and ACAA2, acetoacetyl-CoA thiolase. No significant differences were observed between ShcKO and wild-type mice for any of the proteins.
Acknowledgements
We thank Dr. Pier Guiseppe Pelicci for providing the ShcKO mice used to establish a colony at UC Davis.
Funding
This work was supported by National Institutes of Health/National Institute on Aging grant P01 AG025532.
List of abbreviations
- ShcKO
Shc knockout
- DCPIP
2,6-dichlorophenolindophenol
- PMS
phenazine methosulfate
- FCCP
carbonyl cyanide 4-(trifluoromethoxy)phenylhydrazone
- MnSOD
manganese superoxide dismutase
- VDAC
voltage dependent anion channel
- MCAD
medium chain acyl-CoA dehydrogenase
- VLCAD
very long chain acyl-CoA dehydrogenase
- ACAA1 and ACAA2
acetoacetyl-CoA thiolase
- PMSF
Phenylmethanesulfonyl fluoride
- ETF
electron transfer flavoprotein
- TCA
tricarboxylic acid
- COX IV
complex IV
- OCR
oxygen consumption rate
Footnotes
Publisher's Disclaimer: This is a PDF file of an unedited manuscript that has been accepted for publication. As a service to our customers we are providing this early version of the manuscript. The manuscript will undergo copyediting, typesetting, and review of the resulting proof before it is published in its final citable form. Please note that during the production process errors may be discovered which could affect the content, and all legal disclaimers that apply to the journal pertain.
Conflict of Interest
There are no conflicts of interest associated with this work.
Authors’ contributions:
KH performed the enzyme/protein assays and contributed towards study design, data analysis and writing/editing of the manuscript. AAT, NT and AKL performed the molecular biology and western blotting experiments. KK and SLT performed the statistical analysis of data. GAC contributed to the study design and review of manuscript. RBM contributed to the breeding of the mice and manuscript review. JJR contributed to the study design, data analysis and writing/editing of the manuscript
REFERENCES
- 1.Raffaello A, Rizzuto R. Mitochondrial longevity pathways. Biochim Biophys Acta. 2011;1813:260–268. doi: 10.1016/j.bbamcr.2010.10.007. [DOI] [PubMed] [Google Scholar]
- 2.Trinei M, Berniakovich I, Beltrami E, et al. P66Shc signals to age. Aging (Albany NY) 2009;1:503–510. doi: 10.18632/aging.100057. [DOI] [PMC free article] [PubMed] [Google Scholar]
- 3.Migliaccio E, Mele S, Salcini AE, et al. Opposite effects of the p52shc/p46shc and p66shc splicing isoforms on the EGF receptor -MAP kinase-fos signalling pathway. EMBO J. 1997;16:706–716. doi: 10.1093/emboj/16.4.706. [DOI] [PMC free article] [PubMed] [Google Scholar]
- 4.Pelicci G, Lanfrancone L, Grignani F, et al. A novel transforming protein (SHC) with an SH2 domain is implicated in mitogenic signal transduction. Cell. 1992;70:93–104. doi: 10.1016/0092-8674(92)90536-l. [DOI] [PubMed] [Google Scholar]
- 5.Pronk GJ, de Vries-Smits AM, Buday L, et al. Involvement of Shc in insulin- and epidermal growth factor-induced activation of p21ras. Mol Cell Biol. 1994;14:1575–1581. doi: 10.1128/mcb.14.3.1575. [DOI] [PMC free article] [PubMed] [Google Scholar]
- 6.Sasaoka T, Rose DW, Jhun BH, et al. Evidence for a functional role of Shc proteins in mitogenic signaling induced by insulin, insulin-like growth factor-1, and epidermal growth factor. J Biol Chem. 1994;269:13689–13694. [PubMed] [Google Scholar]
- 7.Gelderloos JA, Rosenkranz S, Bazenet C, et al. A role for Src in signal relay by the platelet-derived growth factor alpha receptor. J Biol Chem. 1998;273:5908–5915. doi: 10.1074/jbc.273.10.5908. [DOI] [PubMed] [Google Scholar]
- 8.Yokote K, Mori S, Hansen K, et al. Direct interaction between Shc and the platelet-derived growth factor beta-receptor. J Biol Chem. 1994;269:15337–15343. [PubMed] [Google Scholar]
- 9.Kousteni S, Bellido T, Plotkin LI, et al. Nongenotropic, sex-nonspecific signaling through the estrogen or androgen receptors: dissociation from transcriptional activity. Cell. 2001;104:719–730. [PubMed] [Google Scholar]
- 10.Ravichandran KS. Signaling via Shc family adapter proteins. Oncogene. 2001;20:6322–6330. doi: 10.1038/sj.onc.1204776. [DOI] [PubMed] [Google Scholar]
- 11.Tomilov AA, Ramsey JJ, Hagopian K, et al. The Shc locus regulates insulin signaling and adiposity in mammals. Aging Cell. 2011;10:55–65. doi: 10.1111/j.1474-9726.2010.00641.x. [DOI] [PMC free article] [PubMed] [Google Scholar]
- 12.Berniakovich I, Trinei M, Stendardo M, et al. p66Shc -generated oxidative signal promotes fat accumulation. J Biol Chem. 2008;283:34283–34293. doi: 10.1074/jbc.M804362200. [DOI] [PMC free article] [PubMed] [Google Scholar]
- 13.Ranieri SC, Fusco S, Panieri E, et al. Mammalian life-span determinant p66shcA mediates obesity-induced insulin resistance. Proc Natl Acad Sci U S A. 2010;107:13420–13425. doi: 10.1073/pnas.1008647107. [DOI] [PMC free article] [PubMed] [Google Scholar]
- 14.Okamura-Ikeda K, Ikeda Y, Tanaka K. An essential cysteine residue located in the vicinity of the FAD-binding site in short-chain, medium-chain, and long-chain acyl-CoA dehydrogenases from rat liver mitochondria. J Biol Chem. 1985;260:1338–1345. [PubMed] [Google Scholar]
- 15.Zhang D, Yu W, Geisbrecht BV, et al. Functional characterization of Delta3,Delta2-enoyl-CoA isomerases from rat liver. J Biol Chem. 2002;277:9127–9132. doi: 10.1074/jbc.M112228200. [DOI] [PubMed] [Google Scholar]
- 16.Middleton B. 3-Ketoacyl-CoA thiolases of mammalian tissues. Methods Enzymol. 1975;35:128–136. doi: 10.1016/0076-6879(75)35148-3. [DOI] [PubMed] [Google Scholar]
- 17.Shephard D, Garland PB. Citrate synthase from rat liver. Methods Enzymol. 1969;13:11–16. [Google Scholar]
- 18.Bergmeyer HU, Bernt E. Lactate dehydrogenase. In: Bergmeyer HU, editor. Methods of Enzymatic Analysis. New York: Academic Press; 1974. pp. 574–579. [Google Scholar]
- 19.Miyazawa S, Osumi T, Hashimoto T. The presence of a new 3-oxoacyl-CoA thiolase in rat liver peroxisomes. Eur J Biochem. 1980;103:589–596. doi: 10.1111/j.1432-1033.1980.tb05984.x. [DOI] [PubMed] [Google Scholar]
- 20.Lehninger AL, Sudduth HC, Wise JB. D-b-hydroxybutyrate dehydrogenase of mitochondria. J Biol Chem. 1960;235:2450–2455. [PubMed] [Google Scholar]
- 21.Rebrin I, Bregere C, Kamzalov S, et al. Nitration of tryptophan 372 in succinyl-CoA:3-ketoacid CoA transferase during aging in rat heart mitochondria. Biochemistry. 2007;46:10130–10144. doi: 10.1021/bi7001482. [DOI] [PMC free article] [PubMed] [Google Scholar]
- 22.Venditti P, De Rosa R, Di Meo S. Effect of cold-induced hyperthyroidism on H2O2 production and susceptibility to stress conditions of rat liver mitochondria. Free Radic Biol Med. 2004;36:348–358. doi: 10.1016/j.freeradbiomed.2003.11.012. [DOI] [PubMed] [Google Scholar]
- 23.Hagopian K, Weber KL, Hwee DT, et al. Complex I-associated hydrogen peroxide production is decreased and electron transport chain enzyme activities are altered in n-3 enriched fat-1 mice. PLoS One. 2010;5 doi: 10.1371/journal.pone.0012696. e12696. [DOI] [PMC free article] [PubMed] [Google Scholar]
- 24.Rogers GW, Brand MD, Petrosyan S, et al. High throughput microplate respiratory measurements using minimal quantities of isolated mitochondria. PLoS One. 2011;6 doi: 10.1371/journal.pone.0021746. e21746. [DOI] [PMC free article] [PubMed] [Google Scholar]
- 25.Demizieux L, Degrace P, Gresti J, et al. Conjugated linoleic acid isomers in mitochondria: evidence for an alteration of fatty acid oxidation. J Lipid Res. 2002;43:2112–2122. doi: 10.1194/jlr.m200170-jlr200. [DOI] [PubMed] [Google Scholar]
- 26.Criswell D, Powers S, Dodd S, et al. High intensity training-induced changes in skeletal muscle antioxidant enzyme activity. Med Sci Sports Exerc. 1993;25:1135–1140. [PubMed] [Google Scholar]
- 27.Leick L, Lyngby SS, Wojtaszewski JF, et al. PGC-1alpha is required for training-induced prevention of age-associated decline in mitochondrial enzymes in mouse skeletal muscle. Exp Gerontol. 2010;45:336–342. doi: 10.1016/j.exger.2010.01.011. [DOI] [PubMed] [Google Scholar]
- 28.Hansen AK, Fischer CP, Plomgaard P, et al. Skeletal muscle adaptation: training twice every second day vs. training once daily. J Appl Physiol. 2005;98:93–99. doi: 10.1152/japplphysiol.00163.2004. [DOI] [PubMed] [Google Scholar]
- 29.Call JA, Voelker KA, Wolff AV, et al. Endurance capacity in maturing mdx mice is markedly enhanced by combined voluntary wheel running and green tea extract. J Appl Physiol. 2008;105:923–932. doi: 10.1152/japplphysiol.00028.2008. [DOI] [PMC free article] [PubMed] [Google Scholar]
- 30.Turner N, Bruce CR, Beale SM, et al. Excess lipid availability increases mitochondrial fatty acid oxidative capacity in muscle: evidence against a role for reduced fatty acid oxidation in lipid-induced insulin resistance in rodents. Diabetes. 2007;56:2085–2092. doi: 10.2337/db07-0093. [DOI] [PubMed] [Google Scholar]
- 31.Nemeth PM, Rosser BW, Choksi RM, et al. Metabolic response to a high-fat diet in neonatal and adult rat muscle. Am J Physiol. 1992;262:C282–C286. doi: 10.1152/ajpcell.1992.262.2.C282. [DOI] [PubMed] [Google Scholar]
- 32.Simi B, Sempore B, Mayet MH, et al. Additive effects of training and high-fat diet on energy metabolism during exercise. J Appl Physiol. 1991;71:197–203. doi: 10.1152/jappl.1991.71.1.197. [DOI] [PubMed] [Google Scholar]
- 33.Stralfors P, Belfrage P. Phosphorylation of hormone -sensitive lipase by cyclic AMP-dependent protein kinase. J Biol Chem. 1983;258:15146–15152. [PubMed] [Google Scholar]
- 34.Large V, Arner P, Reynisdottir S, et al. Hormone-sensitive lipase expression and activity in relation to lipolysis in human fat cells. J Lipid Res. 1998;39:1688–1695. [PubMed] [Google Scholar]
- 35.Gayles EC, Pagliassotti MJ, Prach PA, et al. Contribution of energy intake and tissue enzymatic profile to body weight gain in high-fat-fed rats. Am J Physiol. 1997;272:R188–R194. doi: 10.1152/ajpregu.1997.272.1.R188. [DOI] [PubMed] [Google Scholar]
- 36.Leibowitz SF, Alexander J, Dourmashkin JT, et al. Phenotypic profile of SWR/J and A/J mice compared to control strains: possible mechanisms underlying resistance to obesity on a high-fat diet. Brain Res. 2005;1047:137–147. doi: 10.1016/j.brainres.2005.03.047. [DOI] [PubMed] [Google Scholar]
- 37.Holloszy JO. Regulation by exercise of skeletal muscle content of mitochondria and GLUT4. J Physiol Pharmacol. 2008;59(Suppl 7):5–18. [PubMed] [Google Scholar]
- 38.Zhao S, Xu W, Jiang W, et al. Regulation of cellular metabolism by protein lysine acetylation. Science. 2010;327:1000–1004. doi: 10.1126/science.1179689. [DOI] [PMC free article] [PubMed] [Google Scholar]
- 39.Distler AM, Kerner J, Hoppel CL. Post-translational modifications of rat liver mitochondrial outer membrane proteins identified by mass spectrometry. Biochim Biophys Acta. 2007;1774:628–636. doi: 10.1016/j.bbapap.2007.03.012. [DOI] [PMC free article] [PubMed] [Google Scholar]
- 40.Winder WW, Baldwin KM, Holloszy JO. Exercise-induced increase in the capacity of rat skeletal muscle to oxidize ketones. Can J Physiol Pharmacol. 1975;53:86–91. doi: 10.1139/y75-011. [DOI] [PubMed] [Google Scholar]
- 41.Williamson DH, Bates MW, Page MA, et al. Activities of enzymes involved in acetoacetate utilization in adult mammalian tissues. Biochem J. 1971;121:41–47. doi: 10.1042/bj1210041. [DOI] [PMC free article] [PubMed] [Google Scholar]
- 42.Laffel L. Ketone bodies: a review of physiology, pathophysiology and application of monitoring to diabetes. Diabetes Metab Res Rev. 1999;15:412–426. doi: 10.1002/(sici)1520-7560(199911/12)15:6<412::aid-dmrr72>3.0.co;2-8. [DOI] [PubMed] [Google Scholar]
- 43.Fukao T, Lopaschuk GD, Mitchell GA. Pathways and control of ketone body metabolism: on the fringe of lipid biochemistry. Prostaglandins Leukot Essent Fatty Acids. 2004;70:243–251. doi: 10.1016/j.plefa.2003.11.001. [DOI] [PubMed] [Google Scholar]
- 44.Williamson DH, Bates MW, Krebs HA. Activity and intracellular distribution of enzymes of ketone-body metabolism in rat liver. Biochem J. 1968;108:353–361. doi: 10.1042/bj1080353. [DOI] [PMC free article] [PubMed] [Google Scholar]
Associated Data
This section collects any data citations, data availability statements, or supplementary materials included in this article.
Supplementary Materials
Supplementary Figure 1S. Enzyme activity ratios from livers of wild-type (WT) and ShcKO (KO) mice. The activities of citrate synthase (CS) and hydroxyacyl-CoA dehydrogenase (HAD) were measured and the ratio HAD/CS was calculated, under fed (A) and fasted (B) conditions. Data are mean ± SEM; n = 6 per group. * P < 0.05 between KO and WT mice.
Supplementary Figure 2S. Protein levels of phosphorylated and non-phosphoryalted Shc isoforms in skeletal muscle from wild-type (WT) mice following a 16 hour fast (Fasted) or 16 hour fast followed by 3 hours of re-feeding (Fed).
Supplementary Figure 3S. Levels of protein involved in β-oxidation as determined by western blotting (A). Protein levels were normalized to tubulin and the values for the ShcKO mice were expressed as a percentage of the wild-type values (B). VLCAD, very long chain acyl-CoA dehydrogenase; MCAD, medium chain acyl-CoA dehydrogenase; ETF, electron transfer flavoprotein; ACAA1 and ACAA2, acetoacetyl-CoA thiolase. No significant differences were observed between ShcKO and wild-type mice for any of the proteins.


